Issues
ISSN: 2146-4138
available at http: www.econjournals.com
International Journal of Economics and Financial Issues, 2019, 9(5), 77-89.
The Dynamics of Livelihood Vulnerability Index at Farm
Household Level: An Empirical Analysis of the Coastal Sandy
Zone in Thua Thien Hue Province, Vietnam
Dao Duy Minh
1,2*, Philippe Lebailly
1, Nguyen Dang Hao
2, Philippe Burny
1, Ho Thi Minh Hop
11Department of Economics and Rural Development, Gembloux Agro-Bio Tech, University of Liège, Gembloux 5030, Belgium, 2Department of Economics and Development Studies Hue College of Economics, Hue University, 99 Ho Dac Di, Hue city, Vietnam.
*Email: daominh88@gmail.com
Received: 14 June 2019 Accepted: 29 August 2019 DOI: https://doi.org/10.32479/ijefi.8250
ABSTRACT
Rural households in Vietnam have been facing various adverse impacts on their livelihoods. By using 28 indicators of sustainable livelihood framework (SLF), this study aims to identify the livelihood vulnerability index (LVI) of the households in the coastal sandy zone in Thua Thien Hue (TTH). Based on the baseline data in 2007-2008, the study conducted a survey of 110 households living in four districts of the region to have a thorough evaluation of LVI. The results showed that excluding the increase in natural capital index (0.194-0.225), the value of LVI reduced in the dimension of human capital (0.365-0.363), social capital (0.081-0.075), physical capital (0.139-0.048) and financial capital (0.405-0.273). In overall, the value of the LVI index scored 0.244 in 2007-2008 and 0.214 in 2017-2018, respectively. The research findings contribute a deeper understanding of the vulnerable context of household communities that support the issuance of policy intervention, a social project as well as impact assessment of the given factors such as change of vulnerable contexts, structure and process.
Keywords: Empirical Analysis, Farm Households, Rural Development JEL Classifications: D120, Q120, R 580
1. INTRODUCTION
Various studies were conducted to evaluate the livelihood vulnerability index at the household level but most of them merely tried to assess the value of the index by district or country at one specific time (Dhanani and Islam, 2002; Hahn et al., 2009b; Shah et al., 2013a; Ahsan and Warner, 2014; Duy et al., 2014; Pandey et al., 2017). This study applies a longitudinal survey by using a baseline study from 2009 of Hao to capture the evolution of the vulnerable index of households for long-term policy’s vision. This approach could contribute significantly as a practical tool to having a thorough evaluation on the household’s profile that will act as a foundation for the policymakers and policy implementors to implement a significant policy to accomplish the purpose
of sustainable livelihood strategy. In practice, the assessment of vulnerability has been considered a vital step to figure out the design, evaluation and direction of programs at multi-level (Sujakhu et al., 2018). An evaluation of livelihood vulnerability index (LVI) including three dimensions of vulnerability, adaptive capacity and exposure will provide the significant story of the households in 10 years. The changes of livelihood capitals will be identified to understand the drawbacks and achievements for the aims of proposing sustainable livelihood development under the context of vulnerability. It will also be the additional evidence for the government to focus on the negative sides of each capital. To implement the study, it is a must to answer some research questions: (i) What are the leading indicators that should be taken into account to calculate the LVI? (ii) What are the main changes This Journal is licensed under a Creative Commons Attribution 4.0 International License
of LVI and each major component in 10 years? (iii) What are the main reasons causing the change of LVI and each element in 10 years? (iv) From the findings of LVI and each major component, what are the essential solutions/recommendations that should be implemented to reduce the LVI?
Being primarily lived on agricultural activities, rural households in developing countries have been facing various adverse impacts threatening their livelihoods (Martin and Lorenzen, 2016). It was the fact that the linkage of households and farming operations with vulnerability has often been noted as vicious cycles. There is a diversification of vulnerable contexts such as shocks, trends, and seasonality. It can also be supplemented with the change of job opportunities, fluctuation of market prices and the effect of extreme natural hazard events (DFID, 2008a). Recently, climate change and its issues have been considering as the most critical challenge in the XXI century. It is followed by unforecastable trends and severe impacts. Climate changes in the form of temperature increase, rainfall reduction, and sea level rise have had severe impacts on livelihood strategy and outcome of the households (Vincent, no date; IPCC, 2014b). Many scholars have conducted various studies on the relationship between vulnerability and climate change. Climate change is also seen as an importantly contributed factor of analysis on vulnerability (Sujakhu et al., 2018).
The rural households in Vietnam and their livelihoods highly depend on agriculture. However, the dependency could vary by region (Thi, 2018). Owing to characteristics of the agricultural sector, the outputs significantly depended on the weather conditions (Giang and Pfau, 2009; Ngo et al., 2018; Nguyen et al., 2018). There is no doubt that this sector has made a significant contribution to Vietnam’s economic development strategy, but it still exited diversification of drawbacks. The fact that is located in the central flooding zone of South East Asia, Vietnam was in the top five of countries impacted heavily by climate change (Navrud et al., 2012). As a consequence, the losses in agricultural activities may put the households into the vulnerable context. In other aspects, various worrisome stories of market price caused the difficulties to the households.
For the context of the research site, after the “doimoi” transformation, the implemented economy-oriented guidelines have been significantly contributing to the economic development especially in the dimension of poverty reduction, food security and Vietnam’s position changing from food import to export. From the 1990s to 2000s, Vietnam focused the capital for developing the North and South regions (represented by Hanoi and Ho Chi Minh city). As a consequence, there was a big gap between the given areas and the rest of Vietnam including the central region where TTH province is located. In the middle of the 2000s, Vietnam changed its strategy. The central government reallocated the capital to develop other regions. Being located in the central region of Vietnam, TTH province experienced a much slower economic growth, especially the coastal areas are even more underdeveloped, and the poverty rate is ranked the highest in Vietnam (Thi, 2018). With over 70% of households lived in rural areas, the majority of income sourced from agricultural activities such as wet rice cultivation, small-scale poultry farming
and aquaculture (“Nguyen,” 2008). Hence, there were various adverse issues of climate variability such as early occurrence of flood and storm, temperature increase in summer and rainfall reduction in winter that have been affecting the livelihood strategy of the households (Ministry of Resource and Enviroment, 2010; IPCC, 2014b). In the labor force dimension, a majority of the labor force were low-skilled and untrained causing difficulties in having job opportunities. Recently, the migration wave could bring more opportunities for income diversification, but on another hand, this gave a fall in the labor force in the agricultural sector (VUSTA, 2011; Malik et al., 2013; Nguyen et al., 2015). Turning to land issues, various problems of small land area per capita, inequality of land allocation, low levels of soil fertility and land degradation put the households into the vulnerable context. Recently, although the local government has been implementing various policies to improve livelihood for tenants, they have still faced some current drawbacks such as lack of information, poor infrastructure conditions, low ability in getting access to credit and market. For a short conclusion, the given statements would aggravate the vulnerability of the households (Hao, 2009). There was still little information about the vulnerable index, especially in the approach of panel data to see changes in the vulnerability and these issues in a long-term period.
For the structure of the study, excluding the introduction, the next sections will present (i) the materials and methods, (ii) findings and discussions and (iii) conclusions and recommendations.
2. MATERIALS AND METHODS
2.1. Literature Review on Livelihood Vulnerability Index
The definition of livelihood vulnerability was firstly proposed in brief in the sustainable livelihood framework (SLF) in the midterm of 1980 (Chambers, 1989; Scoones, 1998). After that, this idea has been continuously applied by various practitioners with different fields of study in rural development (Carswell, 1997; Ellis, 1998; Hussein and Brighton, 1998; DFID, 2008b). Many studies focused on identifying the review of theory and definitions (Carswell, 1997; Bebbington, 1999; Smit and Wandel, 2006; Engle, 2011; Hinkel, 2011; Carr, 2014; Wiréhn et al., 2015; Baffoe, 2018) while the other tried to develop and apply the indicator system to empirical research (Vincent, no date; Hahn et al., 2009b; Few and Tran, 2010; Shah et al., 2013a; Ahsan and Warner, 2014; Nhuận, 2015; Huang et al., 2017; Adu et al., 2018; Huynh and Stringer, 2018a; Oo et al., 2018; Thi, 2018; Tuihedur et al., 2018; Zhang et al., 2018; Baffoe and Matsuda, 2018; Beringer and Kaewsuk, 2018; Bhattacharjee and Behera, 2018; Graham et al., 2018; Huynh and Stringer, 2018b). The concept of vulnerability was a broad-ranged approach by many principles from economics, sociology, anthropology as well as psychology and engineering (Adger, 2006; Sujakhu et al., 2018). LVI assessment was the vital step in developing adaptation strategies, policies and programs to reduce risks associated with climate change (Sujakhu et al., 2018; Thi, 2018). The vulnerability framework based on the IPCC definition (IPCC, 2001) is considered a powerful analytical tool for assessment. Based on this broader framework, Hahn et al. (2009) developed an indicator-based vulnerability assessment
that has been applied and added by many experts in different contexts (Thi, 2018).
Recently, many studies related vulnerability to the impacts of climate change (Smit and Wandel, 2006; Wall and Marzall, 2006; Ramamasy and Baas, 2007; Hassan and Nhemachena, 2008; Hahn et al., 2009a; Shah et al., 2013b; IPCC, 2014a; Olajide and Lawanson, 2014; Thornton et al., 2014; Oo et al., 2018). With the increasingly adverse impacts from climate change, vulnerability evaluations have drawn much attention in the literature (Tian et al., 2015). Most studies relied on the SLF to compose the group of indicators to carry out the vulnerability index in different ways but those shared a commonality with the construction of five sources of capitals namely social, human, physical, financial and natural that were under the influence of the vulnerable context. In detail, the LVI assessments included precise variables, such as socioeconomic status, access to land, age and gender, education level, occupations, migration strategy, education and social capital, access to credit with or without a specific environmental context, to measure vulnerability at the household level (Tian et al., 2015; Huynh and Stringer, 2018a; Thi, 2018). The purpose of using SLF generally aimed to propose solutions to achieve the livelihood outcomes such as income increase, well-being, food security, improved social balance and good adaption to climate issues. For boundary partners, this concept could be a powerful analytical tool for the government at different levels identifying the household’s profile that served for guiding normative analysis of actions to enhance well-being under the approach of reducing vulnerable (Adger, 2006). However, despite providing an excellent literature review on the vulnerable status, the findings from the overall of the LVI, they did not mention how the households were vulnerable and the used indicator of the LVI sometimes could not reflect in detail the people’s vulnerability (Tian et al., 2015). In a short discussion, it seems to be these variables having different explanations in different places/contexts (Tian et al., 2015). To carry out the LVI, many scholars proposed and applied a wide range of approaches; yet those shared some general steps. In the priority step, it was necessary to identify the indicators to collect information (Oo et al., 2018; Sujakhu et al., 2018). It depended on the purposes and characteristics of research sites, then the study would apply the appropriate indicator system (Sujakhu et al., 2018). The proposed index would be used to calculate the major components of LVI and LVI in overall. The findings generated from the LVI might be the foundation to study the adaptation strategy at the household level to cope with the risks in general as well as climate change (Engle, 2011; Zhang et al., 2018). Recently, some studies tried to evaluate the LVI and classified it into four quintiles and analyzed the factors affecting the LVI of the households (Sujakhu et al., 2018). However, this application could be used in the case of one specific time. Besides, some studies examined the LVI and took into account the view of the institutions and the interaction of actors in the institutions (Huynh and Stringer, 2018a). The findings proposed some valuable guidance not only at the household level but also at the local level. In the last term, the relevant studies of vulnerability were still limited. An interesting common point was that a majority of studies on vulnerability compared the LVI between district and district at the provincial
level (Hahn et al., 2009c; Viet, 2015; Wijayanti and Pratomo, 2016; Avogo et al., 2017; Huang et al., 2017; Baffoe and Matsuda, 2018). There was a fact that this index could also be utilized to conduct the collaborative research to examine the LVI by countries, and propose the solution at the regional level (Eriksen et al., 2005; Hahn et al., 2009c; Baffoe, 2018; Sujakhu et al., 2018). The states which could make the comparison usually shared common socio-economic conditions or geographical location (Duy et al., 2014). An assessment of the LVI generally comprised deductive argumentation, inductive argumentation, normative and non-substantial arguments under the context of climate change (Hinkel, 2011; Sujakhu et al., 2018). Some of the studies using cross-theoretical approaches included vulnerability, exposure and adaptive capacity. In which, vulnerability was most often conceptualized as being constituted by group components that include exposure and sensitivity to perturbations or external stresses, and the capacity to adapt (Adger, 2006). Exposure was the degree, duration, and/ or extent in which the system was in contact with, or subject to, the disturbance; sensitivity was the degree to which a system was modified or affected by a disorder; and the capacity to respond (also known as adaptive capacity) was the ability of a system to cope with or recover from the disturbance (Reed et al., 2013).
The fact that the idea of applying which framework and how many indicator systems should be used depends on many factors such as geographic conditions, socioeconomic status of research sites as well as types of literature that we have. No single approach should be flawlessly correct because it had some strengths and limitations (Oo et al., 2018). From the result of the baseline data in 2007-2008, this study adapted the indicators system from Hahn et al. in 2009 (Hahn et al., 2009c) and updated some new indicators from relevant documents that shared the same conditions with the research site in the case of Vietnam. This approach provided a complete picture of vulnerability with more relevance thanks to the past experience (Oo et al., 2018). Full of indicators applied in the model included 28 units that are divided into five major capitals. The strengths of this study are using the baseline study in 2007-2008 (Hao, 2009) that will provide a better understanding of vulnerability in 10 years; and also by using the appropriate methods of data collections such and historical profile, key informant interview, this will help to answer the vague questions about who is vulnerable and why.
Table 1 presents the factors and their proxies (indicators) that are used in published studies to assess vulnerability, as well as social vulnerability to climate change at a different scale.
2.2. Development of the LVI
Table 1 provides information about ten groups of components based on five sources of capital to build the LVI. Each indicator includes a measurement unit and relevant references. The calculation of LVI bases on a weighted balance approach introduced by Sullivan in 2002 where each sub-component contributes equally to the overall index (Sullivan, 2002b), to calculate LVI that needs to go through three stages. At first, it calculates the value of each indicator, then that of the major components, and finally all components in overall are constructed into the LVI.
The fact was that it was a diversification of measured variable in a different scale, so it needed to normalize each as the index with the same measurement. By doing that the human development index approach was used to calculate the life expectancy index (Cooke et al., 2007). The equation (1) is as follows:
Index St = (St–Smin)/(Smax–Smin) (1)
Where St is the actual value of sub-component for term t; Smin and Smax are the minimum and maximum values of each term. It needs to pay attention to some specific cases with different transformed methods. For example, the average time to travel to the health care center of sub-component ranges from 1 to 100 min of the survey. Then the minimum (0) and the maximum (100) value will be applied using the equation 1 to transform this indicator
Table 1: Indicators with relevant reference of livelihood vulnerability assessment
Component Status Indicator Relevant references
I. Human
Health New (1) HH with sanitary latrine/toilet
Modified (2) HH head often got sick (Hahn, Riederer and Foster, 2009c)
Modified (3) Average time to travel to the health care
center (Hahn, Riederer and Foster, 2009d; Shah et al., 2013a)
Livelihood strategy Modified (4) HH did not have at least one migrant (Hahn, Riederer and Foster, 2009c; Shah et al., 2013a; Wiréhn, Danielsson and Neset, 2015) Modified (5) HH lived on agriculture as major source of
income (Clark et al., 1998; Hahn, Riederer and Foster, 2009c; Shah et al., 2013a) Modified (6) HH with family member engaging in
non-farm activities (Shah et al., 2013a)
Modified (7) Average of livelihood diversification index (Hahn, Riederer and Foster, 2009c; Shah et al., 2013a; Ahsan and Warner, 2014; Huynh and Stringer, 2018b)
Knowledge and skill Modified (8) HH head with illiteracy (Hahn, Riederer and Foster, 2009b, 2009d;
Shah et al., 2013a; Ahsan and Warner, 2014) Modified (9) HH head only having primary school
education (Hahn, Riederer and Foster, 2009c)
Modified (10) HH head not joining the training course (Duy Can, Hong Tu and Thai Hoanh, 2014) II. Natural
Land Modified (11) Landless HH (Duy Can, Hong Tu and Thai Hoanh, 2014)
Modified (12) HH with small land scale (0.1-0.5 ha) (Duy Can, Hong Tu and Thai Hoanh, 2014) Natural resources Modified (13) HH lived on exploiting natural resources (Duy Can, Hong Tu and Thai Hoanh, 2014) Natural disasters and climate variability
Modified (14) Ave. no. of death or injuries caused by
severe floods in the past 10 years (Hahn, Riederer and Foster, 2009c) Modified (15) HH did not receive at least a flood
warning (Hahn, Riederer and Foster, 2009b)
Modified (16) Average number of floods/storms (Hahn, Riederer and Foster, 2009b)
Modified (17) SD of Average of rainfall per month (Hahn, Riederer and Foster, 2009c; Heltberg and Bonch-Osmolovskiy, 2011; Shah et al., 2013a)
Modified (18) SD of Average of temperature (Hahn, Riederer and Foster, 2009c; Heltberg and Bonch-Osmolovskiy, 2011; Shah et al., 2013a)
III. Social
Socio-demographic Modified (19) Female HH head (Hahn, Riederer and Foster, 2009c; Ahsan and
Warner, 2014)
Modified (20) Dependency ratio (Hahn, Riederer and Foster, 2009c; Ahsan and
Warner, 2014)
Modified (21) Poor HH (Vincent, no date; Clark et al., 1998; Neil
Adger, 1999; Siagian et al., 2014)
Socio networks Modified (22) HH receiving help when needed (Ahsan and Warner, 2014)
Modified (23) HH without having at least a membership
of any organizations (Hahn, Riederer and Foster, 2009c; Duy Can, Hong Tu and Thai Hoanh, 2014) IV. Physical
Housing and production means Modified (24) HH with temporary house (Duy Can, Hong Tu and Thai Hoanh, 2014) Modified (25) HH with affected house due to flood,
storm (partially/totally submerged) (Duy Can, Hong Tu and Thai Hoanh, 2014) Modified (26) HH reporting no access to production
means (Duy Can, Hong Tu and Thai Hoanh, 2014)
Physical vulnerability index (P) V. Finance and income
Modified (27) Lend money (Hahn, Riederer and Foster, 2009c; Ahsan and
Warner, 2014)
into a standardized index so the health component of the LVI can be taken into account. In the case of the average agricultural livelihood diversity index that needs to convert using the equation with the inverse (number livelihood activities +1). For example, one household has three farming activities including crops, animals and off-farm then converted value will be equal to 1/(1+3)=0.25. After that, the Eq. (1) is used to standardize the indicator. In this case, we come to an assumption that the household with more livelihood activities will reduce vulnerability. After each indicator was standardized, the sub-components were averaged using Eq. (2) to calculate the value of each major component (Hahn et al., 2009c).
Mt = (Index Sti)/n (2)
Where Mt is one of the ten major components, each term including health (H), livelihood strategy (LS), knowledge and skill (KK), land (L), natural resources (NR), natural disasters and climate variability (NDC), socio-demographic profile (SDP), socio networks (SN), housing and production means (HPM), finance and Income (FI). Index Sti represents the value of the sub-components, indexed by i, that account for each major component of each term and n is the number of sub-components in each major component. The LVI of each term is calculated in Eq. (3).
LVIt = (wH*MtH+wLS*MtLS+wKK*MtKK+wL*MtL+
wNR*MtNR+wNDC*MtNDC+wSDP*MtSDP+
wSN*MtSN+wHPM*MtHPM+WFI*MtFI)/(wH+wLS+
wKK+wL+wNR+wNDC+wSDP+wSN+wHPM+wFI) (3) Where LVIt is the livelihood vulnerability index for term t. This is the weighted balance of the ten major components. The value of each major component, wMi are determined by the average of major component to ensure that all sub-components equally contribute to the overall LVI. The value of the LVI scores from 0 (least vulnerable) to 0.5 (most vulnerable).
2.2.1. Calculation of the LVI–IPCC: IPCC framework approach
This formulation was totally adapted from the framework by Hahn et al. (2009) (Hahn et al., 2009c) with three dimensions of the same data for calculating the LVI. LVI–IPCC is combined with the contributed factors as shown in Table 2.
The equation function is presented as follows:
CFt = (wMt*Mti)/wMti (4)
Where CFt is the definition of contributed factors in IPCC framework for exposure, adaptive capacity or sensibility at the research site by term t.
Mti is the major components for the study site at term i; wMt is the weight of each major component, and n is the number of major components in each contributed factor.
The value of LVI–IPCC is determined by Eq. (5) with adapted by Hahn et al. (2009) (Hahn et al., 2009c):
LVI–IPCCt = (e–a)*s (5)
Of which, LVI–IPCCt is the value for the research site at term t followed by IPCC framework, e is the value of exposure, a is the value of adaptive capacity and s is the value of sensibility. The range of LVI–IPCC was scaled from −1 (least vulnerable) to +1 (most vulnerable).
2.3. Data Collection 2.3.1. Research site selection
Based on the empirical study in 2009 (Hao, 2009), this study implemented the survey in the coastal sandy zone with 4 districts including Quang Dien, Phong Dien, Phu Vang and Phu Loc district that represent the coastal sandy zone in Thua Thua Hue (Map 1). This area goes alongside the sea with a total length of 105 km. The coastal sandy zone constitutes over 18% of the total provincial area, occupying approximately 50% of the total population of the province. The average population per district varies considerably and ranges from 92,000 inhabitants in Quang Dien to 179,000 inhabitants in Phu Vang. About 90% of the population of the region are living in the rural region (Provincial comittee of Thua Thien Hue, 2018b).
2.3.2. Data collection
For this study, secondary and primary data were used analysis. The secondary data used relevant literature reviews to construct the framework as well as the based indicators. In addition, the data concerned to climate was collected from many sources to serve the study.
To prepare for the household survey, this study used some different approaches. Historical profile, this method aims to consider the main events that happen of each study site from the past toward the present. Especially, the relevant information that happened through the past to present, focusing on the special milestones such as the term of significant infrastructure construction, the changes of livelihood structure and important historical floods and storms. Key informant interview (KII) with 2 KIIs provincial level, 7 KIIs at the district level and 7 KIIs at commune level were organized to capture the general information of livelihood capitals, the context of vulnerability at the research site. In-depth interview, this method aims to collect in-depth related issues for fulfilling information about the particular situation of the household. This generally presented as a profile of household and their story about the research problem. Focus group discussion, this method aims to collect some information relating to the current condition of livelihood, livelihood change, constraints and advantages of current livelihood.
Table 2: Contributed factors of LVI-IPCC IPCC Contributing
factors to vulnerability Major components exposure
Exposure (e) Natural hazards and climate vulnerability Adaptive capacity (a) Socio-demographic
Livelihood strategies Socio networks
Sensibility (s) Health, knowledge and skills Land and natural resource Housing and production means Financial
For the household survey, this study based on the baseline data in 2009 (Hao, 2009) that was carried out in 2007-2008 in four districts representing for the coastal sandy zone in TTH. In the baseline study, a total of sample size included 136 households distributed to the four districts in the province. For sample selection method, due to the limitation of time and budget, the study selected a quota of 136 households. In the research design framework, to identify the study site in the province, various conservations with the key informant interview at multi-level were firstly conducted. Besides, the relevant documents such as maps, the annual report was taken into account carefully. Some key criteria had to be strictly observed that includes the study site should meet the requirements of a representative of the rural context about the diverse agro-ecological and socio-economic conditions; the study site should be consisted multi-level of infrastructural access; it also considers the inclusion of diversification about livelihood activities. For the targeted households, a two-stage design method was applied. After 10 years, because of many reasons, only 110 households are
active, 26 households were removed from the study, in which, 6 households migrated to other provinces, 12 heads of household died, 2 heads of household had a high rate of birth, 2 households did not join the survey and 4 households were not willingness to join the survey. The same questionnaire with a baseline study was used to collect the information of the households.
3. RESULTS AND DISCUSSIONS
Table 3 shows the general information of five types of capital with 28 indicators that are grouped into ten major components. The information of Figure 2 provides the comparisons of each capital in the 10-year period. The overall of LVI reduces from 0.244 to 0.214 (this index ranges from 0 to 1, from less vulnerable to most vulnerable). In detail, the research finding provided a similar trend with the slight reduction of the vulnerable index in the cases of five types of capitals. The given change showed the positive dynamic progress of the households with a vulnerable context. The next section will go through analysis with each capital.
Map 1: Thua Thien Hue province and research areas (Provincial Committee, 2015)
1 • Literature review and secondary data to identify research objectives
2
• Field trip and reconfirm the number of household survey of provided list from baseline study
3
• Historical profile, group discussion, key informant interview, participatory rapid assessment
4 • Using structured questionnaire to collect information of 110 HHs
5
• Using structured questionnaire to collect information of 110 HHs and data inputting
6 • Development of the LVI and LVI-IPCC
7 • Conclusions and recomendations
3.1. Vulnerability in the Dimension of Human Capital
The human vulnerability index comprises health condition, livelihood strategy and knowledge and skill. In overall, this index reduced from 0.365 to 0.313. The fact that with many supported health programs from the government as well as the improvement in living standard, health care conditions have been improved for households. Besides, the growth in infrastructure conditions gathering with more quantity of private vehicles that could reduce the time to travel to the healthcare center. Recently, the local government has been implementing the new rural development program that required to upgrade the connecting roads between the village and village, commune and commune that could be the excellent explanation for the development of the infrastructural system. The standard toilet was upgraded to ensure excellent conditions for healthcare. In the
last 10 years, there were still many cases of the household without having the toilet causing the various problems of health’s issues, life quality and also environmental pollution. Some programs from local government and mass associations supported for the households to have a standard toilet that was the reason for the less vulnerability in this indicator. In general conclusion, it witnessed the less vulnerability of households with health vulnerability index, reduced significantly from 0.126 to 0.120.
In the domain of livelihood diversification index, the results showed that at present, the value of this index was lower than that during the 10 years, 0.585 compared with 0.469. Migration strategy was considered a significant pathway to divert the income of the household. It was the fact that the migration wave to the
Table 3: Results of all type of capitals and components for calculating LVI
Type of Capital Indicator Unit Observed value Index
2007-2008 2017-2018 2007-2008 2017-2018 I. Human capital
Health (1) HH with sanitary latrine/toilet (%) 12.7 2.7 0.127 0.027
(2) HH head often got sick (%) 6.4 13.6 0.064 0.136
(3) Average time to travel to the health care center Min 17.7 14.2 0.188 0.198
Livelihood strategy (4) HH did not have at least one migrant (%) 67.3 41.8 0.673 0.418
(5) HH lived on agriculture as major source of
income (%) 84.5 58.2 0.845 0.582
(6) HH with family member engaging in non-farm
activities (%) 51.8 60.0 0.518 0.600
(7) Average of livelihood diversification index Activity 0.3 0.2 0.302 0.275
Knowledge and skill (8) HH head with illiteracy (%) 1.8 9.1 0.018 0.091
(9) HH head only having primary school education (%) 40.9 46.4 0.409 0.464
(10) HH head not joining the training course (%) 50.0 33.6 0.500 0.336
II. Natural capital
Land (11) Landless HH (%) 4.5 2.7 0.045 0.027
(12) HH with small land scale (0.1-0.5 ha) (%) 6.4 26.4 0.064 0.264
Natural resources (13) HH lived on exploiting natural resources (%) 3.6 5.5 0.036 0.055
Natural disasters and
climate variability (14) Ave. no. of death or injuries caused by severe floods in the past 10 years No 0.0 0.0 0.000 0.000
(15) HH did not receive at least a flood warning (%) 9.1 3.6 0.091 0.036
(16) Average number of floods/storms No 8.4 7.5 0.605 0.558
(17) SD of Average of rainfall per month mm 318.3 321.9 0.509 0.514
(18) SD of Average of temperature 0c 4.1 3.8 0.204 0.344
III. Social capital
Socio-demographic (19) Female HH head (%) 3.6 4.5 0.036 0.045
(20) Dependency ratio (%) 0.4 0.3 0.079 0.073
(21) Poor HH (%) 14.5 16.4 0.145 0.164
Socio networks (22) HH receiving help when needs (%) 10.0 6.4 0.100 0.064
(23) HH without having at least a membership of
any organizations (%) 4.5 2.7 0.045 0.027
IV. Physical capital Housing and production
means (24) HH with the temporary house (%) 18.2 4.5 0.182 0.045
(25) HH with affected house by flood,
storm (partially/totally submerged) (%) 10.0 4.5 0.100 0.045
(26) HH reporting no access to production means (%) 13.6 5.5 0.136 0.055
V. Financial capital
Finance and Income (27) Lend Money (%) 62.7 45.5 0.627 0.455
(28) HH did not have cash when needed (%) 18.2 9.1 0.182 0.091
LVI 0.244 0.214
presented a new trend that the position of the household head could be changed from male to female in a family. In the category of the education level for the head of household, there was no significant change in the level of education for the head of household with the majority of the household head attending primary school and having illiteracy. This could cause various barriers in accessing information and applying know-hows for the households. However, with many supported programs in training for the rural areas, the households have more chances to participate in the training courses to raise their capacity to improve their livelihoods and reduce the vulnerable situation. Besides, the findings also identified that there was a significant increase in the domain of the percentage of households attending the training courses.
3.2. Vulnerability in Term of Natural Capital
After 10 years, the natural capital index witnessed a slight increase from 0.194 to 0.225 that was contributed by land, natural resource and natural disaster, and climate variability components. A greater reduction of the landless index that reduced from 0.045 in 2007-2008 to 0.027 in 2017-2018; households with small-scale land increased from 0.064 in 2007-2008 to 0.264 in 2017-2018. It was likely the story of migration wave, a major of the family member participated on the non-farming activities in the outside province, some of the households were in the high rate of birth due to the transforming of land use to others who need land for cultivation. Furthermore, some negative issues from raising aquaculture due to the transfer of the land to other people from different villages that also contributed to the reduction of land in the research sites. In addition, the trend of using natural medicine for treatment brought more changes for a household in collecting natural resource to generate more incomes. This was also the stable income source in the case of households having related business activities of this sector. In other aspects, this source of income could cause the degradation of natural resources.
In the dimension of natural disasters and climate variability vulnerability index, four indicators were used to measure this index. After 10 years, the index increased from 0.282 to 0.291. This reflected the unforeseen issues from natural hazards. The fact that some of the extreme climates such as floods, storms happened with unforecastable trends caused more vulnerable contexts. In particular, using information about the mean standard deviation of monthly rainfall and temperature per month witnessed the given arguments. The index of monthly precipitation and temperature increased significantly, from 0.509 to 0.514 and 0.204 to 0.344 respectively. It is a need to consider the related solutions in both the short and long run to adopt extreme climate events. With many abilities from the local government and the development of living conditions, receiving the warning cautions of natural hazards as well as extreme climate events on TV or internet were more popular due to the less vulnerable context for the households.
3.3. Vulnerability in Term of Social Capital
This index comprised two major components with five indicators. There was a little change of this index from 0.081 in 2007-2008 to 0.075 in 2017-2018. The contribution encompassed by socio-demographic with the increase from 0.087 to 0.094 and socio networks with a decrease from 0.073 to 0.045, respectively. The developed cities was considered a significant strategy for the
household (Adger et al., 2002; Long and Phuong, 2013; Coffey et al., 2015; “Impact of Special Economic Zones on Employment, Poverty and Human Development Working Paper no. 194 Impact of Special Economic Zones on Employment, Poverty and Human Development Aradhna Aggarwal,” 2016). The remittance from the migrants might help the household upgrading their living conditions, reinvesting in running business activities. Information from interviewed households and KII revealed an exciting result that in some cases household returned their hometown to open the company for businesses that made a significant contribution to local job generation. Beside various benefit dimension, the migration strategy created some drawbacks such as shortage of labor in the agricultural sector, this shared the ideal of Mendola in 2006 (Mendola, 2006). In other aspects, the integration with cross-cultural exchange from migrants might cause a change in the traditional culture of the rural areas. The finding demonstrated that the value of the index HH does not have at least one migrant reduced significantly from 0.673 to 0.418.
The households diversified more activities than before to improve their income source, and they focused on the none-farming activities to be less depended on the agricultural sector. In the past, during the flood season, the households encountered difficulties in finding work to generate more income, with the transition of livelihood strategies into non-farming activities or migration to another province, this is the effective way to reduce the dependence on agricultural activities. It was the fact that the study shown a slight decrease of vulnerability after 10 years for the two indicators including HH’s dependence on agriculture as major source of income (0.845-0.582) and livelihood diversification index (0.302-0.275). Otherwise, there was still a higher vulnerability score in the dimension of HH with family member engaging in non-farming activities (0.518-0.600).
In the term of knowledge and skill, it showed a slight reduction of the vulnerable index after 10 years, 0.309 compared with 0.297. In some cases, male labors joined other activities outside their province after crop season had ended to diversify their income sources, thus reducing the vulnerability of the household. The given results also
0.100 0.200 0.300 0.400 0.500Human capital Natural capital Social capital Physical capital Financial capital 2007-2008 2017-2018
Source: Baseline data in 2009 and surveyed household in 2017-2018
findings in this capital index indicated that the households were less vulnerable in the dimension of social capital. After 10 years, the dependency ratio reduced from 0.354 to 0.290, this decline was caused by the separation of the family member. Frankly, in 2007-2008, the family size in average was around over 6, in some cases, it could be over 10. The given issues trapped the households into a more vulnerable situation because of the high dependency ratio combined with low land fertility as well as low-skilled labors. The given issues affected the livelihood pathway for the households. At present, with the success of the national policy from the multi-level government with the target that each household should have from 1 to 2 children and the awareness of households, the family size fluctuated around 4-5, denoting a dramatic decrease compared to that of the last term. As a result, this index reduced from 0.079 to 0.073 in 2007-2008 and 2017-2018, respectively. Poverty reduction has been playing an important role. It was the fact that although the study indicated the significant decrease of poor households but in many cases, compared with the current poverty standard, the majority of the households was still under the poverty line. This result was explained by the KII’s result and deeply analyzed case by case of the data. The given results reflected the inequality of income distribution. In the domain of social networks, a majority of the household percentage participated in mass organizations compared with the last term. By joining given organizations, the households had more opportunities in accessing information, credit as well as training courses. As a good result, households could reduce vulnerability.
3.4. Vulnerability in Term of Physical Capital
Using a group including three indicators to identify physical index, the indicators in the percentage of the temporary houses and partially submerged houses measure the level of vulnerability of house while the percentage of households with no access to the production means present the ability of household to cope with natural disasters. The households improved their condition to adapt to natural disasters, with the positive changes in living conditions, more investment in a house to satisfy the better life as well as capacity building in reducing the natural risks and different actors of the vulnerable context. With the improvements in various sectors, the households had more chances to get access to production mean at present. In overall, the value of this dimension scoring in 2007-2008 was higher than that in 2017-2018, 0.139 compared with 0.048, proving that households had a good condition in physical capital to adapt to the diversification of the vulnerable contexts.
3.5. Vulnerability in Term of Financial Capital
This dimension applied two indicators including the percentage of households borrowing money, the percentage of households has cash when they need to solve problems. The results presented that the value of the index of the households having loan reduced from 0.636 to 0.455, compared 2007-2008 with 2017-2018. In fact, there were various credit institutions offering preferential interest rates in favor of agricultural activities, but the households reported that they did not want to be in debt. Particularly, the households having members attending university further explained why they were getting a loan. With the diversification of livelihood strategies, the households had more chance to generate income and save money.
This could help the households not only for daily expenditure but also for their capacity to adapt to risks. Finally, the given indicators contributing to the overall of this capital index was 0.405 and 0.273, compared 2007-2008 with 2017-2018.
3.6. Comparative Vulnerable Index of Five Types Capitals
Excluding natural capital, the comparison of five type capitals identified the less vulnerability of the households in 10 years (Table 4). The most critical dynamic change contributed is financial and human capitals from 0.405-0.273 to 0.365-0.313 in 10 years respectively, to which, such reduction of the households on loan was significantly contributed. In the domain of human capital, there is fluctuation caused by various dimensions with the positive pathway. This is appraised as a significant achievement for the province. In the aspect of natural capital, it can be seen that the increase of vulnerability after 10 years, scores 0.194 in 2007-2008 and 0.225 in 2017-2018 respectively. The negative issues produced by natural disasters and climate variability imply that incoming policies needed to focus on discussing as well as proposing sustainable solutions. The findings also provided a positive in the view of social capital and physical capital.
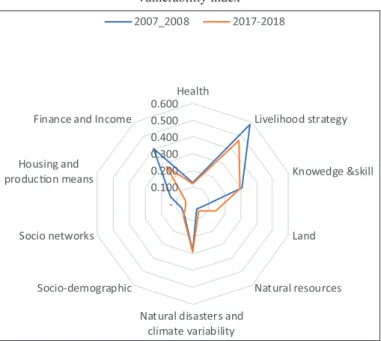
3.7. Major Components for LVI in 10-year Period
Considering deeply the ten major components, it sees a dynamic fluctuation (Table 5 and Figure 3). Some of the subcomponents were less vulnerable including health, livelihood strategies, knowledge and skills, socio-demographic, socio networks, housing and production means and finance and income. The rest still marks higher level of vulnerability. This can be the suggestions for government in issuing the policy implications that should pay attention to focus on capitals are even higher vulnerable index. Scoring on a scale of −1-1, the results of the LVI–IPCC presented another approach for evaluating the vulnerability. It also identified a triangle vulnerability including three groups of
Table 4: Vulnerability index of 5 type capitals
Type of capital 2007-2008 2017-2018 Human capital 0.365 0.313 Natural capital 0.194 0.225 Social capital 0.081 0.075 Physical capital 0.139 0.048 Financial capital 0.405 0.273 LVI 0.244 0.214
Source: baseline data in 2009 and surveyed household in 2017-2018
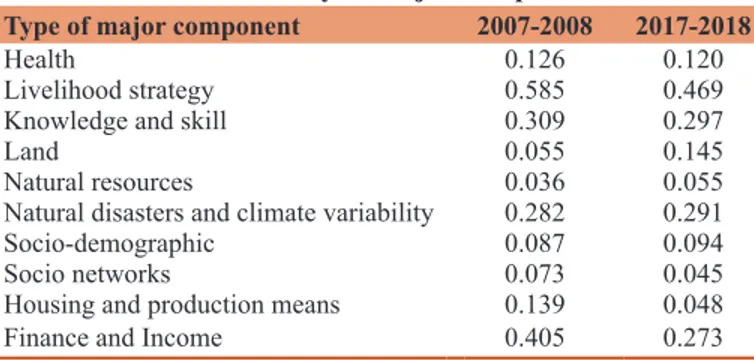
Table 5: The vulnerability of major components for LVI
Type of major component 2007-2008 2017-2018
Health 0.126 0.120
Livelihood strategy 0.585 0.469
Knowledge and skill 0.309 0.297
Land 0.055 0.145
Natural resources 0.036 0.055
Natural disasters and climate variability 0.282 0.291
Socio-demographic 0.087 0.094
Socio networks 0.073 0.045
Housing and production means 0.139 0.048
Finance and Income 0.405 0.273
dimensions including exposure, adaptive capacity and sensitivity with the function of the LVI–IPCC = [Exposure–Adaptive capacity]*Sensitivity. Reaching the same major indicators of
the LVI, after 10 years, a slight reduction of three dimensions comprised for the overall LVI–IPCC that valued with −0.005 in 2007-2008 compared with 0.007 in 2017-2018, implying that in 2017-2018 may be more vulnerable than 2007-2008 because the most contribution of exposure component (Figure 4). In detail, a vulnerability triangle diagram 4 and Table 6 shows the value for exposure, adaptive capacity and sensitivity. The results illustrate that in 2017-2018 may be more exposed to natural disasters and climate variability than in 2007-2008, compared to 0.291 and 0.282. Besides, in 2017-2018, it may be less sensitive to natural disasters and climate variability than that in 2007-2008, compared to 0.172 and 0.199. Finally, the socio-demographic, livelihood strategy and social networks show that, in 2017-2018, it may be less adaptive capacity in 2007-2008, compared to 0.250 and 0.305.
4. CONCLUSIONS AND
RECOMMENDATIONS
The study was conducted in the coastal sandy zone in TTH province to compare the livelihood vulnerability in 2007-2008 to that in 2017-2018. By using 28 indicators distributed to five capital of SLF, the primary results indicated that the households in TTH have been achieving various achievements in the developmental pathways. The overall vulnerable index is upgraded showing the higher capacity of households to cope with vulnerable context. It was the fact that, after 10 years, the development of TTH province was reflected by the improvements in the living conditions of households regarding income, health condition, housing facility, ability to get access to the training courses, gathering contributed positive effects for the households to obtain the sustainable livelihood strategies. In other aspects, it is still exited some of the threats relating unpredictable trends of extreme climate event, the shortage of labor force in term of the agricultural sector for the next coming years. The findings also reported that households had less dependence on the agricultural sector while the main vulnerability of the households was subject to farming activities. This issue could be considered a significant success in the development process of this region. In addition, the migration strategy has been playing the core value that contributing to other dimensions of households’ livelihood like the chain of positive external effects. Based on the findings of the study, we strongly propose some recommendations to solve the present difficulties in this province.
Table 6: Contributed factors of LIV – IPCC
Type of contributed factor 2007-2008 2017-2018 2007-2008 2017-2018
Natural disasters and climate variability 0.282 0.291 Exposure 0.282 0.291
Livelihood strategy 0.585 0.469 Adaptive capacity 0.305 0.250
Socio-demographic 0.192 0.213
Socio networks 0.073 0.045
Health 0.126 0.120 Sensibility 0.199 0.172
Knowledge and skill 0.309 0.297
Land 0.055 0.145
Natural resources 0.036 0.055
Housing and production means 0.139 0.048
Finance and Income 0.405 0.273
LVI-IPCC −0.005 0.007
Source: Baseline data in 2009 and surveyed household in 2017-2018
0.100 0.200 0.300 0.400 0.500 0.600Health Livelihood strategy Knowedge &skill Land Natural resources Natural disasters and
climate variability Socio-demographic
Socio networks Housing and produc on means
Finance and Income
2007_2008 2017-2018
Source: Baseline data in 2009 and surveyed household in 2017-2018
Figure 3: Vulnerability diagram of major components for livelihood vulnerability index 0.050 0.100 0.150 0.200 0.250 0.300 0.350Expose Adap ve capacity Sensibility 2007-2008 2017-2018
Source: Baseline data in 2009 and surveyed household in 2017-2018
Figure 4: Vulnerable triangle of livelihood vulnerability index–IPCC factors
Firstly, it is vital to pay attention to the long-term solution for capacity building to adapt to climate variability. This solution is based on a higher score in the dimension of the natural disaster. It is the fact that providing the related training courses to mitigate the impact of the climate’s issues and raise awareness of the households might support the households to understand the current issue of climate conditions and be more active in adaption to and mitigation of the same in the long run.
Secondly, it is crucial to provide the training courses to improve the quality of labor source and pay more attention to the labor shortage in the agricultural sector. It is the fact that when the citizens have a higher educational level and working skill, they will get more chance to migrate to developed cities with better conditions of the workplace and competitive salary due to the lack of labor in rural areas. This recommendation is based on the result of FGD and case-by-case analysis.
Thirdly, it is very interesting in case of the credit providers, local governments and enterprises consider providing both credit and guidance for the households on efficient spending. This recommendation is based on the result of households did not willing to borrow credit because they do not know how to use it. Fourthly, it is essential to have a strong linkage between local governments, NGOs, universities, and enterprises to provide specific training programs for households. Moreover, it should pay attention to not only quantitative but also qualitative training courses. This recommendation is based on the finding that it was still high in the percentage of households without obtaining a training course.
Last but not least, local governments need to consider to merge the small-scale fields to the larger one. It will be more favorable for households to do farming activities. This recommendation is based on the finding that it is still high the percentage of household owning a tiny scale of land use.
In the dimension of the contribution of the study, a deeper understanding of the vulnerable context of household communities will support policy intervention, social project as well as impact assessment on given factors such as change of vulnerable contexts, structure, and process. Besides, on the contribution to carrying out valuable information, in other dimensions, this study still remains various limitations. Mainly, it is too complicated to have a thorough assessment of livelihood vulnerability and it is a must to consider many aspects of social, economic as well as the issue of process, structure, and policy. Based on 10 years of baseline data for re-conducting the study, some of the indicators witnessed a huge fluctuation and bias. Some of these indicators cannot be fully relied on to improve the quality of conclusions and recommendations. By so far, it may be applying this approach and updating some recent indicators to have a full evaluation and, also reduce the duration between two or three surveys for more efficiency. Implementing a dual study to consider the impact of extreme climates and perception of the communities adapting to given issues can be necessary.
REFERENCES
Adger, W.N., Kelly, P.M., Winkels, A., Huy, L.Q., Locke, C. (2002), Migration, remittances, livelihood trajectories, and social resilience. AMBIO: A Journal of the Human Environment, 31(4), 358-366. Adger, W.N. (2006), Vulnerability. Global Environmental Change, 16(3),
268-281.
Adu, D.T., Kuwornu, J.K.M., Anim-Somuah, H., Sasaki, N. (2018), Application of livelihood vulnerability index in assessing smallholder maize farming households’ vulnerability to climate change in Brong-Ahafo region of Ghana. Kasetsart Journal of Social Sciences, 39(1), 22-32.
Ahsan, M.N., Warner, J. (2014), The socioeconomic vulnerability index: A pragmatic approach for assessing climate change led risks a case study in the South-Western Coastal Bangladesh. International Journal of Disaster Risk Reduction, 8, 32-49.
Avogo, F.A., Wedam, E.A., Mensah, O.S. (2017), Housing transformation and livelihood outcomes in Accra, Ghana. Cities, 68, 92-103. Baffoe, G. (2018), Exploring the utility of analytic hierarchy process
(AHP) in ranking livelihood activities for effective and sustainable rural development interventions in developing countries. Evaluation and Program Planning, 72, 197-204.
Baffoe, G., Matsuda, H. (2018), An empirical assessment of households livelihood vulnerability: The case of rural Ghana. Social Indicators Research, 140, 1225-1257.
Bebbington, A. (1999), Capitals and capabilities: A framework for analyzing peasant viability, rural livelihoods and poverty. World Development, 27(12), 2021-2044.
Beringer, A., Kaewsuk, J. (2018), Emerging livelihood vulnerabilities in an urbanizing and climate uncertain environment for the case of a secondary city in Thailand. Sustainability, 10(5), 1452-1456. Bhattacharjee, K., Behera, B. (2018), Determinants of household
vulnerability and adaptation to floods: Empirical evidence from the Indian State of West Bengal. International Journal of Disaster Risk Reduction, 31, 758-769.
Carr, E.R. (2014), From description to explanation: Using the livelihoods as intimate government (LIG) approach. Applied Geography, 52, 110-122.
Carswell, G. (1997), Agricultural Intensification and Rural Sustainable Livelihoods: A “Think Piece”. IDS. Available from: https://www. opendocs.ids.ac.uk/opendocs/handle/123456789/3368. [Last accessed on 2018 Dec 06].
Clark, G.E., Moser, S.C., Ratick, S.J., Dow, K., Meyer, W.B., Emani, S., Jin, W., Kasperson, J.X., Kasperson, R.E., Schwarz, H.E. (1998), Assessing the vulnerability of coastal communities to extreme storms: The case of revere, MA., USA. Mitigation and Adaptation Strategies for Global Change, 3(1), 59-82.
Coffey, D., Papp, J., Spears, D. (2015), Short-term labor migration from rural North India: Evidence from new survey data. Population Research and Policy Review, 34(3), 361-380.
Cooke, M., Mitrou, F., Lawrence, D., Guimond, E., Beavon, D. (2007), Indigenous well-being in four countries: An application of the UNDP’S human development index to indigenous peoples in Australia, Canada, New Zealand, and the United States. BMC International Health and Human Rights, 7(1), 9-15.
DFID. (2008a), DFID’s Sustainable Livelihoods Approach and its Framework. London: Department for International Development. p1-5.
DFID. (2008b), DFID’s Sustainable Livelihoods Approach and its Framework. London: Department for International Development. Dhanani, S., Islam, I. (2002), Poverty, vulnerability and social protection
in a period of crisis: The case of Indonesia. World Development, 30(7), 1211-1231.
Duy, C.N., Hong, T.V., Thai, H.C. (2014), Application of Livelihood Vulnerability Index to Assess Risks from Flood Vulnerability and Climate Variability a Case Study in the Mekong Delta of Vietnam. Available from: http://www.sumernet.org/sites/default/files/00_ appication of LVI to assess risks from flood.pdf. [Last accessed on 2018 Oct 23].
Ellis, F. (1998), Household strategies and rural livelihood diversification. Journal of Development Studies, 35(1), 1-38.
Engle, N.L. (2011), Adaptive capacity and its assessment. Global Environmental Change, 21(2), 647-656.
Eriksen, S.H., Brown, K., Kelly, P.M. (2005), The dynamics of vulnerability: Locating coping strategies in Kenya and Tanzania. The Geographical Journal, 171(4), 287-305.
Few, R., Tran, P.G. (2010), Climatic hazards, health risk and response in Vietnam: Case studies on social dimensions of vulnerability. Global Environmental Change, 20(3), 529-538.
Giang, L.T., Pfau, W.D. (2009), Vulnerability of Vietnamese elderly to poverty: Determinants and policy implications. Asian Economic Journal, 23(4), 419-437.
Graham, S., Barnett, J., Mortreux, C., Hurlimann, A., Fincher, R. (2018), Local values and fairness in climate change adaptation: Insights from marginal rural Australian communities. World Development, 108, 332-343.
Hahn, M.B., Riederer, A.M., Foster, S.O. (2009a), The livelihood vulnerability index: A pragmatic approach to assessing risks from climate variability and change a case study in Mozambique. Global Environmental Change, 19(1), 74-88.
Hahn, M.B., Riederer, A.M., Foster, S.O. (2009b), The livelihood vulnerability index: A pragmatic approach to assessing risks from climate variability and change a case study in Mozambique. Global Environmental Change, 19(1), 74-88.
Hahn, M.B., Riederer, A.M., Foster, S.O. (2009c), The livelihood vulnerability index: A pragmatic approach to assessing risks from climate variability and change a case study in Mozambique. Global Environmental Change, 19(1), 74-88.
Hahn, M.B., Riederer, A.M., Foster, S.O. (2009d), The livelihood vulnerability index: A pragmatic approach to assessing risks from climate variability and change a case study in Mozambique. Global Environmental Change, 19(1), 74-88.
Hao, D.N. (2009), Evolution of Livelihood Strategy of the Households in the Coastal Sandy Zone of the North Central Region of Vietnam Case Study in Thua Thien Hue Province During Period 2003-2008, Conference. Hassan, R., Nhemachena, C. (2008), Determinants of African farmers’
strategies for adapting to climate change: Multinomial choice analysis. African Journal of Agricultural and Resource Economics, 2(1), 83-104.
Heltberg, R., Bonch-Osmolovskiy, M. (2011) Mapping Vulnerability to Climate Change. The World Bank (Policy Research Working Papers). Doi 10.1596/1813-9450-5554.
Hinkel, J. (2011), Indicators of vulnerability and adaptive capacity: Towards a clarification of the science policy interface. Global Environmental Change, 21(1), 198-208.
Huang, X., Huang, X., He, Y., Yang, X. (2017), Assessment of livelihood vulnerability of land-lost farmers in urban fringes: A case study of Xi’an, China. Habitat International, 59, 1-9.
Hussein, K., Nelson, J., Brighton, E., Institute of Development Studies. (1998), Sustainable Livelihoods and Livelihood Diversification. Institute of Development Studies, University of Sussex. Available from: https://www.vtechworks.lib.vt.edu/handle/10919/66529. [Last accessed on 2018 Dec 06].
Huynh, L.T.M., Stringer, L.C. (2018a), Multi-scale assessment of social vulnerability to climate change: An empirical study in coastal Vietnam. Climate Risk Management, 20, 165-180.
Huynh, L.T.M., Stringer, L.C. (2018b), Multi-scale assessment of social vulnerability to climate change: An empirical study in coastal Vietnam. Climate Risk Management, 20, 165-180.
Impact of Special Economic Zones on Employment. (2016), Impact of Special Economic Zones on Employment Poverty and Human Development Working Paper No. 194. Impact of Special Economic Zones on Employment, Poverty and Human Development Aradhna Aggarwal, 2016.
IPCC. (2014a), Climate Change, Adaptation, and Vulnerability, Organization and Environment. Available fom: http://www.ipcc-wg2. gov/AR5/images/uploads/IPCC_WG2AR5_SPM_Approved.pdf. IPCC. (2014b), Climate Change 2014: Synthesis Report. Contribution
of Working Groups I, II and III to the 5th Assessment Report of the Intergovernmental Panel on Climate Change. In: Core Writing Team, Pachauri RK, Meyer LA., editors. Geneva, Switzerland: IPCC. p151, 1-112.
Long, N.D., Phuong, N.T.M. (2013), The Migration Status of Labor from Rural to Urban. Available from: http://www.cantholib.org.vn/ Database/Content/931.pdf.
Malik, K., Maurice, K., Milorad, K., Subhra, B., Astra, B., Cecilia, C., Alan, F., Amie, G., Iana, K., Arthur, M., Shivani, N., José, P., Swarnim, W. (2013), Human Development Report 2013 Summary. Martin, S.M., Lorenzen, K. (2016), Livelihood diversification in rural
Laos. World Development, 83, 231-243.
Mendola, M. (2006), Migration and technological change in rural households: Complements or substitutes? Journal of Development Economics, 85(1-2), 150-175.
Ministry of Resource and Enviroment. (2010), Xây Dựng Khả Năng Phục Hồi Các Chiến Lược Thích Ứng Cho Sinh Kế Ven Biển Chịu Nhiều Rủi Ro Nhất Do Tác Động Của Biến Đổi Khí Hậu Ở Miền Trung Việt Nam. K.nxb: Bộ Tài Nguyên và Môi Trường.
Navrud, S., Tuan, T.H., Tinh, B.C. (2012), Global health action estimating the welfare loss to households from natural disasters in developing countries: A contingent valuation study of flooding in Vietnam. Globle Health Action, 5, 17609.
Neil, A.W. (1999), Social vulnerability to climate change and extremes in coastal Vietnam. World Development, 27(2), 249-269.
Ngo, T.T.H., Azadi, H., Tran, H.C., Lebailly, P. (2018), Assessment of household risk management strategies for coastal aquaculture: The case of clam farming in Thaibinh Province, Vietnam. Aquaculture International, 26(2), 451-468.
Nguyen, T., Nguyen, T.D., Leal, T.M.C., Burny, P., Lebailly, P. (2018), Leaving the village but not the rice field: Role of female migrants in agricultural production and household autonomy in red river delta, Vietnam. Social Sciences, 7(10), 202-210.
Nguyen, T.T., Saito, H., Isoda, H., Ito, S. (2015), Balancing skilled with unskilled migration in an urbanizing agricultural economy. World Development, 66, 457-467.
Nhuận, M.T. (2015), Assessing the adaptive capacity of coastal urban households to climate change (Case study in Liên Chiểu district, Đà Nẵng city, Vietnam). VNU Journal of Science: Earth and Environmental Sciences, 31(2), 23-35.
Olajide, O., Lawanson, T. (2014), Climate change and livelihood vulnerabilities of low-income coastal communities in Lagos, Nigeria. International Journal of Urban Sustainable Development, 6(1), 42-51. Oo, A.T., Huylenbroeck, G., Speelman, S. (2018), Assessment of climate
change vulnerability of farm households in Pyapon district, a delta region in Myanmar. International Journal of Disaster Risk Reduction, 28, 10-21.
Pandey, R., Jha, S.K., Alatalo, J.M., Archie, K.M., Gupta, A.K. (2017), SLF-based indicators for assessing climate change vulnerability and adaptation for Himalayan communities. Ecological Indicators, 79, 338-346.
Provincial Committee. (2015), Bản đồ Hành Chính Tỉnh Thừa Thiên Huế’, Thuathienhue. Cổng Thông Tin Điện tử Tỉnh Thừa Thiên Huế. Available from: https://www.thuathienhue.gov.vn/vi-vn/Trang-chu/ Thong-tin-chung/Ban-do-hanh-chinh/tid/Ban-do-hanh-chinh/cid/ BE5B7CEC-ADFA-4BE1-8364-8227E40CE16D. [Last accessed on 2018 Dec 07].
Provincial Comittee of Thua Thien Hue. (2018b), Tổng quan Kinh tế - Xã hội tỉnh Thừa Thiên Huế. Available from: https://www.thuathienhue. gov.vn/vi-vn/Kinh-te-xa-hoi/tid/Kinh-te-Xa-hoi/cid/34C9A34F-50C6-4D3E-87BE-D6BEE183FE08. [Last accessed on 2018 Dec 07]. Chambers, R. (1989), Vulnerability, coping and policy. IDS Bull, 37(2),
33-48.
Ramamasy, S., Baas, S. (2007), Climate Variability and Change: Adaptation to Drought in Bangladesh : A Resource Book and Training Guide. Available from: http://www.ftp.fao.org/docrep/ fao/010/a1247e/a1247e00.pdf%5Cnhttp://books.google.com/ books?id=kYzWr1EqJu4C.
Reed, M.S., Podesta, G., Fazey, I., Geeson, N., Hessel, R., Hubacek, K., Letson, D., Nainggolan, D., Preli, C., Rickenbach, M.G., Ritsema, C., Schwilch, G., Stringer, L.C., Thomas, A.D. (2013), Combining analytical frameworks to assess livelihood vulnerability to climate change and analyse adaptation options. Ecological Economics, 94, 66-77.
Scoones, I. (1998), Sustainable Rural Livelihoods a Framework for Analysis. Working Paper, No. 72. p1-22.
Shah, K.U., Dulal, H.B., Johnson, C., Baptiste, A. (2013a), Understanding livelihood vulnerability to climate change: Applying the livelihood vulnerability index in Trinidad and Tobago. Geoforum, 47, 125-137. Shah, K.U., Dulal, H.B., Johnson, C., Baptiste, A. (2013b), Understanding
livelihood vulnerability to climate change: Applying the livelihood vulnerability index in Trinidad and Tobago. Geoforum, 47, 125-137. Siagian, T.H., Purhadi, P., Suhartono, S., Ritonga, H. (2014), Social
vulnerability to natural hazards in Indonesia: Driving factors and policy implications. Natural Hazards, 70(2), 1603-1617.
Smit, B., Wandel, J. (2006), Adaptation, adaptive capacity and vulnerability. Global Environmental Change, 16(3), 282-292. Sujakhu, N.M., Ranjitkar, S., Niraula, R., Salim, M.A. (2018),
Determinants of livelihood vulnerability in farming communities in two sites in the Asian Highlands. Water International, 43(2), 165-182. Sullivan, C. (2002a), Calculating a water poverty index. World
Development, 30(7), 1195-1210.
Sullivan, C. (2002b), Calculating a water poverty index. World Development, 30(7), 1195-1210.
Thi, N., (2018), Assessing household livelihood vulnerability to climate change: The case of Northwest Vietnam Assessing household livelihood vulnerability to climate change: The case of Northwest Vietnam. Human and Ecological Risk Assessment: An International Journal, 25, 1157-1175.
Thornton, P.K. (2014), Climate variability and vulnerability to climate change: A review. Global Change Biology, 20, 3313-3328. Thu, T., Ngo, H. (no date), Household Risk Management Strategies in
Coastal Aquaculture in Vietnam: The Case of Clam Farming in Thaibinh Province. Available from: https://www.orbi.uliege.be/ bitstream/2268/228084/1/NGOThiThuHang_THESIS.pdf. [Last accessed on 2018 Oct 26].
Tian, Q., Brown, D.G., Bao, S., Qi, S. (2015), Assessing and mapping human well-being for sustainable development amid flood hazards: Poyang Lake Region of China. Applied Geography, 63, 66-76. Tuihedur, R.H., Mia, E., Ford, JD., Robinson, B.E., Hickey, G.M.
(2018), Livelihood exposure to climatic stresses in the north-eastern floodplains of Bangladesh. Land Use Policy, 79, 199-214.
Viet, C.N. (2015), Development and Application of a Social Vulnerability Index at the Local Scale. Available from: https://www.researchbank. rmit.edu.au/eserv/rmit:161571/Nguyen.pdf. [Last accessed on 2018 Oct 22].
Vincent, K. (no date), Creating an Index of Social Vulnerability to Climate Change in Africa Education and Sustainability View project Climate Risk Capacity Building in the SADC Region View Project. Available from: https://www.researchgate.net/publication/228809913. [Last accessed on 2018 Oct 23].
VUSTA. (2011), Reesearch Report on Rural Labour and Employment in Vietnam.
Wall, E., Marzall, K. (2006), Adaptive capacity for climate change in canadian rural communities. Local Environment, 11(4), 373-397. Wijayanti, W.P., Pratomo, R.A. (2016), Adaptation of social-economic
livelihoods in coastal community: The case of mangunharjo sub-district, semarang city. Procedia Social and Behavioral Sciences, 227, 477-484.
Wiréhn, L., Danielsson, Å., Neset, T.S.S. (2015), Assessment of composite index methods for agricultural vulnerability to climate change. Journal of Environmental Management, 156, 70-80.
Zhang, Q., Zhao, X., Tang, H. (2018), Vulnerability of communities to climate change: Application of the livelihood vulnerability index to an environmentally sensitive region of China. Climate and Development, 11, 525-542.