Effect of carbohydrate composition in barley and oat cultivars on
1microbial ecophysiology and the proliferation of Salmonella enterica in
2an in vitro model of the porcine gastrointestinal tract
∗ 34
Running Title: Cereal carbohydrates and intestinal microbial ecology
5 6
Robert Pieper1,2,6,7, Jérôme Bindelle1,2,4,5,7, Brian Rossnagel3, Andrew Van Kessel1, 7
Pascal Leterme2,# 8
9
1Department of Poultry and Animal Science, University of Saskatchewan, 51 Campus
10
Dr., Saskatoon, Saskatchewan S7N 5A8, Canada 11
2Prairie Swine Centre inc., 2105 – 8th Street East, Saskatoon, SK, S7H 5N9, Canada
12
3Department of Plant Science, University of Saskatchewan, 51 Campus Dr., Saskatoon,
13
Saskatchewan S7N 5A8, Canada 14
4Animal Science Unit, Gembloux Agricultural University, Passage des Déportés 2, 5030,
15
Gembloux , Belgium 16
5Fonds de la Recherche scientifique-FNRS, Rue d’Egmont 5, 1000, Brussels, Belgium
17
6Current address:Institute of Animal Nutrition,Department of Veterinary Medicine, Free
18
University of Berlin, Brümmerstrasse 34, D-14195 Berlin, Germany 19
7 Both authors contributed equally to this work
20 21
* Presented in part at the 11th Digestive Physiology in Pigs Symposium, Reus, Spain, 22
May 19 to 22, 2009 (‘Changes in intestinal microbial ecophysiology as related to the 23
carbohydrate composition of barleys and oats cultivars in an in vitro model of the pig 24 gastrointestinal tract’). 25 26 # Corresponding author: 27 Dr. Pascal Leterme 28
Prairie Swine Centre Inc. 29
2105 – 8th Street East, Saskatoon, SK, S7H 5N9, Canada 30 phone: +1 306 667 7445 31 fax: +1 306 955 2510 32 e-mail: pascal.leterme@usask.ca 33 34 35
Abstract 36
The influence of carbohydrate (CHO) composition of cereal cultivars on microbial 37
ecophysiology was studied using an in vitro model of the porcine gastrointestinal tract. 38
Ten hulless (HLB), 6 hulled barleys (HB), 6 oats (O) and 6 oat groats (OG) differing in 39
β-glucan, non-starch polysaccharides (NSP), starch contents and starch type, were 40
hydrolyzed enzymatically and incubated for 72h with pig feces. Fermentation kinetics 41
were modeled, and microbial composition and short-chain fatty acid (SCFA) profiles 42
analyzed using terminal restriction fragment length polymorphism (TRFLP) and gas 43
chromatography. Cluster analysis and canonical ordination revealed differently affected 44
fermentation and microbial ecology according to type and cultivar. Firstly, in HB and O, 45
cellulose and insoluble NSP content increased (1) Ruminococcus flavefaciens-like and 46
Clostridium xylanolyticum-like phylotypes, (2) acetate production and (3) decreased 47
fermentation activity. Secondly, in HLB β-glucan, amylose, amylopectin, crude protein 48
and soluble NSP contents determined microbial community composition and activity: (1) 49
amylose contents of the HLB varieties increased butyrate production and abundance of 50
Cl. butyricum-like phylotypes, (2) β-glucan content determined the total SCFA amounts 51
and (3) amylopectin and starch content affected abundance of Cl. ramosum-like 52
phylotypes, members of Clostridium cluster XIVa and Bacteroides-like bacteria. Finally, 53
the effect of CHO on proliferation of Salmonella enterica in the model was determined. 54
Salmonella cell counts were not affected but the relative proportion of Salmonella 55
decreased with HLB and increased with O as revealed by quantitative PCR. Our results 56
shed light into the complex interactions of cereal CHO on intestinal bacterial 57
ecophysiology and the possible impact on host health. 58
Abbreviations used in the manuscript 60
BCFA - branched chain fatty acids, CHO - carbohydrates, CP - crude protein, DM - dry
61
matter, dDM - digestible dry matter, GIT - gastrointestinal tract, lag t - lag time, Nal - 62
Nalidixic acid, Nov - Novobiocin, (i/s/t)NSP - (insoluble/soluble/total) non-starch 63
polysaccharides, (q)PCR - (quantitative) polymerase chain reaction, RDA - redundancy 64
analysis, SCFA - short chain fatty acids, TRFLP - terminal restriction fragment length 65
polymorphism, TRF - terminal restriction fragment, TSB - Tryptone Soya Broth, T1/2 - 66
half-time to asymptotic gas production, UPGMA - unweighed pair group method with 67
algorithmic means, Vf - final gas accumulation per g cereal 68
Introduction 69
The gastrointestinal tract (GIT) of pigs is colonized by a highly diverse microbial 70
community, which can be affected by various factors including diet and environmental 71
factors (15, 38). Manipulating the composition and metabolic activity of the gut 72
microbiota through the diet to improve gut health is an increasing focus of nutritionists in 73
the post-antibiotic era. Different strategies including the use of pre-, probiotics, organic 74
acids or zinc have been applied to manipulate the intestinal ecosystem (31, 36). 75
Surprisingly, the fact that compounds in the basal diet, such as cereal indigestible 76
carbohydrates (CHO), can also affect the intestinal microbial ecophysiology is often 77
neglected by nutritionists. Since cereals are a major component in the diets of pigs and 78
other monogastric species, and since intestinal bacteria vary in their genetic potential for 79
substrate utilization, there is great potential to beneficially manipulate microbial ecology 80
in the GIT by choice of cereal cultivars with specific CHO composition. 81
The cereal CHO composition can vary markedly between cultivars (17, 19), and 82
CHO fractions such as β-glucans could be used as functional food ingredients (6). For 83
example, Pieper et al. (32) recently showed that the intestinal microbial community 84
composition can be modified using the variability in β-glucan content within barley and 85
oat cultivars. The specific mode of action of the other CHO fractions that are present in 86
these cultivars, such as cellulose, soluble and insoluble non-starch polysaccharides (NSP) 87
and starch (e.g. content and the amylose/ amylopectin ratio) on the microbial 88
communities and their activity still remains unclear. 89
In addition to direct effects on intestinal physiology, changes in intestinal 90
microbial composition may enhance or suppress the growth of specific pathogenic 91
microorganisms by competitive exclusion. For example, Salmonella infections are among 92
the most frequent and widespread zoonoses in the world and there might be opportunities 93
to influence Salmonella colonization via nutritional strategies (30). Studying the 94
interactions of intestinal bacteria in an in vitro simulation of the porcine GIT could help 95
to rapidly screen and evaluate promising strategies for Salmonella reduction in pigs 96
without the use of animal infection models. 97
The aim of the present study was to determine the influence of variation in CHO 98
composition found in 10 hulless barleys, 6 common barleys, 6 oat cultivars and their 99
respective oat groats (dehulled oats) on large intestinal fermentation characteristics and 100
microbial community composition. An in vitro model of the porcine GIT as described by 101
Bindelle et al. (5) was employed with or without co-inoculation with Salmonella enterica 102
and using multivariate canonical analysis. 103
104
Materials and Methods 105
Substrates and chemical characterization 106
Ten hulless, 6 hulled barleys, 6 oat and the respective groats (dehulled kernels) of 107
these oat cultivars were chosen according to typical characteristics, but especially 108
according to the content of β-glucan, starch, as well as the amylose/amylopectin ratio 109
(Table S1). Most of the cultivars were developed and provided by the Crop Development 110
Centre (CDC) and grown between 2004 and 2006 at the University of Saskatchewan. The 111
selection was completed by some commercially available cultivars of cereals (McLeod, 112
AC Metcalfe). 113
Samples were analyzed for dry matter (DM) content (method 967.03; AOAC, 114
1990), crude protein (CP, method 981.10; AOAC, 1990), ash (method 923.03; AOAC, 115
1990) and ether extract (method 920.29; AOAC, 1990). Starch, amylose/amylopectin 116
ratio and water-soluble β-glucan contents were analyzed colorimetrically after enzymatic 117
hydrolysis according to standard procedures (Megazyme Ltd, Ireland). The total (t-), 118
soluble (s-) and insoluble (i-) non-starch polysaccharide (NSP) fractions were determined 119
by gas chromatography (Varian Star 3400 GC) equipped with a 30m fused silica capillary 120
column and a gas flow rate of 36.15 cm/sec after the samples were hydrolyzed with 12M 121
H2SO4 according to Englyst and Hudson (12).
122 123
In vitro hydrolysis and fermentation 124
In vitro hydrolysis and fermentation were performed using the procedure 125
described by Bindelle et al. (5). Briefly, cereal samples were hydrolyzed with porcine 126
pepsin (pH 2, 39°C, 2h) and porcine pancreatin (pH 6.8, 39°C, 4h), and residues filtered 127
through a 42 μm Nylon cloth, washed twice with 96 % ethanol and 99.5 % acetone and 128
dried at 60°C. Dry matter digestibility after hydrolysis (dDM) was recorded. Residues 129
from different hydrolysis replicates of one cultivar were pooled and incubated in an 130
inoculum prepared from fresh faeces of 3 growing pigs that were fed a non-medicated 131
diet, and mixed with a buffer solution (29). Fermentation proceeded at 39 ± 0.5°C using 132
200 mg of the hydrolyzed residues and 30 ml of the inoculum placed in 140 ml glass 133
bottles equipped with a rubber stopper. The experimental scheme was as follows: 28 134
ingredients x 3 replicates + 3 blanks (containing only inoculum). Gas pressure in the 135
bottles was regularly recorded over 72h. After 72h, the fermentation broth was 136
centrifuged (12.000 x g, 5 min) and the supernatant removed for analysis of short chain 137
fatty acids (SCFA). The pellet was further used for extraction of genomic DNA. 138
139
Analysis of SCFA 140
Supernatant of centrifuged samples (1ml) was acidified to pH 2.5 with 141
metaphosphoric acid and the internal standard (crotonic acid solution, 2mg/ml in ddH2O)
142
was added. SCFA were analyzed by gas chromatography on a 30m x 320µm x 0.25µm 143
fused-silica capillary (ZB-FFAP, Phenomenex, Torrance , CA, USA) in an Agilent 6890 144
GC system equipped with a flame ionization detector (Agilent, Böblingen, Germany). 145
Helium was the carrier gas at a flow rate of 1.9 ml/min. The flow rate of hydrogen and air 146
were 35 and 350ml/min, respectively. The initial oven temperature was 100°C followed 147
by a ramp of 8°C/min and final temperature 200°C for 13min. 148
149
DNA extraction and TRFLP analysis 150
Genomic DNA of each sample was extracted using the FastDNA® Kit (Qiagen, 151
Mississauga, Ontario, Canada) according to the manufacturer’s instructions. 152
For analysis of the microbial communities, a partial fragment of the bacterial 153
16SrRNA gene was amplified by polymerase chain reaction (PCR) using universal 154
forward primer S-D-Bact-0008-a-S-20 (AGA GTT TGA TCM TGG CTC AG), labelled 155
with 6-carboxyflourescein (6-FAM) and reverse primer S-D-Bact-0926-a-S-20 (CCG 156
TCA ATT CAT TTG AGT TT) (23). PCR reactions contained 5 µl of 10 x Incubation 157
Buffer, 1.5 µl of 50 mM MgCl2, 1.5 µl of each primer (10µM), 1.5 µl of each dNTP
158
(10mM) and 0.2 µl of Taq-Polymerase (5 U/µl) and UV-sterilised millipore water, added 159
until 50 µl. PCR was performed in a Thermolyne Amplitron II temperature cycler 160
(Barnstead/Thermolyne, Dubuque, IA, USA) and the program set as follows: 5 min at 161
95°C, 30 cycles of 95°C for 40 s, 55°C for 40 s and 72°C for 60 s, final extension at 72°C 162
for 10 min. Size and yield of PCR products were checked by electrophoresis in 1.5% 163
agarose gel after staining with ethidium bromide (0.5 µg EtBr/ml agarose). The PCR 164
product was subsequently extracted from the gel using the Qiagen® PCR Purification Kit
165
(Qiagen, Mississauga, Ontario, Canada) according to manufacturer’s protocol and the 166
DNA concentration was measured on a NanoDrop® ND-1000 spectrophotometer 167
(NanoDrop Technologies, Inc., Wilmington, DE, USA). 168
For terminal restriction fragment length polymorphism (TRFLP) analysis, 200 ng 169
of the PCR product were digested at 37°C for 6 h using 15U of MspI (Fermentas, 170
Burlington, Canada) in 2 µl reaction buffer and UV-sterilized Millipore water, made up 171
to 20 µl. Two µl of the digestion solution were subsequently mixed with 9 µl of 172
formamide and 0.5 µl of an internal size standard (ABI GeneScan™ 600 LIZ® Size
173
Standard) and denatured at 95°C for 5 min followed by immediately cooling down on ice 174
for 2 min. Fragment sizes were analyzed using an ABI 3130xl Genetic Analyzer in gene 175
scan mode and GeneMapper v3.7 software. Fragments that were different in less than + /- 176
3bp were considered to be identical as binning criteria. 177
To identify the dominant bacteria species, a small clone library (n = 96) was 178
constructed from purified PCR products of pooled DNA isolates using above mentioned 179
primers (without 6-FAM) and standard cloning procedures according to manufacturer’s 180
protocol (pGEM®-T Easy Vector System, Promega, Madison, USA). Forward sequences
181
were obtained on an ABI 3730 capillary sequencer and aligned using greengenes 182
(http://greengenes.lbl.gov/; 10). Sequences of closest cultured relatives were retrieved 183
and incorporated into ARB phylogenetic software (www.arb-home.de; 24) to assign 184
bacterial species or at least bacterial groups to individual TRF’s using the TRFcut tool 185
(http://www.mpi-marburg.mpg.de/downloads/; 34). The theoretical fragments sizes were 186
calculated for the enzyme MspI and fragment sizes having +/- 1bp similarity with 187
obtained TRF’s were considered a match. Sequences were deposited in GenBank and are 188
available under accession numbers GQ214260-GQ214312. 189
190
In vitro fermentation and proliferation of Salmonella enterica 191
According to the results of the first experiment, 10 barleys cultivars and 6 oats 192
and groats were selected for study using a co-inoculation (fecal inoculum + Salmonella) 193
approach. Citrus pectin (Sigma P-9135) was used as a negative control (7) and Tryptone 194
Soya Broth (TSB) medium was used as growth substrate for enterobacteria. 195
A double antibiotic (Novobiocin and Nalidixic acid, Nov+/Nal+) resistant strain of
196
Salmonella enterica subsp. enterica serotype Typhimurium var. Copenhagen, which was 197
obtained in a grow-finish herd during a survey in Western Canadian swine herds by the 198
Western College of Veterinary Medicine (Saskatoon, SK, Canada) and the Alberta 199
Research Council (Edmonton, AB, Canada) was selected for this study. Salmonella was 200
usually cultivated aerobically at 37°C in either TSB or on Brilliant Green agar plates, 201
containing 25µg/ml of each of the two antibiotics. 202
For the co-inoculation approach, the microbial communities in the fermentation 203
bottles were allowed to adapt to the substrate for an initial time of 6h before inoculation 204
with Salmonella. The strain was then inoculated with a syringe after gas pressure 205
measurement and gas release to a total concentration of log 3.20 ± 0.2 cfu/ml. 206
Fermentation proceeded for 24 h. Samples of mixed fermentation broth (0.1ml) were 207
taken at 6, 12 and 24 h and immediately plated onto Brilliant Green agar plates 208
(Nov+/Nal+) and plates incubated as described above. Salmonella colonies were counted
209
and reported as log cfu/ml incubation broth. After 24h, fermentation broth was 210
centrifuged (12.000 x g, 5 min) and the pellet was further used for extraction of genomic 211
DNA as described above. 212
213
Quantitative real-time PCR analysis of bacterial communities 214
Total genomic DNA from samples of the second experiment was extracted as 215
described above. Quantitative real time PCR (qPCR) was performed using previously 216
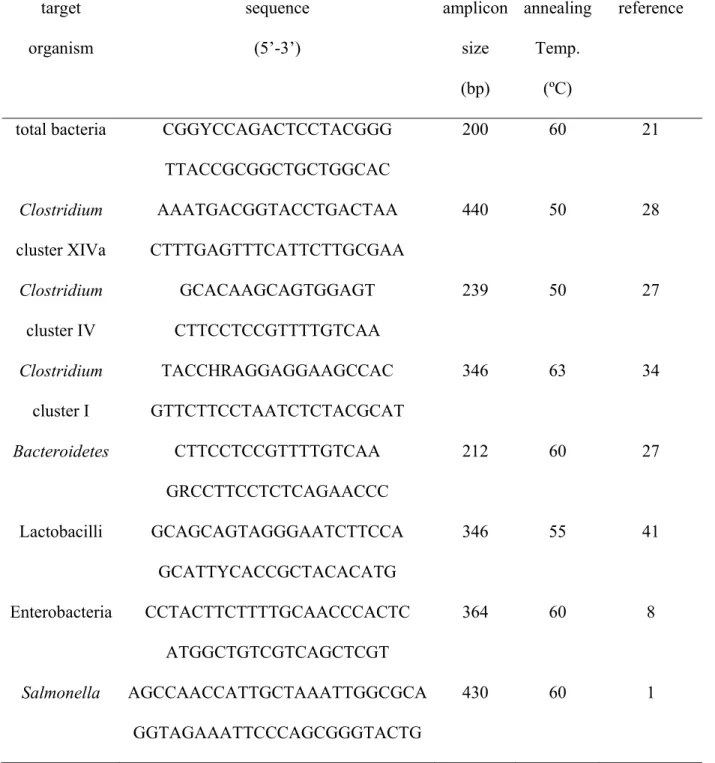
published primer sets and annealing temperatures (Table 1). The total bacterial counts, 217
counts for Salmonella, enterobacteria, Clostridium cluster XIVa, Clostridium cluster IV, 218
Clostridium cluster I, lactobacilli and Bacteroides were obtained. Amplification was 219
accomplished using an iQTM SYBR® Green Supermix (BioRad, Guénette, Canada). 220
Amplification conditions were 95°C for 10 min, followed by 40 cycles with 95°C for 30 221
sec, 50-60°C (depending on bacterial species, Table 1) for 40 sec and 72°C for 40 sec. 222
The amplifications were performed using a CFX96 Real-Time PCR detection system on a 223
C1000 thermal cycler (BioRad, Guénette, Canada) with the data collection set at the 224
annealing/extension step. Standard curves were generated using serial dilutions of 225
purified genomic DNA of Salmonella enterica (for Salmonella quantification). For the 226
quantification of total bacteria, Clostridium cluster XIVa, IV and I, enterobacteria, 227
lactobacilli and Bacteroides, purified PCR products were used that were obtained by 228
standard PCR using the primers given in Table 1. The detection limit was 102 copy 229
numbers/ml fermentation broth. Melting curves were checked after amplification in order 230
to assure correct amplification results. Results of total counts were reported as log gene 231
copy numbers/ml fermentation broth, whereas the values for the other bacterial groups 232
were reported as relative numbers compared to total bacteria. 233
234
Statistical analysis and calculations 235
The in vitro digestibility of cereal dry matter after pepsin and pancreatin 236
hydrolysis was calculated. Gas accumulation curves during fermentation of hydrolyzed 237
cereals were modeled according to France et al. (14): 238
V = 0, if 0< t < lag 239
= Vf⎛ ⎝ ⎜ 1− exp − b t − lag
{
(
)
+ c t − lag(
)
}
⎞ ⎠⎟ , if t≥L
240
where V denotes the gas accumulation, Vf (ml x g-1 initial amount of cereal) the 241
maximum gas volume for t = ∞ and lag t (h) the lag time before the fermentation starts. 242
The constants b (h-1) and c (h-1/2) determine the fractional rate of degradation of the 243
substrate µ (h-1), which is postulated to vary with time as follows:
244 t c b µ 2 + = , if t≥ lag 245
The half-time to asymptotic gas production when V = Vf 2 was symbolized by T1/2.
246
For analysis of bacterial communites, TRFLP profiles were normalized be 247
calculation of the relative peak area of each individual peak, only fragments with a 248
relative peak area ratio of Pi ≥1% and fragments larger than 80bp were considered to 249
perform a cluster analysis using Pearson correlation and unweighed pair group method 250
with algorithmic means (UPGMA) with Statistica software (version 6.0, Statsoft, Tulsa, 251
OK, USA). 252
To analyze the complex interactions of cereal carbohydrate fractions on in vitro 253
digestibility, fermentation kinetics parameters, SCFA profiles and relative abundance of 254
bacterial groups and species, we applied a multivariate analysis using CANOCO 255
statistical package version 4.5 (37). The values for starch, amylose, amylopectin, β-256
glucan, cellulose, tNSP, sNSP, iNSP and CP contents in the cereal cultivars were 257
imported as explanatory variables. Square root transformed values for relative abundance 258
of TRF’s, SCFA production and molar ratio, parameters of fermentation kinetics and 259
dDM values were used as response variables. Explanatory and response data were used 260
for constrained linear ordination analysis (redundancy analysis, RDA), Whereas 261
unconstrained ordinations such as principle component analysis, are methods seeking one 262
or more gradients representing predictors that best explain response variable composition, 263
in constrained ordinations such as RDA, these predictors are further restricted and 264
ordination axes must be generated from linear combinations of weighed environmental 265
variables. The explanation of response variables with synthetic variables (ordination 266
axes) can therefore be further defined using values of the explanatory characteristics (37). 267
Significance of the overall ordination model as well as the effect of explanatory variables 268
during development of the ordination model was tested using Monte Carlo permutation 269
test (n=499). 270
Finally, statistical analysis of dry matter digestibility (dDM) during pepsin-271
pancreatin hydrolysis, in vitro gas production kinetics parameters (L, T1/2, Vf), total 272
short-chain fatty acid (SCFA) production and molar ratios of individual SCFA after 72 h 273
of in vitro fermentation as well as qPCR results from the second co-inoculation run was 274
performed by ANOVA followed by Tukey-HSD test using SPSS (version 17.0, Chicago, 275
IL, USA). P-values of <0.05 were considered significant. 276
277
Results 278
Chemical composition of cereals 279
The chemical composition of the cereals used in this study is presented in Table 280
S1. There was a high variation between cereal types and cultivars. The β-glucan content 281
ranged from 4.6 (CDC McGwire) to 12.7% (CDC Fibar) in hulless barleys and from 4.1 282
to 5.9% in common barleys, whereas slightly lower values where found in the oat 283
cultivars (2.9 to 5.1%). The ‘waxy’ hulless barleys CDC Rattan, SR93139, CDC Fibar, 284
SB94917 and HB393 showed low levels of amylose starch whereas the ‘high amylose’ 285
cultivars SH99250 and SB94893 had amylose concentrations of 38.9 and 46.1% of total 286
starch respectively. The tNSP values varied from 7.7 to 15.3% in hulless barleys, 11.9 to 287
17.2% in common barley, and 16.6 to 26.1% in oats, likely due to the higher content of 288
cellulose and lignified hulls. 289
290
In vitro fermentation parameters 291
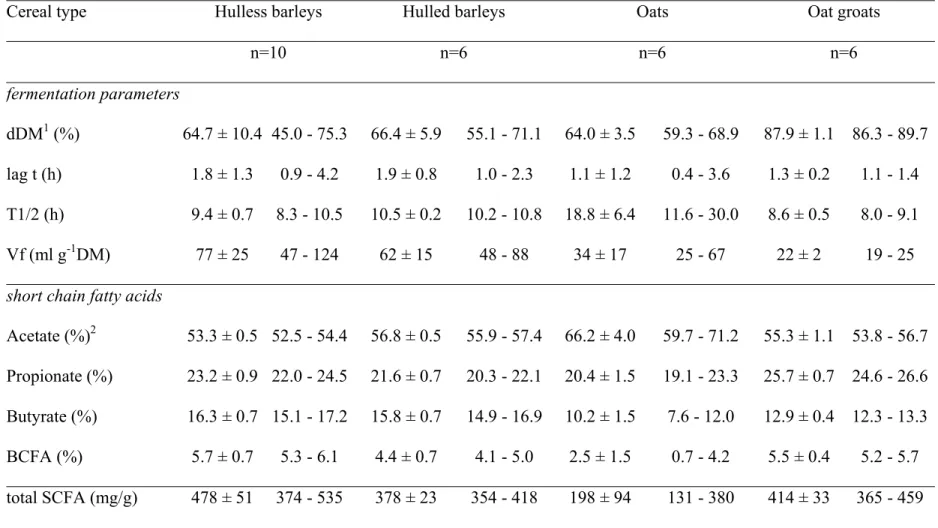
The dDM after enzymatic hydrolysis and the fermentation parameters are 292
presented in summarized form for the different cereal types in Table 2. Values for 293
individual cereals and statistical comparison of means between cultivars are presented as 294
supplemental material (Table S2). To illustrate the variability, the mean values with 295
standard deviation and the range are presented for each grain type. The in vitro dry matter 296
digestibility varied between grain types and cultivars and was partly related to the 297
amylose/amylopectin ratio in hulless barley cultivars. Common barley types and oats 298
showed almost similar values with lower variability, whereas the highest digestibility was 299
found for oat groats (up to 89.7%). The fermentation characteristics also showed 300
considerable variation within and between grain types. For example, the lag t was 301
increased with high amylose hulless barleys. Most differences were observed for final gas 302
volume, which was expressed per g of original non-hydrolyzed cereal. There was an 303
apparent effect of starch type and β-glucan content on gas production. High amylose 304
barleys SB94893 and SH99250 had the highest values followed by the high β-glucan 305
cultivars. Total SCFA production was highest with hulless barleys and oat groats but 306
ranged from 374 (SB90300) to 535 mg/g substrate (CDC Fibar) in hulless barleys and 307
from 365 (HiFi) to 459 mg/g substrate (CDC ProFi) with oat groats. The lowest values 308
(except for CDC SO-I) were found for oats whereas the common barleys had 309
intermediate values. The high hull containing oats had higher molar ratios of acetate (59.7 310
to 71.2%) and lower values for butyrate (7.6 to 12.0%) as compared to the other varieties. 311
The highest values for propionate were found with oat groats with 24.6 to 26.6% for 312
Morgan and CDC ProFi, respectively. Branched chain fatty acids as indicators of protein 313
breakdown were found to be lowest with oats (0.7 to 4.2% for CDC SO-I and CDC ProFi, 314
respectively), whereas higher values were observed with hulless barleys (5.3 to 6.1% for 315
SB90354 and SB90300, respectively) and oat groats (5.2 to 5.7% for Morgan and CDC 316
ProFi/CDC Sol-Fi, respectively). 317
318
Bacterial community composition 319
The cluster analysis based on the TRF’s (Figure 1) revealed distinct bacterial 320
profiles based on the cereal type (except for CDC Clyde and SB90300). Two main 321
clusters were formed by either hull containing common barleys and oats or by hulless 322
barleys and oat groats. CDC SO-I clustered different from alls cultivars. However, 323
between cultivars of hulless barleys, there was a very high variability and small 324
subclusters as compared to the very similar clusters with common barleys and oats. 325
To assign bacterial phylotypes to individual TRF’s an in silico TRF cut tool was 326
implemented into ARB phylogenetic software. The results (Figure 2) revealed that cereal 327
types and cultivars mainly influenced the abundance of members of clostridial clusters IV 328
and XVIa but also clostridial clusters I, XVIII and members of Bacteroides. For example 329
Ruminococcus flavefaciens-like (TRF 20) and Clostridium xylanolyticum-like phylotypes 330
(TRF 16) were enhanced in high cellulose/hull containing cereals whereas other bacteria, 331
belonging to clostridial clusters XIVa and I were enhanced with hulless barleys (data not 332
shown). Unfortunately TRF’s # 7, 8, 9, 10, 19, 21 could not be identified by this 333
approach. However, they were included in the analyses since they represented >1% of the 334
total bacterial communities. 335
336
Multivariate canonical analysis 337
Results of the RDA analyses for interaction between cereal nutrient composition 338
and digestibility and fermentation responses for all cereals, and barleys, oats and hulless 339
barleys separately are presented in Figure 3a-d. The RDA of the four grain types together 340
(Figure 3a, n = 28) revealed the major influence of cellulose (P=0.002), β-glucan 341
(P=0.006), CP (P=0.030) and a trend for amylose (P=0.058) contents on the overall 342
ordination model. Cellulose, iNSP and tNSP were highly correlated to the first 343
ordinational axis as a consequence of the clustering of the oats with high hulls and 344
cellulose contents along this axis, whereas the other axis of the model covered only 345
12.1% of the variance. As an example how to read and interpret the data in the RDA 346
graphs: the acetate molar ratio, T1/2, Ruminococcus flavefaciens-like and Clostridium 347
xylanolyticum-like phylotypes (TRF16 and 20) were positively correlated to cellulose, 348
iNSP and tNSP as indicated by the small ankle between the arrows for these variables 349
(<90°). An ankle of >90° would indicate a negative correlation (i.e. between amylopectin 350
and cellulose in Figure 2a, r = -0.56). In comparison to cellulolytic materials, the sNSP 351
and CP values were positively correlated with propionate molar ratio and members of the 352
clostridial cluster XIVa (TRF12). Formation of BCFA was associated with Clostridium 353
ramosum-like bacteria (TRF17), amylopectin and starch contents. The concentrations of 354
β-glucan were associated with high fermentation activity (Vf), high amounts of SCFA 355
and butyrate molar ratio, and members of clostridial cluster XIVa (TRF11). 356
RDA of barleys (Figure 3b, n=16) highlighted the strong influence of β-glucan 357
(P=0.002), tNSP (P=0.002) and amylopectin (P=0.002) on the model. The β-glucan and 358
CP content were positively correlated with the production of SCFA and BCFA As 359
already observed by the analysis of the 4 grains together, acetate molar ratio, half-time to 360
asymptote (T1/2) and R. flavefaciens and C. xylanolyticum-like phylotypes (TRF16 and 361
20) were positively correlated with cellulose, tNSP and iNSP, but negatively with β-362
glucan content of the barleys. There was also a positive correlation of amylopectin with 363
propionate molar ratio and abundance of Bacteroides/Cytophaga-like phylotypes (TRF6), 364
whereas amylopectin was negatively correlated to butyrate molar ratio with the barleys. 365
However, butyrate molar ratio was positively correlated with lag t, Vf and C. butyricum-366
like phylotypes (TRF23). 367
RDA of only oats and oat groats together (Figure 3c, n=12) highlighted the strong 368
impact of the cellulose contents of the oats on the ordination model (P=0.002). Similar to 369
the overall model, cellulose, iNSP and tNSP contents were associated with elevated 370
acetate molar ratio, high abundance of R. flavefaciens and C. xylanolyticum-like 371
phylotypes (TRF16 and 20), and fermentation characteristics. In contrast, the oat groats 372
were associated with most of the other response variables. 373
Finally, a RDA analysis was performed for hulless barley varieties only (Figure 374
3d, n=10) since they displayed the highest variation in nutrient composition between 375
cultivars. As already revealed by the analysis of all barleys together, amylopectin was 376
positively correlated with propionate molar ratio, digestibility of dry matter, the 377
production of BCFA and Bacteroides/Cytophaga-like phylotypes (TRF6). In contrast, the 378
β-glucan content was positively correlated C. ramosum-like (TRF17) phylotypes, other 379
members of clostridial clusters IV and XIVa (TRF11 and 12) and the production of 380
SCFA, whereas it was negatively correlated to R. flavefaciens-like an C. xylanolyticum-381
like phylotypes (TRF16 and 20). Higher molar ratios of butyrate were also associated 382
with C. butyricum-like bacteria (TRF23), and positively correlated to amylose 383
concentration. Other bacterial phylotypes reacted differentially and showed no clear 384
association with cereal factors. 385
386
Impact of cereal cultivars on Salmonella proliferation 387
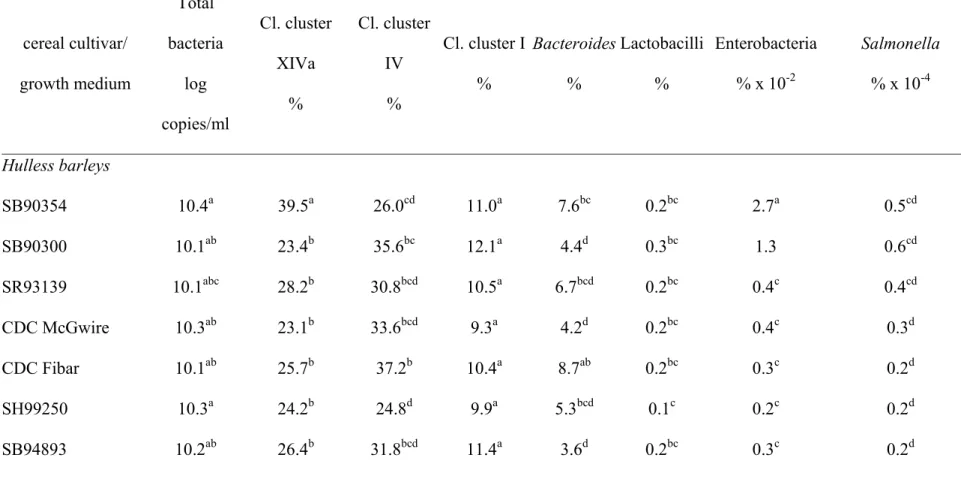
After the inoculation of the Salmonella enterica strain during the second 388
experiment, no significant changes were observed numbers of double resistant 389
(Nal+/Nov+) Salmonella enterica during the fermentation suggesting no effects of CHO 390
(data not shown). However, qPCR results using genomic DNA extracts after 24h, 391
revealed significant (P<0.05) differences for the relative amount of Salmonella/total 392
bacterial 16S rRNA gene copy numbers in hulless barley cultivars CDC McGwire, CDC 393
Fibar, SH99250 and SB94893 (Table 3). These four cereal types had similar values as the 394
negative control pectin. In contrast, the relative proportion was highest in the blank and 395
with the oat cultivars. The relative contribution of enterobacteria and lactobacilli was 396
generally low, whereas Clostrium cluster XIVa, IV, I and Bacteroides dominated the 397
bacterial communities. Overall, 77% of the total bacterial communities were detected 398
with the current qPCR approach ranging from 61% (TSB) to 93% (pectin). Similar to the 399
TRFLP results, there were significant differences according to the grain type with 400
Clostridium clusters IV and I. Almost no differences were observed for cluster XIVa, 401
whereas Bacteroides showed no clear response according to grain type or cultivar. 402
403
Discussion 404
Although, the results presented here are based on an in vitro system of the porcine 405
GIT, they confirm the great potential for manipulating intestinal microbial composition 406
through the use of cereal sources containing carbohydrates with prebiotic properties. Due 407
to the use of an in vitro fermentation model, results are limited to the porcine large 408
intestine but as an addition when compared to other in vitro models, we simulated the 409
nutrient digestion in the upper GIT using a pepsin-pancreatin pre-treatment, aiming to 410
obtain the indigestible fraction of the ingredients, which is likely to undergo fermentation 411
in the large intestine in vivo (5). Both experiments presented here, support the hypothesis 412
of complex CHO interaction with the microbial ecosystem. It is already well known that 413
contrasting sources of CHO can affect the fermentation characteristics in vitro, causing 414
differences in lag t, slope of gas production curves and final gas volume (2, 4, 5). 415
Furthermore, it has been shown that these contrasting CHO sources affect the profiles of 416
the fermentation end-products (2). Similar to these results, in the present study, 417
differences in fermentation characteristics and bacterial metabolites were observed 418
between cereal types, hulless barley, common barley, oat and oat groats. However, the 419
effect of contrasting CHO composition between cultivars of a same cereal species or type 420
on these parameters in vitro was still unknown. Results indicate that, especially within the 421
hulless barleys, there was a considerable variation of these parameters depending on 422
cultivars. Parameters also partially overlapped with other cereal types. These results were 423
confirmed by cluster analysis of TRFLP profiles, showing very little variation between 424
common barley types and their close relation to high cellulose containing oat cultivars, 425
whereas greater differences where found for hulless barleys and oat groats. This suggests 426
a dominant effect of fibrous materials in the hulls (cellulose, lignin, iNSP) on the 427
fermentation patterns. The fact that CDC SO-I was not included in the oat-common-428
barley-cluster could be explained with its differential fermentation behaviour, starting a 429
high activity towards the end of the fermentation (Table S2). This cultivar is 430
characterized by a low lignin content, suggesting increased cellulose availability for 431
fermentation. The high variability with hulless barleys confirms the complex interaction 432
of CHO in these cultivars, suggesting that other carbohydrate fractions such as iNSP, 433
sNSP or amylose/amylopectin ratio of the starch fraction had a strong influence on 434
bacterial community composition in vitro. 435
Despite the great advantage of molecular microbiological tools, such as TRFLP, 436
to study bacterial communities without the need of cultivation, it has to be noted that 437
there are some drawbacks including primer and PCR bias or formation of pseudo-TRF’s 438
(9, 11). Furthermore, it is difficult to assign bacterial species to individual TRF’s since 439
different phylotypes could give similar TRF’s after restriction digest. In the present study, 440
there were some TRF’s that could not be assigned (e.g. TRF’s 7, 8, 9, 10, 19, 21), likely 441
due to the size of the clone library. On the other hand, some TRF’s ( e.g. R. flavefaciens, 442
Cl. xylanolyticum, Cl. butyricum) could be better assigned to species-like phylotypes due 443
to their frequent occurrence in clone library analysis. Furthermore, since samples in the 444
present study were generated based on the same biases, it is possible to compare between 445
samples on a relative basis. 446
To our knowledge, this is the first time that the interactions of nutrient source and 447
intestinal microbial activity were studied using redundancy analysis. Using this approach, 448
the effect of cereal CHO included in the grain matrix on the microbial composition and 449
activity can be visualized. When analysing the data for all cereal types and varieties 450
together (Figure 3a), high cellulose and i-NSP containing oats and common barleys 451
showed slow fermentation and favoured cellulolytic, acetate producing R. flavefaciens- 452
and Cl. xylanolyticum-like bacteria (TRF16 and 20). These species have specifically 453
adapted to the breakdown of fibrous (cellulolytic, xylanolytic) material during 454
evolutionary co-existence with the host organism (13). They belong to clostridial clusters 455
IV and XIVa, respectively and are typical colonizers of in the distal gastrointestinal tract 456
of monogastric and forestomach of ruminant species (13, 20, 22, 39). Corresponding to 457
the present data, the breakdown of cellulolytic materials usually resulted in acetate 458
formation. On the other hand, β-glucans favored Cl. ramosum-like species (cluster XVIII, 459
TRF17), members of clostridial cluster IV and XIVa (TRF11 and 12) and the overall 460
SCFA production. In contrast to these results, isolated β-glucans favored the growth of 461
Cl. histolyticum-like bacteria and increased the propionate molar ratio in another recent in 462
vitro study using human fecal microbiota (18). This is in contrast to the present findings 463
and might either indicate differences in the general in vitro model or whether isolated β-464
glucans or whole cereals containing the β-glucans in the grain matrix are used (32). RDA 465
on HLB (Figure 3d) revealed that the high amylose content of some hulless barley 466
cultivars favoured the contribution of butyrate producing members of clostridial cluster I 467
(Cl. butyricum-like phylotypes) but not members of clostridial cluster XIVa which are 468
commonly involved in butyrate formation (3, 33). Although butyrate production might be 469
a beneficial effect for maintaining intestinal health, this result has to be handled with 470
care, since other members of clostridial cluster I such as Cl. botulinum, or Cl. perfringens 471
may be harmful for the host organism. Finally, the starch and amylopectin values were 472
positively correlated with propionate molar ratio and Cytophaga/Bacteroides-like 473
bacteria, likely due to their ability for starch utilization (42). 474
The differential response of clostridia to the available substrates with hulless and 475
common barleys, oats and oat groats was confirmed by qPCR of dominant bacterial 476
groups in the second experiment. However, the in vivo contribution of these bacterial 477
species might be overestimated with in the current in vitro method as we used a buffered 478
medium. For example, bacteria such as Ruminococcus sp. were shown to exert less 479
metabolic activity below pH 6.3 (16). Furthermore, the abundances of Bacteroides 480
increase and Roseburia-like species decrease with a shift from pH 5.5 to 6.5 (40). 481
Salmonella infections are among the most frequent and widespread zoonotic 482
diseases in the world. Since there might be opportunities to reduce the prevalence of 483
Salmonella using feeding strategies, a co-inoculation model was developed to study the 484
effect of cereal CHO on Salmonella proliferation in vitro. There was no reduction of 485
Salmonella counts due to different fermentable substrates indicating that Salmonella was 486
able to survive in the buffered system and occupy an ecological niche and without and 487
challenge trough a hosts’ immune response. In a recent study by Martin-Peláez et al., 488
(25), Salmonella counts were significantly reduced with lactulose as a substrate. 489
However, in their study Martin-Peláez et al. (25) used very high numbers of Salmonella 490
(>log 7.0 cfu), which would not naturally occur during a normal Salmonella infection. 491
Callaway et al. (7), by using an in vitro simulation technique of ruminal fermentation, 492
revealed that pectin could significantly reduce the prevalence of Salmonella. This was in 493
part confirmed by our results, but only the relative proportion of Salmonella was reduced 494
with pectin. Although this might represent a beneficial effect, when interpreted as 495
competitive exclusion and reduction in relative Salmonella abundance, it appears that in 496
vitro system have to many limitations to study nutritional effects on pathogen 497
proliferation (26). However, it is not clear to which extent such results could be 498
transferred to in vivo conditions and actually reduce Salmonella colonization and or the 499
transmission among animals. 500
501
Conclusions 502
The current study reveals that differences in CHO composition between cereal 503
cultivars of the same grain type, can affect the pig intestinal microbial ecophysiology. 504
These effects were furthermore revealed by multivariate canonical analysis showing the 505
usefulness of this approach when studying the intestinal microbial ecophysiology and 506
nutrient-microbe interactions. However, irrespective of grain type, positive correlations 507
were found between acetate production, cellulolytic bacteria and cellulose content; 508
butyrate production and either amylose and/or β-glucan contents; and propionate 509
production and amylopectin. This indicates typical ecophysiological signatures of CHO 510
fractions, namely amylose/amylopection ratio and β-glucan content in the pig intestinal 511
tract. Effects between cultivars not only result in different microbial ecological response, 512
but could affect the susceptibility of the host to opportunistic pathogens such as 513
Salmonella enterica due to trend of relative amounts in some hulless barley varieties. 514
515
Acknowledgements 516
We thank Agriculture & Agri-Food Canada, administrated through Agriculture & 517
Food Council of Alberta (ACAAF Project # AB0446; Nisku AB, Canada) for funding of 518
the study. The continuing core support of the Prairie Swine Centre received from Sask 519
Pork, Manitoba Pork Council, Alberta Pork and the Saskatchewan Agriculture 520
Development Fund is gratefully acknowledged. R. Pieper was funded by a post-doctoral 521
research grant from the German Academic Exchange Service (DAAD, Germany). We are 522
grateful to the technical staff of the Prairie Swine Centre and the Department of Animal 523
and Poultry Science at the University of Saskatchewan for their assistance. 524
References 526
1. Aabo, S., O. F. Rasmussen, I. Rossen, P. D. Sørensen, and J. E. Olsen. 1993. 527
Solamonella identification by the polymerase chain reaction. Mol. Cell. Probes 528
7:171-178.
529
2. Awati, A., B. A. Williams, M. W. Bosch, Y. C. Li, and M. W. A. Verstegen. 2006. 530
Use of the in vitro cumulative gas production technique for pigs: An examination of 531
alterations in fermentation products and substrate losses at various time points. J. 532
Anim. Sci. 84:1110-1118. 533
3. Barcenilla, A., S. E. Pryde, J. C. Martin, S. H. Duncan, C. S. Stewart, C. 534
Henderson, and H. J. Flint. 2000. Phylogenetic relationships of butyrate-producing
535
bacteria from the human gut. Appl. Environ. Microbiol. 66:1654-1661. 536
4. Bauer, E., B. A. Williams, C. Voigt, R. Mosenthin, and W. M. A. Verstegen. 537
2001. Microbial activities of faeces from unweaned and adult pigs, in relation to 538
selected fermentable carbohydrates. Anim. Sci. 73:313-322. 539
5. Bindelle, J., A. Buldgen, C. Boudry, and P. Leterme. 2007. Effect of inoculum 540
and pepsin-pancreatin hydrolysis on fibre fermentation measured by the gas 541
production technique in pigs. Anim. Feed Sci. Technol. 132:111-122. 542
6. Brennan, C.S., and L. J. Cleary. 2005. The potential use of cereal (1-->3,1-->4)-543
[beta] glucans as functional food ingredients. J. Cereal Sci. 42:1-13. 544
7. Callaway, T. R., J. A. Carroll, J. D. Arthington, C. Pratt, T. S. Edrington, R. C. 545
Anderson, M. L. Galyean, S. C. Ricke, P. Crandall, and D. J. Nisbet. 2008.
546
Citrus products decrease growth of E. coli O157:H7 and Salmonella Typhimurium in 547
pure culture and in fermentation with mixed ruminal microorganisms in vitro. Food. 548
Path. Dis. 5:621-627. 549
8. Castillo, M., S. M. Martin-Oruem, E. G. Manzanilla, I. Badiola, M. Martin, and 550
J. Gasa. 2006. Quantification of total bacteria, enterobacteria and lactobacilli
551
populations in pig digesta by real-time PCR. Vet. Microbiol. 114:165-170. 552
9. Crosby, L. D., and C. S. Criddle. 2003. Understanding bias in microbial 553
community analysis techniques due to rrn operon copy number heterogeneity. 554
Biotechn. 34:790-798. 555
10. DeSantis, T. D., P. Hugenholtz, K. Keller, E. L. Brodie, N. Larsen, Y. M. Piceno, 556
R. Phan, and G.L. Andersen. 2006. NAST: a multiple sequence alignment server
557
for comparative analysis of 16S rRNA genes. Nucleic Acids Res. 34:W394-399. 558
11. Egert, M., and M.W. Friedrich. 2003. Formation of pseudo-terminal restriction 559
fragments, a PCR-related bias affecting terminal restriction length polymorphism 560
analysis of microbial community structure. Appl. Environ. Microbiol. 69:2555-2562. 561
12. Englyst, H.N. and G. J. Hudson. 1987. Method for routine measurement of dietary 562
fibre as non-starch polysaccharides. A comparison with gas liquid chromatography. 563
Food Chemistry. 24:63-76. 564
13. Flint, H. J., E. A. Bayer, E. T. Rincon, R. Lahmed, and B.A. White. 2008. 565
Polysaccharide utilization by gut bacteria: potential for new insights from genomic 566
analysis. Nat. Rev. Microbiol. 6:121-131. 567
14. France, J., M. S. Dhanoa, M. K. Theodorou, S. J. Lister, D. R. Davies, and D. 568
Isac. 1993. A model to interpret gas accumulation profiles associated with in vitro
569
degradation of ruminant feeds. J. Theor. Biol. 163:99-111. 570
15. Hill, J. E., S. M. Hemmingsen, B. G. Goldade, T. J. Dumonceaux, J. Klassen, R. 571
T. Zijlstra, S. H. Goh, and A. G. Van Kessel. 2005. Comparison of ileum
572
microflora of pigs fed corn-, wheat-, or barley-based diets by chaperonin-60 573
sequencing and quantitative PCR. Appl. Environ. Microbiol. 71:867-875. 574
16. Hiltner, P., and B. A. Dehority. 1983. Effect of soluble carbohydrates on digestion 575
of cellulose by pure cultures of rumen bacteria. Appl. Environ. Microbiol. 46:642-576
648. 577
17. Høltekjolen, A. K., A. K. Uhlen, E. Bråthen, S. Sahlstrøm, and S. H. Knutsen. 578
2006. Contents of starch and non-starch polysaccharides in barley varieties of 579
different origin. Food Chem. 94:348-358. 580
18. Hughes, S. A., P. R. Shewry, G. R. Gibson, B. V. McCleary, R. A. Rastall. 2008. 581
In vitro fermentation of oat and barley derived β-glucans by human faecal 582
microbiota. FEMS Microbiol. Ecol. 64:482-493. 583
19. Izydorczyk, M. S., J. Storsley, D. Labossiere, A. W. MacGregor, and B. G. 584
Rossnagel. 2000. Variation in total and soluble β-glucan content in hulless barley:
585
Effects of thermal, physical, and enzymic treatments. J. Agric. Food Chem. 48:982-586
989. 587
20. Julliand, V., A. De Vaux, L. Millet, and G. Fonty. 1999. Identification of 588
Ruminococcus flavefaciens as the predominant cellulolytic bacterial species in the 589
equine cecum. Appl. Environ. Microbiol. 65:3738-3741. 590
21. Lee, D.-H., Y.-G. Zo, and S.-J. Kim. 1996. Nonradioactive method to study genetic 591
profiles of natural bacterial communities by PCR-single-strand-conformation 592
polymorphism. Appl. Environ. Microbiol. 62:3112-3120. 593
22. Leser, T. D., J. Z. Amenuvor, T. K. Jensen, R. H. Lindecrona, M. Boye, and K. 594
Moller. 2002. Culture-independent analysis of gut bacteria: the pig gastrointestinal
595
tract microbiota revisited. Appl. Environ. Microbiol. 68:673-690. 596
23. Liu, W.T., T.L. Marsh, H. Cheng, and L.J. Forney. 1997. Characterization of 597
microbial diversity by determining terminal restriction fragment length 598
polymorphisms of genes encoding 16S rRNA. Appl. Environ. Microbiol. 63:4516-599
4522. 600
24. Ludwig, W., O. Strunk, R. Westram, L. Richter, H. Meier, Yadhukumar, A. 601
Buchner, T. Lai, S. Steppi, G. Jobb, W. Forster, I. Brettske, S. Gerber, A. W.
602
Ginhart, O. Gross, S. Grumann, S. Hermann, R. Jost, A. Konig, T. Liss, R.
603
Lussmann, M. May, B. Nonhoff, B. Reichel, R. Stehlow, A. Stamatakis, N.
604
Stuckmann, A. Vilbig, M. Lenke, T. Ludwig, A. Bode, and K. H. Schleifer. 2004.
605
ARB: a software environment for sequence data. Nucleic Acids Res. 32:1363-1371. 606
25. Martín-Peláez, S., G. R. Gibson, S. M. Martín-Orúe, A. Klinder, R. A. Rastall, 607
R. M. La Ragione, M. J. Woodward, and A. Costabile. 2008. In vitro fermentation
608
of carbohydrates by porcine faecal inocula and their influence on Salmonella 609
Typhimurium growth in batch culture systems. FEMS Microbiol. Ecol. 66:608-619. 610
26. Martín-Peláez, S., A.G. Manzanilla, M. Anguita, M. Fondevila, M. Martín, E. 611
Mateu, and S.M. Martín-Orúe. 2009. Different fibrous ingredients and coarsely
612
ground maize affect hindgut fermentation in the pig in vitro but not Salmonella 613
Typhimurium survival. Anim. Feed Sci. Technol. 153:141-152. 614
27. Matsuki, T., K. Watanabe, J. Fujimoto, T. Takada, and R. Tanaka. 2004. Use of 615
16S rRNA gene-targeted group-specific primers for real-time PCR analysis of 616
predominant bacteria in human feces. Appl. Environ. Microbiol. 70:7220-7228. 617
28. Matsuki, T., K. Watanabe, J. Fujimoto, Y. Miyamoto, T. Takada, K. 618
Matsumoto, H. Oyaizu, and R. Tanaka. 2002. Development of 16S
rRNA-gene-619
targeted group-specific primers for the detection and identification of predominant 620
bacteria in human feces. Appl. Environ. Microbiol. 68:5445-5451. 621
29. Menke, K.H., and H. Steingass. 1988. Estimation of the energetic feed value 622
obtained from chemical analysis and in vitro gas production using rumen fluid. 623
Anim. Res. Develop. 28:7-55. 624
30. O’Connor, A.M., T. Denagamage, J. M. Sargeant, A. Rajic, J. McKean. 2008. 625
Feeding management practices and feed characteristics associated with Salmonella 626
prevalence in live and slaughtered market-weight finisher swine: A systematic 627
review and summation of evidence from 1950 to 2005. Prev. Vet. Med. 87:213-228. 628
31. Pettigrew, J.E. 2006. Reduced use of antibiotic growth promoters in diets fed to 629
weanling pigs: dietary tools, part 1. Anim. Biotechnol. 17:207-215. 630
32. Pieper, R., R. Jha, B. Rossnagel, A. G. Van Kessel, W. B. Souffrant, and P. 631
Leterme. 2008. Effect of barley and oat cultivars with different carbohydrate
632
compositions on the intestinal bacterial communities in weaned piglets. FEMS 633
Microbiol. Ecol. 66:556-566. 634
33. Pryde, S. E., S. H. Duncan, G. L. Hold, C. S. Stewart, and H. J. Flint. 2002. The 635
microbiology of butyrate formation in the human colon. FEMS Microbiol. Lett. 636
217:133-139.
34. Ricke, P., S. Kolb, and G. Braker. 2005. Application of a newly developed ARB 638
software-integrated tool for in silico terminal restriction fragment length 639
polymorphism analysis reveals the dominance of a novel pmoA cluster in a forest 640
soil. Appl. Environ. Microbiol. 71:1671-1673. 641
35. Song, Y., C. Liu, and S. M. Finegold. 2004. Real-time PCR quantitation of 642
clostridia in feces of autistic children. Appl. Environ. Microbiol. 70:6459-6465. 643
36. Stein, H.H., and D. Y. Kil. 2006. Reduced use of antibiotic growth promoters in 644
diets fed to weanling pigs: dietary tools, part 2. 17:217-231. 645
37. Ter Braak, C. J. F., and P. Šmilauer. 2002. CANOCO reference manual and 646
CanoDraw for Windows user’s guide: software for canonical community ordination 647
(version 4.5). Microcomputer Power. Ithaca, NY, USA. 648
38. Thompson, C. L., B. Wang, and A. J. Holmes. 2008. The immediate environment 649
during postnatal development has long-term impact on gut community structure in 650
pigs. ISME J. 2:739-748. 651
39. Varel, V. H., and J. T. Yen. 1997. Microbial perspective on fiber utilization by 652
swine. J. Anim. Sci. 75:2715-2722. 653
40. Walker, A. W., S. H. Duncan, E. C. McWilliam Leitch, M. W. Child, and H. J. 654
Flint. 2005. pH and peptide supply can radically alter bacterial populations and
655
short-chain fatty acid ratios within microbial communities from the human colon. 656
Appl. Environ. Microbiol. 71:3692-3700. 657
41. Walter, J., C. Hertel, G. W. Tannock, C. M. Lis, K. Munro, W. P. Hammes. 658
2001. Detection of Lactobacillus, Leuconostoc, and Weissella species in human feces 659
by using group-specific PCR primers and denaturing gradient gel electrophoresis. 660
Appl. Environ. Microbiol. 67:2578-2585. 661
42. Xu, J., M. K. Bjursell, J. Himrod, S. Deng, L. K. Carmichael, H. C. Chiang, L. 662
V. Hooper, and J. I. Gordon. 2003. A genomic view of the human-Bacteroides
663
thetaiotaomicron symbiosis. Science 299:2074-2076. 664
Table 1. List of primers used for quantitative real-time PCR target organism sequence (5’-3’) amplicon size (bp) annealing Temp. (ºC) reference
total bacteria CGGYCCAGACTCCTACGGG TTACCGCGGCTGCTGGCAC 200 60 21 Clostridium cluster XIVa AAATGACGGTACCTGACTAA CTTTGAGTTTCATTCTTGCGAA 440 50 28 Clostridium cluster IV GCACAAGCAGTGGAGT CTTCCTCCGTTTTGTCAA 239 50 27 Clostridium cluster I TACCHRAGGAGGAAGCCAC GTTCTTCCTAATCTCTACGCAT 346 63 34 Bacteroidetes CTTCCTCCGTTTTGTCAA GRCCTTCCTCTCAGAACCC 212 60 27 Lactobacilli GCAGCAGTAGGGAATCTTCCA GCATTYCACCGCTACACATG 346 55 41 Enterobacteria CCTACTTCTTTTGCAACCCACTC ATGGCTGTCGTCAGCTCGT 364 60 8 Salmonella AGCCAACCATTGCTAAATTGGCGCA GGTAGAAATTCCCAGCGGGTACTG 430 60 1
Table 2. Mean ± SD and range (minimum - maximum) of the in vitro dry matter digestibility, fermentation kinetics parameters and bacterial metabolite profiles of the 4 cereals.
Cereal type Hulless barleys Hulled barleys Oats Oat groats
n=10 n=6 n=6 n=6 fermentation parameters dDM1 (%) 64.7 ± 10.4 45.0 - 75.3 66.4 ± 5.9 55.1 - 71.1 64.0 ± 3.5 59.3 - 68.9 87.9 ± 1.1 86.3 - 89.7 lag t (h) 1.8 ± 1.3 0.9 - 4.2 1.9 ± 0.8 1.0 - 2.3 1.1 ± 1.2 0.4 - 3.6 1.3 ± 0.2 1.1 - 1.4 T1/2 (h) 9.4 ± 0.7 8.3 - 10.5 10.5 ± 0.2 10.2 - 10.8 18.8 ± 6.4 11.6 - 30.0 8.6 ± 0.5 8.0 - 9.1 Vf (ml g-1DM) 77 ± 25 47 - 124 62 ± 15 48 - 88 34 ± 17 25 - 67 22 ± 2 19 - 25
short chain fatty acids
Acetate (%)2 53.3 ± 0.5 52.5 - 54.4 56.8 ± 0.5 55.9 - 57.4 66.2 ± 4.0 59.7 - 71.2 55.3 ± 1.1 53.8 - 56.7 Propionate (%) 23.2 ± 0.9 22.0 - 24.5 21.6 ± 0.7 20.3 - 22.1 20.4 ± 1.5 19.1 - 23.3 25.7 ± 0.7 24.6 - 26.6 Butyrate (%) 16.3 ± 0.7 15.1 - 17.2 15.8 ± 0.7 14.9 - 16.9 10.2 ± 1.5 7.6 - 12.0 12.9 ± 0.4 12.3 - 13.3 BCFA (%) 5.7 ± 0.7 5.3 - 6.1 4.4 ± 0.7 4.1 - 5.0 2.5 ± 1.5 0.7 - 4.2 5.5 ± 0.4 5.2 - 5.7 total SCFA (mg/g) 478 ± 51 374 - 535 378 ± 23 354 - 418 198 ± 94 131 - 380 414 ± 33 365 - 459 1 dDM = digestible dry matter, T1/2 = half time to asymptotic gas production, lag t = lag time, Vf = amount of gas produced/g cereal before
Table 3. Quantitative real-time PCR analysis (Mean±SD) of total bacterial counts (log 16S rDNA gene copy numbers/ml of fermentation broth) and the relative contribution (%) of six bacterial groups and Salmonella to the overall bacterial community after 24h of in vitro fermentation of hydrolyzed cereal varieties, pectin and Tryptone Soya Broth (TSB) using pig feces as inoculum and co-inoculation of Salmonella enterica after 6h. Different superscripts (abcd) within a column indicate significant (P<0.05) differences.
cereal cultivar/ growth medium Total bacteria log copies/ml Cl. cluster XIVa % Cl. cluster IV % Cl. cluster I % Bacteroides % Lactobacilli % Enterobacteria % x 10-2 Salmonella % x 10-4 Hulless barleys SB90354 10.4a 39.5a 26.0cd 11.0a 7.6bc 0.2bc 2.7a 0.5cd SB90300 10.1ab 23.4b 35.6bc 12.1a 4.4d 0.3bc 1.3 0.6cd SR93139 10.1abc 28.2b 30.8bcd 10.5a 6.7bcd 0.2bc 0.4c 0.4cd CDC McGwire 10.3ab 23.1b 33.6bcd 9.3a 4.2d 0.2bc 0.4c 0.3d CDC Fibar 10.1ab 25.7b 37.2b 10.4a 8.7ab 0.2bc 0.3c 0.2d SH99250 10.3a 24.2b 24.8d 9.9a 5.3bcd 0.1c 0.2c 0.2d SB94893 10.2ab 26.4b 31.8bcd 11.4a 3.6d 0.2bc 0.3c 0.2d Common barleys
Mc Leod 10.1ab 24.6b 24.1d 10.0a 10.9a 0.2b 0.8bc 0.9bcd
AC Metcalfe 9.9bc 25.6b 40.4b 14.3a 5.7bcd 0.4b 0.4c 0.5cd
Oats
CDC Dancer 9.9bc 20.1b 39.4b 4.1b 8.3abc 0.3bc 1.2abc 1.6ab
CDC Sol-Fi 9.7c 24.4b 53.9a 5.2b 6.2bcd 1.0a 0.9bc 0.7cd CDC SO-I 9.8c 21.0b 57.3a 4.4b 8.3ab 0.6a 0.7c 1.2abc Oat groats CDC Dancer groats 10.2ab 26.7b 30.5bcd 2.1b 5.9bcd 0.4bc 1.1ab 0.8cd CDC Sol-Fi groats 9.9bc 28.3b 37.5b 3.5b 7.1bcd 0.4bc 0.7c 0.7cd CDC SO-I groats 10.1ab 25.8b 34.0bcd 3.2b 4.6cd 0.3bc 0.5c 0.4cd pectin 10.3a 41.1a 43.4a 2.5b 6.4bcd 0.2bc 0.6c 0.3d TSB 10.1ab 21.5b 30.1bcd 4.6b 3.7d 0.7a 1.6abc 0.7cd blank 9.7cd 19.4b 48.1a 10.5a 11.6a 0.8a 2.3a 2.0a SEM 0.042 29.661 43.486 8.054 5.322 0.038 0.009 0.000
Figure 1. Cluster analysis based on the relative TRF abundances in bacterial TRFLP profiles after 72h fermentation of 10 varieties of hulless barleys, 6 common barleys,
6 oats and 6 oat groats. The cluster was constructed based on Pearson correlation and
UPGMA algorithm using Statistica software. The scale bar represents the relative similarity of profiles.
Figure 2. Neighbour joining tree showing the phylogenetic relationships of partial 16S rRNA gene sequences obtained in the study. TRF peak numbers from TRFLP analysis are indicated behind the species name and refer to the RDA analysis in Figure 3.
Bacillus subtilis was used to root the tree. The bar indicates the calculated
Figure 3a-d. Redundancy analysis (RDA) of the effect of nutrient composition (
black arrows
) on response variables (dashed arrows) including in vitrofermentation characteristics (dDM, T1/2, Vf, lag t), dominant bacterial phylotypes (TRF
#, referring to species in Figure 2) and bacterial metabolite molar ratios (SCFA,
BCFA, acetate, propionate, butyrate). RDA was performed for all cereals together
(n=28, a), barleys only (n=16, b), oat and oat groats only (n=12, c), and hulless barleys only (n=10, d). Within the RDA analysis, the length, direction and the ankle between arrows are a direct measure of correlations between variables or variables and canonical axes (e.g. α = 0°/r = 1; α = 90°/r = 0; α = 180°/r = -1). Percentage values on axis 1 and 2 (e.g. 67.6% and 12.1% in Figure 3a) indicate the proportions of variability of data that are described with the respective canonical axis in the model. Significance of overall model and the effect of nutrients were tested using Monte Carlo permutation test (n=499)
Table S1. Chemical composition of cereal varieties
Name DM1 OM CP EE cellulose lignin starch amylose
amylo-pectin
β-glucan
NSP
total insoluble soluble
% g/kg g/kg g/kg g/kg g/kg g/kg % of total starch g/kg g/kg g/kg g/kg Hulless barleys SB 90354 90.5 984 161 25 21 6 604 27 73 77 117 52 66 SB 90300 90.7 983 174 23 25 6 604 26 74 46 93 40 53 CDC Rattan 90.6 979 164 33 20 5 534 10 91 87 123 57 66 SR 93139 91.0 982 179 31 19 6 544 11 89 112 132 47 85 CDC McGwire 90.4 983 152 28 29 6 589 26 74 60 77 54 23 CDC Fibar 91.0 981 197 35 25 12 525 7 93 127 153 52 101 SH 99250 90.9 979 177 19 31 08 495 39 61 91 114 57 58 SB 94893 91.4 977 183 21 46 11 507 46 54 87 125 89 36 SB 94917 92.3 975 178 26 45 14 519 10 90 93 149 81 68
HB393 91.2 979 193 26 31 10 488 10 90 86 91 59 32 Common barleys CDC Bold 92.3 975 141 16 68 21 598 28 72 47 119 93 26 CDC Dolly 90.4 973 154 16 50 12 559 28 72 59 172 98 74 McLeod 91.0 973 142 20 65 15 570 32 68 51 137 123 14 AC Metcalfe 90.4 976 141 23 59 17 582 28 72 53 151 74 77 CDC Cowboy 90.8 975 161 18 64 16 549 27 73 41 135 71 64 CDC Clyde 89.8 974 145 21 53 13 565 27 73 50 139 71 68 Oats CDC Dancer 91.4 963 156 51 115 37 459 24 76 30 166 142 23 Morgan 92.4 970 117 41 170 50 377 25 75 31 261 204 57 CDC ProFi 92.2 966 166 51 123 43 403 27 73 49 258 190 68 CDC Sol-Fi 91.5 963 186 40 157 59 345 23 77 38 215 184 31 HiFi 91.7 970 162 52 143 44 322 23 77 51 226 197 29
CDC SO-I 91.5 963 153 66 150 23 418 23 77 29 218 194 25 Oat groats CDC Dancer 90.9 981 195 54 17 9 597 24 76 48 132 76 56 Morgan 91.8 979 164 57 28 12 600 24 76 55 153 92 61 CDC ProFi 91.7 982 227 73 17 8 510 22 78 84 150 63 87 CDC Sol-Fi 90.8 981 255 58 17 11 533 22 78 68 148 45 104 HiFi 91.1 982 226 76 30 16 442 22 78 92 123 78 45 CDC SO-I 90.9 980 197 85 25 15 462 21 79 72 132 83 59
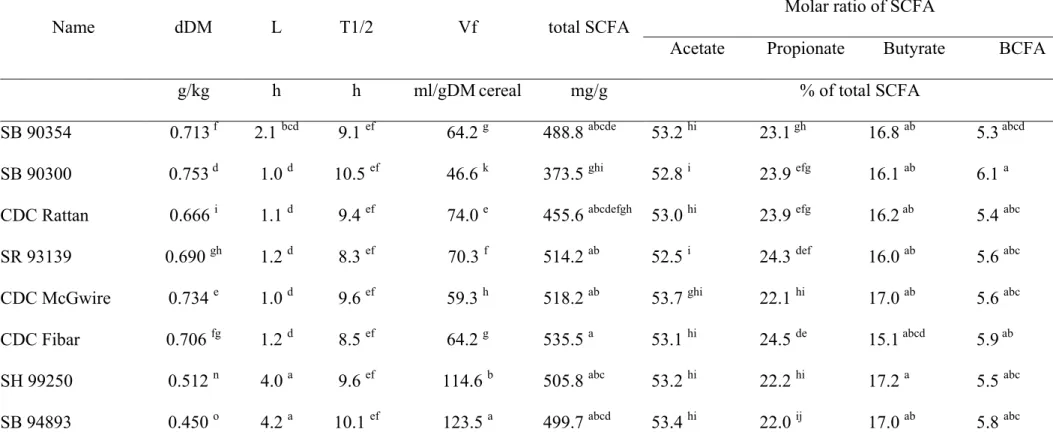
Table S2. Dry matter digestibility (dDM) during pepsin-pancreatin hydrolysis, in vitro gas production kinetics parameters (L, T1/2, Vf), total short-chain fatty acid (SCFA) production and molar ratios of individual SCFA after 72 h of in vitro fermentation with a fecal inoculum from growing pigs of the hydrolyzed residues of the different barley and oat varieties.
Name dDM L T1/2 Vf total SCFA
Molar ratio of SCFA
Acetate Propionate Butyrate BCFA
g/kg h h ml/gDM cereal mg/g % of total SCFA
SB 90354 0.713 f 2.1 bcd 9.1 ef 64.2 g 488.8 abcde 53.2 hi 23.1gh 16.8 ab 5.3 abcd
SB 90300 0.753 d 1.0 d 10.5 ef 46.6 k 373.5 ghi 52.8 i 23.9 efg 16.1 ab 6.1 a
CDC Rattan 0.666 i 1.1 d 9.4 ef 74.0 e 455.6 abcdefgh 53.0 hi 23.9 efg 16.2ab 5.4 abc
SR 93139 0.690 gh 1.2 d 8.3 ef 70.3 f 514.2 ab 52.5 i 24.3 def 16.0 ab 5.6 abc
CDC McGwire 0.734 e 1.0 d 9.6 ef 59.3 h 518.2 ab 53.7 ghi 22.1 hi 17.0 ab 5.6 abc
CDC Fibar 0.706 fg 1.2 d 8.5 ef 64.2 g 535.5 a 53.1 hi 24.5 de 15.1abcd 5.9 ab
SH 99250 0.512 n 4.0 a 9.6 ef 114.6 b 505.8 abc 53.2 hi 22.2 hi 17.2 a 5.5 abc
SB 94917 0.549 m 1.1 d 9.9 ef 94.3 c 413.3 defghi 53.3 hi 23.4 fg 16.5 ab 5.4 abc
HB393 0.697 gh 0.9 d 9.2 ef 62.3 g 473.0 abcdef 54.4 fghi 23.1 gh 15.3 abc 5.9 ab
CDC Bold 0.711 gf 1.0 d 10.5 ef 48.3 jk 368.9 hi 57.4e 22.1 hi 15.4 abc 4.1 f
CDC Dolly 0.696 fgh 1.4 cd 10.2 ef 55.4i 359.5 i 56.8 ef 22.1 hi 15.7 ab 4.2 f
McLeod 0.551 m 3.2 abc 10.5 ef 88.2 d 382.9 ghi 56.6ef 20.3 lm 16.9 ab 4.3 ef
AC Metcalfe 0.682 h 2.0 bcd 10.4 ef 57.3 hi 380.9 ghi 57.0 e 21.4 ijk 16.0 ab 4.1 f
CDC Cowboy 0.693 gh 1.6 cd 10.8 ef 51.2 j 354.9 i 57.2 e 21.8ij 14.9 bde 5.0 cde
CDC Clyde 0.651 i 2.3 bcd 10.8 ef 68.6 f 417.6 cdefghi 55.9 efg 22.1 hi 16.0 ab 4.6 def
CDC Dancer 0.689 h 0.7 d 17.3 c 24.5 mno 177.4 j 65.1 c 20.4 kl 10.9 ghij 2.8 gh
Morgan 0.593 l 0.7 d 20.5 b 27.5 m 147.8 j 68.2 b 19.1 n 10.1ij 2.0 h
CDC ProFi 0.669 i 1.0 d 11.6 e 32.6l 212.1 j 59.7 d 23.3g 12.0 fghi 4.2 ef
CDC Sol-Fi 0.628 jk 0.4 d 14.2 d 24.9 mno 130.9 j 64.8 c 20.7 jkl 10.7 hij 3.1 g
HiFi 0.619 k 0.1 d 19.3 b 25.2 mn 140.1 j 68.4 b 19.3 mn 9.7 jk 2.1 h
CDC Dancer 0.897 a 1.1 d 8.4 ef 19.3 p 437.9 bcdefghi 54.9 efghi 25.8 ab 13.1def 5.5 abc
Morgan 0.877 bc 1.1 d 9.1 ef 19.7 p 397.4 fghi 56.5 ef 24.6 cde 13.1 def 5.2 bcd
CDC ProFi 0.876 bc 1.1 d 8.1 f 24.6 mno 459.4 abcdefg 53.8 ghi 26.6 a 13.0 efg 5.7 abc
CDC Sol-Fi 0.879 bc 1.5 cd 8.0 f 23.0 nop 421.2 cdefghi 55.5 efgh 25.6 abc 12.6 fgh 5.7 abc
HiFi 0.863 c 1.4 cd 8.9 ef 21.1 op 364.5 i 56.7 ef 25.2 bcd 12.3 fgh 5.3 abcd
CDC SO-I 0.884 b 1.3 d 9.0 ef 21.8 nop 404.9 efghi 54.4 fghi 26.3 a 13.3 cdef 5.3 abcd
SEM 0.00667 0.13 0.54 2.86 13.0 0.575 0.227 0.290 0.147