Cuando creíamos que teníamos todas las respuestas, de pronto, cambiaron todas las preguntas. When we thought we had all the answers, suddenly, all the questions changed. Mario BENEDETTI
Acknowledgments
First of all, I would like to thank the Agence Nationale de la Recherche (ANR, France) for the financial support.
The initial quote is one of my favourite phrases, which reminds me of the continuity of change, a change that includes every aspect of life. Change has been one of the common denominators during this thesis project, combined with the need to adapt in order to continue. Thus, I express my eternal gratitude to my scientific partners and supervisors during this journey: Pierre, Patrice, Christel and Clémence, to whom I will always be grateful for the many meetings, and discussions, that guided me through these three years of hard and constant work, with its many turns and loops.
This journey also gave me the chance into continuing one of my passions: travelling. Visiting Taiwan to meet the partners of the project and working with them was the icing on the cake for a world-hungry person such as myself. Therefore, I thank all the professors and students from the Membrane and Research Center for Membrane Technology of the Chung Yuan Christian University in ChungLi for an unforgettable one and a half months of teachings and learning, particularly, to Prof. Lai, Prof. Chang, Assoc. Prof. Venault, Brian, Jason, and all the other students of the centre that were helping me daily.
Special thanks to the members of the jury: Prof. Rabiller-Baudry, Prof. Crespo, Dr. Brehant, and Prof. Chang, for reviewing my work and being present during the presentation. Your questions and comments were highly appreciated, and helped improving the quality of the work while adding future challenges to be solved. Merci beaucoup! Muito obrigada! Xie xie!
Je voudrais remercier spécialement à Corinne Routaboul du Service commun de spectroscopie infrarouge et Raman - Institut de Chimie de Toulouse - pour votre soutien pour la partie d’analyse de cartographie FTIR.
Je voudrais aussi remercier à tout l’équipe du Laboratoire de Génie Chimique à Toulouse, pour le soutien que j’ai reçu de tous pendant ces trois années. Particulierement à Sebastian Teychené, Nhat et Dmytro pour tout ce qui concerne la partie de préparation des puces microfluidiques.
companions on a very international trip since we arrived for our Erasmus Master five years ago –, Makarronis, Arturo I, Alessio, Joseph, Aurelie, Le, Zena, Nhat, Panwana, Waritha, Yandi, Mel G., Meredith, Aamir, Anto, Abi, Arthur II, Johanne, Christian, Flavie, Paul, Hugo, Veysi, Nayan, Shazia, Melissa, Audrey, Anaïs, Samir, Cécilia, Alexis, Florent, Yin, Airy, and Vincent. I hope I am not forgetting anybody, if not you can insert your name in the following blank lines:
. Thank you for being my emotional support during all of these years, because carrying on a project for so long does not come free of hurdles, and you made tough times easier and good ones much more enjoyable.
There are two particularly important students to whom I want to dedicate this paragraph: Maithili and Anja. They came from lands far far away and made an exceptional work that was utterly paramount for the fulfillment of this thesis. It was a pleasure working with you and being part of your first steps into research.
These lines go to my Erasmus Mundus family: five years ago we started a gipsy journey together, and even though distance separates us again, I feel like it does not have any effect on us. I hope we will have many more years of get-togethers, international weddings, and crazy trips.
Finalmente, y no menos importante, paso a dedicar unas palabras a mis primeros agentes de cambio: mi familia. A los que se han ido, a los que siguen y a los que han llegado: gracias por todo el apoyo que siempre me dieron, y por siempre darme ese empujón de energía transmitido a través del espacio-tiempo y contra toda ley natural o teoría científica.
i
Résumé
La pénurie d’eau est devenue un des problèmes clés à résoudre, et pour y faire face, il est nécessaire de disposer d’unités de traitement de l’eau efficaces. Au cours des dernières décennies la technologie des membranes est devenue l’une des techniques les plus prometteuses pour le traitement de l’eau. Néanmoins, les membranes ont une durée de vie limitée et sont, par ailleurs, sujettes à des phénomènes de colmatage - le dépôt, l’adsorption et l’absorption de particules dans la structure de la membrane -, ce qui réduit leur productivité, et augmente les coûts opérationnels. Une approche pour minimiser ce problème consiste à modifier des membranes hydrophobes, mécaniquement et chimiquement stables, en y greffant des matériaux amphiphiles afin de réduire le colmatage. L’objectif principal de ce travail est de caractériser les propriétés anti-colmatage des membranes de PVDF (Polyvinylidene fluoride) modifiées avec différents types de copolymères PS-PEGMA (Polystyrene – Poly(ethylene glycol) methacrylate), tout d’abord par l’utilisation de techniques classiques, puis, par le développement et / ou l’adaptation de techniques microfluidiques couplés à la microscopie à fluorescence et l’utilisation de la cartographie par microspectroscopie infrarouge à transformée de Fourier (IRTF). La cartographie IRTF a permis de quantifier localement le greffage et de mettre en évidence l’hétérogénéité du greffage sur la membrane. Ces cartes, représentant l’importance du greffage sur la membrane, ont par ailleurs été corrélées au dépôt de protéines sur la surface. Des systèmes microfluidiques ont également été développés pour caractériser sous microscope à fluorescence l’adsorption de protéines fluorescentes sur une membrane en présence d’un débit. Cette étude permet de suivre in situ et en dynamique l’adsorption (lors de cycles de filtration) et la désorption (lors de cycles de rinçage) de protéines sur la membrane. Ces mesures locales ont été mises en regard avec des mesures de permeabilité lors de cycles filtrations/rinçage mettant en évidence un rôle anti-fouling en particulier pour les copolymères tri-blocs ou pour les copolymères à enchaînement aléatoire.
Summary
Water scarcity has become one of the key issues to solve, and efficient water treatment is paramount to treat water sources. In recent decades membrane technology has become one of the promising solutions for water treatment. Nevertheless, membranes are prone to fouling phenomena - the deposition, adsorption, and absorption of particles in the membrane structure -, which hinders their life-span and productivity, and raise operative costs. One approach to minimize this issue is to modify the already mechanically and chemically stable hydrophobic membranes with amphiphilic materials. The main aim of this work is to characterise the anti-fouling properties of PVDF (Polyvinylidene fluoride) membranes modified with different types of PS-PEGMA (Polystyrene – Poly(ethylene glycol) methacrylate) copolymers, firstly by using classical techniques, and then, by developing and/or adapting new ones: microfluidic devices coupled with fluorescence microscopy, and the use of Fourier Transform Infrared microspectroscopy (FTIR mapping). FTIR mapping allowed the local detection of the coating layer and showed its heterogeneous distribution on the surface of the membrane. These maps, that represent the importance of the coating on the membrane, were correlated with the deposit of proteins on the surface. Microfluidic systems were also developed to characterise the adsorption of fluorescent proteins on the membrane under a fluorescent microscope in the presence of a flow. This study allowed the in-situ and dynamic follow-up of the adsorption – during filtration cycles – and of the desorption – during rinsing cycles – of the proteins on the membrane. These local measurements were compared against permeability measurements during the filtration/rinsing cycles evidencing the anti-fouling role of the copolymers used for the modification of the membranes, particularly for the triblock and random copolymers.
Contents
List of Figures ix
List of Tables xv
List of Abbreviations xvii
1 General Introduction 1
1 A summary on water and crisis . . . 3
2 Membrane technology for water treatment . . . 5
2.1 Membrane processes . . . 7
2.2 Membrane materials . . . 8
2.2.1 Polymeric membranes . . . 9
3 Membrane fouling . . . 11
3.1 Foulants and types of fouling . . . 12
3.2 Factors that affect fouling phenomena . . . 13
3.2.1 Hydrophilicity . . . 13
3.2.2 Roughness . . . 14
3.2.3 Charge . . . 15
3.2.4 Steric hindrance/repulsion . . . 15
4 Management of fouling for membrane filtration processes -Membrane modification . . . 17
5 Techniques for the characterisation of the modification of membranes
and of their anti-fouling properties . . . 21
6 Presentation of the SuperNAM project . . . 25
7 Objectives . . . 26
8 References . . . 27
2 Membrane modification and anti-fouling properties assessment 37 1 Introduction . . . 39
1.1 Membrane modification with PS-PEGMA copolymers . . . 39
1.2 Characterisation methods . . . 41
1.3 Objectives . . . 42
2 Materials and Methods . . . 44
2.1 Materials . . . 44
2.2 Methods . . . 45
2.2.1 Coating of the membranes . . . 45
2.2.2 Determination of the coating density . . . 45
2.2.3 Water contact angle . . . 46
2.2.4 Hydration capacity . . . 46
2.2.5 XPS . . . 46
2.2.6 Protein adsorption . . . 48
2.2.7 Blood cell adsorption . . . 48
2.2.8 Filtration protocol . . . 49
2.2.9 Analysis of fouling - Resistances in series . . . . 51
3 Results and Discussion . . . 54
3.1 Physical and chemical properties of the modified membranes 54 3.1.1 Coating density . . . 55
3.1.2 Water contact angle and hydration capacity . . . . 58
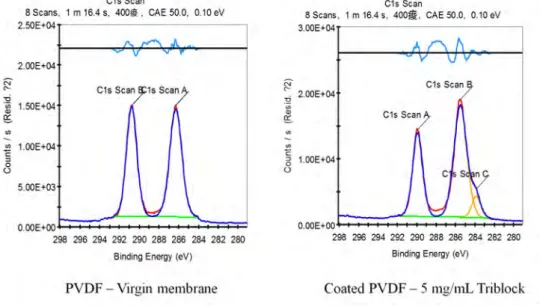
3.1.3 X-ray photoelectron spectroscopy (XPS) . . . 60
3.2 General biofouling tests . . . 62
3.2.1 Adsorption of proteins . . . 63
3.2.2 Adsorption of blood cells . . . 65
3.3 Filtration tests . . . 69
v
3.5 General discussion . . . 73
4 Conclusions . . . 77
5 References . . . 79
3 Coupling of microfluidic chips with fluorescence microscopy for the study of fouling 81 1 Introduction . . . 83 1.1 Objectives . . . 85 2 Methodology . . . 86 2.1 Materials . . . 86 2.2 Chip fabrication . . . 87 2.3 Filtration protocol . . . 89
2.4 Image analysis protocol . . . 93
2.5 Calculations . . . 93
3 Results and Discussion . . . 96
3.1 Comparison of fluxes in the microchip with dead-end filtration 96 3.2 Coupling of filtration and fluorescence data . . . 99
4 Conclusions . . . 109
5 References . . . 111
4 FTIR mapping for the study of coating and fouling 113 1 Introduction . . . 115
1.1 Objectives . . . 117
2 Materials and Methods . . . 119
2.1 Materials . . . 119 2.2 Methods . . . 120 2.2.1 Membrane casting . . . 120 2.2.2 Coating . . . 120 2.2.3 BSA adsorption . . . 120 2.2.4 Contact Angle . . . 121 2.2.5 Coating density . . . 121 2.2.6 FTIR mapping . . . 122
3.1 Measurement of the average grey value . . . 124
3.2 Analysis of heterogeneity - Methodology for the definition of coating and adsorption levels . . . 125
4 Results and Discussion . . . 127
4.1 Variation of copolymer concentration in coating solution . . 127
4.2 Variation of coating time . . . 135
5 Conclusions . . . 142
6 References . . . 143
5 Filtration-rinsing cycles for the assessment of fouling reversibility 147 1 Introduction . . . 149
1.1 Objectives . . . 149
2 Materials and Methods . . . 151
2.1 Materials . . . 151
2.2 Methods . . . 151
2.2.1 Coating of the membranes . . . 151
2.2.2 Water contact angle . . . 152
2.2.3 FTIR analysis . . . 152
2.2.4 Filtration protocol . . . 153
2.2.5 Detection of BSA . . . 155
3 Results and Discussion . . . 157
3.1 Characterisation of the membranes . . . 157
3.2 Evaluation of the coating time in the filtration performance of the membranes . . . 161
4 Conclusions . . . 171
5 References . . . 173
6 General conclusions and perspectives 175 References . . . 181
Appendix 183
A Supplementary material on the characterisation of the modified
vii
1 Scanning electron microscopy (SEM) and Atomic force microscopy (AFM) . . . 187 2 Confocal images of the WBC and PRP for the modified membranes 191 B Supplementary information on the selection of the peaks of interest 193
List of Figures
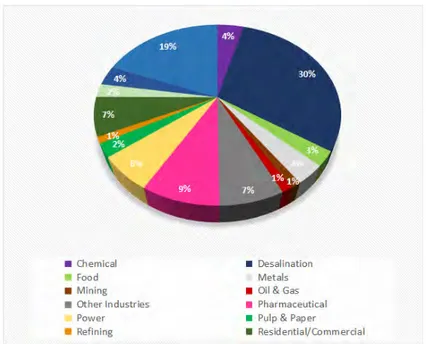
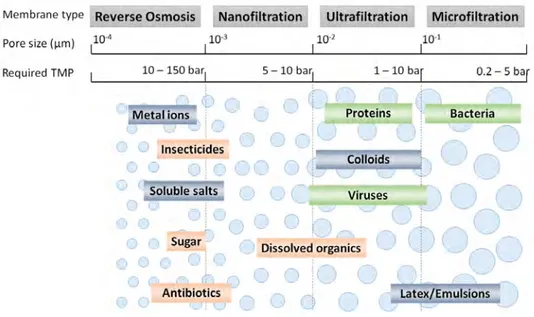
1.1 World market sales distribution for membranes and membrane equipment per market segment. Adapted from [14] . . . 6 1.2 Example of membrane processes . . . 6 1.3 Pressure-driven membrane processes: pore sizes, TMP, and particle
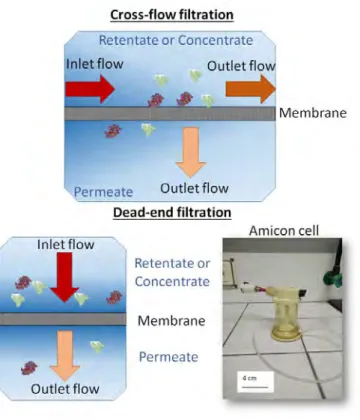
size ranges . . . 8 1.4 Diagram for the different operation modes: cross-flow and dead-end
filtration . . . 9 1.5 Structure of the PVDF molecule . . . 10 1.6 Diagram of the factors that affect fouling phenomena . . . 13 1.7 FTIR technique. (A): Schematics on the stretching of the bonds when
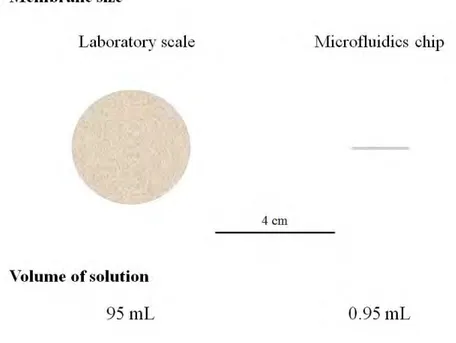
irradiated with a beam and the generation of the subsequent spectra. (B): Regions of the spectrum where the concerned bonds typically absorb (taken from [69]) . . . 22 1.8 Comparison of membrane area and filtration volumes necessary for
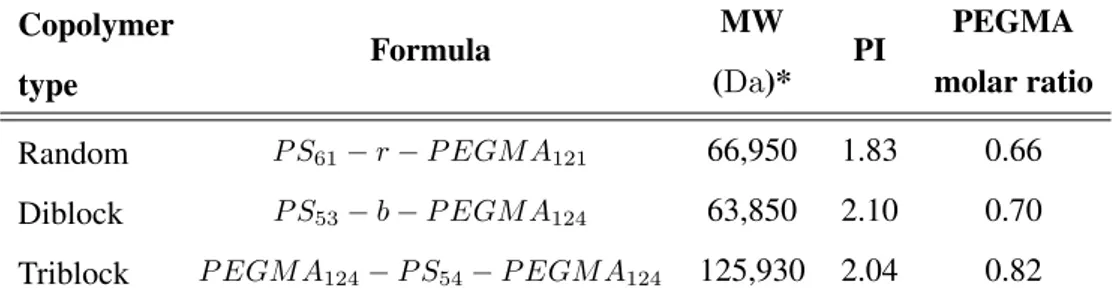
a typical laboratory-scale filtration device (left) and a membrane inserted inside a microfluidic device (right) . . . 24 2.1 Chemical structure of the PS-PEGMA copolymers [1, 2] . . . 39 2.2 Diagram of the structure of the copolymers used in this work . . . . 40 2.3 Example of the variation of the peaks for the C1s spectrum . . . 47 2.4 Diagram of the protocol for the filtration . . . 50
2.5 Illustration of the parameters taken into account to calculate the reversibility index . . . 51 2.6 General chart on the results for this chapter . . . 54 2.7 Calculated coating density for the diblock, random and triblock
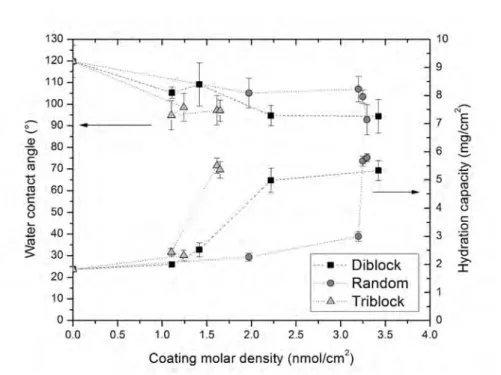
copolymers as a function of copolymer concentration in the coating solution. Top: coating density in mg/cm2, bottom: molar coating density in nmol/cm2 . . . 56 2.8 Water contact angle and Hydration capacity for the diblock, random
and triblock copolymers as a function of molar coating density . . . 59 2.9 Water contact angle as a function of Hydration capacity for the
diblock, random and triblock copolymers . . . 61 2.10 Evolution of copolymer present on the membrane surface for the
different copolymers as a function of molar coating density, calculated from XPS data . . . 63 2.11 Protein adsorption as a function of the molar coating density for the
diblock, random, and triblock copolymers. Top: Adsorption of BSA; bottom: adsorption of LYZ . . . 64 2.12 Example of confocal microscopy images of RBC for the membranes
coated with different concentrations of copolymers . . . 66 2.13 Blood cell count of RBC, WBC, and PRP for the membranes coated
with different concentrations of copolymers as a function of molar density. Top: RBC; middle: WBC, and bottom: PRP . . . 68 2.14 Filtration tests for the unmodified and modified membranes. Top:
Permeabilities vs. time; bottom: relative fluxes vs. time . . . 71 2.15 Relationship between protein adsorption and hydration capacity.
Top: BSA adsorption; bottom: LYZ adsorption . . . 75
3.1 Comparison of an Amicon filtration cell with a microfluidics chip . 83 3.2 Schematic representation of the fabrication process of the
xi
3.3 Microfluidic chip. (A) Design of the different layers: 1-retentate, 2-membrane and 3-permeate; (B) 3D diagrams of the layers and chip assembly; and (C) real chip. Each chip has two membranes with two channel per membrane. One channel (blue) has a length, height, and width of 2 cm, 300 µm, and 630 µm, respectively . . . 89 3.4 Diagram of the equipment used in combination with the microfluidic
chip . . . 90 3.5 Protocol of the filtration performed with the microfluidic chips . . . 92 3.6 Image analysis. A: Diagram of the measurement of the GV at
different positions of the channel; B: Diagram of the measurement of the GV for the whole channel; and C: Grey value scale for an 8-bit image . . . 93 3.7 Permeabilities obtained for the microchip vs Amicon cell for the
unmodified membrane (virgin - upper graph) and membranes modified with 5 mg/mL triblock copolymer for two hours (lower graph) . . . 97 3.8 Images of the channels taken at different points of the filtration
experiments of the unmodified membrane (virgin - upper images) and membranes modified with 5 mg/mL triblock copolymer for two hours (lower images) . . . 100 3.9 Measured average grey values at different sites of the channel for the
unmodified membrane (virgin) and membranes modified with random and triblock copolymer . . . 101 3.10 Image of the channel at the end of the second BSA filtration for the
membrane modified with the random copolymer . . . 102 3.11 Evolution of the measured average grey values for the whole
channel and the permeability of the membranes for the unmodified membrane (virgin) and membranes modified with the random and triblock copolymer . . . 103 3.12 Permeability and Relative permeability versus average grey value
during the filtration of BSA for the unmodified membrane (virgin) and membranes modified with the random and triblock copolymer . 105
3.13 Evolution of the flux and grey value indexes after each filtration/rinsing cycle for the experiments performed in the microfluidic chips. FDR ratio was calculated by dividing the
F DRf luxby the F DRGV . . . 107
4.1 Sample spectra of a coated and fouled membrane with additional information on the peaks of interest, functional groups related to them and to the compounds present in our study . . . 123 4.2 Colour (up) and grey (down) scale bars for peak heights between 0.0
and 0.5 . . . 124 4.3 Example of FTIR maps obtained for membranes modified with the
random copolymer at different concentrations. Each map has an area of 1 mm2 . . . 128 4.4 Example of FTIR maps obtained for membranes modified with the
diblock copolymer at different concentrations. Each map has an area of 1 mm2 . . . 129 4.5 Image of the membrane surface modified with the random
copolymer and incubated with 1 g/L BSA solution. Virgin membrane (upper left) and modified with copolymer solution concentration of 1 mg/mL (upper right), 5 mg/mL (lower right), and 10 mg/mL (lower left). The mesh is a consequence of the images taken by the microscope to determine the subsequent surface to be analysed by the FTIR microspectrometer . . . 130 4.6 Average peak height of the 1737 cm−1 and 3300 cm−1 peaks as a
function of random (RND) and diblock (DB) copolymer concentration 131 4.7 Evolution of the foulant adsorbed as a function of the copolymer
presence for the different coating concentrations . . . 132 4.8 Coverage and adsorption levels for the membranes modified with
different random copolymer concentrations and a coating time of 2 h 133 4.9 Coverage and adsorption levels for the membranes modified with
xiii
4.10 Measured area percentages for the different coverage and adsorption levels as a function of copolymer concentration. (A) and (B): Random copolymer; (C) and (D): Diblock copolymer . . . 135 4.11 Water contact angle and average coating densities as a function of
coating time. Coating solution: 5 mg of random copolymer per mL of ethanol . . . 136 4.12 Example of FTIR maps obtained for membranes modified with the
random copolymer at different coating times while keeping the copolymer concentration at 5 mg/mL. Each map has an area of 1 mm2137 4.13 Average peak height of the 1737 cm−1 and 3300 cm−1 peaks as a
function of coating time for the random and diblock copolymers . . 138 4.14 Evolution of the foulant adsorbed as a function of the copolymer
presence for the different coating times and copolymers . . . 139 4.15 Measured area percentages for the different coverage and adsorption
levels as a function of coating time. (A) and (B): Random copolymer; (C) and (D): Diblock copolymer . . . 140 5.1 Diagram of the protocol for the filtration-rinsing cycles . . . 154 5.2 Variation of the water contact angle and peak height ratio with
coating time for the membranes modified with 5 mg/mL of diblock, random, and triblock copolymer solutions. For the peak height ratio table: standard deviations of the measurements are presented inside the brackets) . . . 158 5.3 Variation of the water contact angle with relative peak height for the
coating times of 2 and 4 hours for the membranes modified with 5 mg/mL of diblock, random, and triblock copolymer solutions. The peak heights were determined by ATR-FTIR . . . 159 5.4 FEG-SEM images of the unmodified membranes and modified with
5 mg/mL random copolymer solution for 4 and 6 hours. The scale bars for the x20k and x50k magnifications correspond to 1 µm and 100 nm, respectively. The images were taken with a Schottky Field Emission Scanning Electron Microscope (JEOL SEM-FEG JSM7800F); samples were metallised with gold . . . 160
5.5 Evolution of the permeability with time for the unmodified membranes and modified with 5 mg/mL random, triblock, and diblock copolymer solution for 2, 4 and 6 hours . . . 162 5.6 PBS and BSA permeabilities vs. coating time for the unmodified
membranes and modified with 5 mg/mL random, triblock, and diblock copolymer solution . . . 164 5.7 FTIR maps of the retentate and permeate sides for the unmodified
membranes and modified with 5 mg/mL random copolymer solution for 2 h and 6 h. The maps were acquired for the membranes used on the filtration-rinsing experiments once the filtration protocol was performed. For the virgin membranes the size of the images are of 400 µm by 400 µm, while for the rest of the maps the size is of 500 µm by 500 µm . . . 167 5.8 Diagram of the copolymers adsorbed on the surface of the membrane:
(A) side view, (B) upper view . . . 169 A.1 Scanning electron microscopy images of the unmodified and
modified membranes . . . 187 A.2 Atomic force spectroscopy of the surface of the membranes and
rugosity values. Each image was taken for an area of 10 × 10 µm . . 188 A.3 Confocal microscopy images of WBC for the membranes coated with
different concentrations of copolymers . . . 191 A.4 Confocal microscopy images of PRP for the membranes coated with
different concentrations of copolymers . . . 192 B.1 ATR and external reflection spectra taken with the same equipment
used in the experiments for unmodified and modified membranes, with and without adsorption of BSA . . . 195 B.2 BSA adsorbed on a PVDF membrane at different times. From left to
List of Tables
1.1 Summary of membrane modification performed by researchers . . . 18
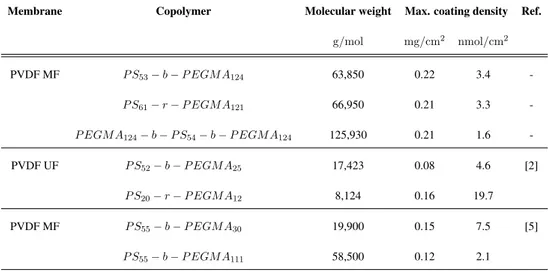
2.1 Copolymers used for the modification of the membrane . . . 44 2.2 XPS C1s scan: peaks of interest and their associated bonds [4] . . . 47 2.3 Blood cells: types and dimensions . . . 49 2.4 Maximum coating density for PS-PEGMA copolymers obtained in
this work and others . . . 57 2.5 XPS results. Survey scan, C1s and O1s scans . . . 62 2.6 Summary of registered fluxes and calculated indexes for the modified
membranes . . . 72 2.7 Summary of calculated resistances for the modified membranes . . . 73
3.1 Comparison of initial permeabilities between filtrations performed with the microchip (TMP=0.1 bar) and Amicon cells (TMP=2 bar) . 98 4.1 Copolymers used for the modification of the membrane . . . 119 4.2 Maximum grey values and calculated peak heights for the different
experimental set-ups . . . 125 4.3 Definition of coating and adsorption levels. The numbers represent
5.1 Main permeability values and calculated indexes for the membranes modified with 5 mg/mL of random, triblock or diblock copolymer solutions and different coating times . . . 166
List of Abbreviations
AFM Atomic force microscopy.
ATR Attenuated total reflectance.
B.E. Binding energy.
BSA Bovine serum albumin.
ED Electrodialysis.
FDR Flux decline ratio.
FEG Field emission gun.
FITC Fluorescein isothiocyanate.
FRR Fouling reversibility ratio.
FTIR Fourier transform infrared spectroscopy.
GV Grey value.
LIPS Liquid induced phase separation.
LYZ Lysozyme.
MF Microfiltration.
NF Nanofiltration.
NMP N-Methyl-2-pyrrolidone.
NOA 68 Norland optical adhesive 68.
NOM Natural organic matter.
PA Polyamide.
PBS Phosphate buffer saline.
PDMS Polydimethylsiloxane.
PEGMA Poly(ethylene gycol) methacrylate. PEGMA-b-PS-b-PEGMA Triblock copolymer.
PES Polyethersulfone.
PI Polydispersity index.
pI Isoelectric point.
PP Polypropylene.
PRP Platelet-rich plasma, thrombocytes.
PS Polystyrene.
PS-b-PEGMA Diblock copolymer.
PSf Polysulfone.
PS-r-PEGMA Random copolymer.
PTFE Polytetrafluoroethylene.
PVDF Polyvinylidene fluoride.
RBC Red blood cells, erythrocytes.
RI Reversibility index.
RMS Root mean square.
RO Reverse osmosis.
SEM Scanning electron microscopy.
TIPS Temperature induced phase separation.
xix
UF Ultrafiltration.
VIPS Vapour induced phase separation.
WBC White blood cells, leukocytes.
WCA Water contact angle.
1 A summary on water and crisis 3
Introduction
1
A summary on water and crisis
It is not possible to imagine life on earth without water. Animals, plants, microorganisms and needless to say human beings need water for their development. The total volume of water on Earth is estimated to be 1400 million km3, but only 35 km3 represent fresh water sources (2.5 % of the total volume); approximately 30 % of which is groundwater, 0.3 % accounts for freshwater in lakes and rivers and 70 % of fresh water sources are located in ice and snow in mountainous regions [1]. It is estimated that for 2025, 1800 million people will be living in countries or regions with absolute water scarcity and another two thirds of the population will be living in regions under water-stressed conditions [2].
Water is used domestically, in agriculture and industry. Worldwide water demand for agriculture represents around 70 % of the total water withdrawn, while industrial activity consumes 20 % and the water use in households is only 10 % of total water withdrawals [3].
The benefits for caring about our water sources and ultimately evaluating the treatment of water courses for obtaining drinking water or of industrial and domestic effluents before the re-disposition on rivers and oceans also leads to economic benefits. Polluted water ultimately affects governmental and industrial budgets: several studies and reports inform about the economic costs of polluted water in the public health, agriculture and industrial domains, due to the decrease of working days, costs in the health sector, compensations for crop losses due to pathogenic microorganism outbreaks and millions of euros lost on food and beverage production [4–6].
All of these issues highlight the importance of water at every imaginable level. With the shrinking of potable water resources, population growth, uncertainty of water availability due to climate change and human-commodities production, the approach of water usage has to evolve and involve solutions such as disinfection, decontamination, re-use and/or desalination of water [7]. Therefore, water treatment technology has to be developed accordingly to the needs and environmental dispositions.
Classical water treatment technologies involve different treatment steps depending on the origin, use, contamination type and levels. Typical water treatment
Introduction
steps for drinking water production can be screening, flocculation, coagulation, sedimentation, flotation, sand filtration, disinfection, sludge treatment, water softening, pH adjustment, fluorination [8]. Wastewater treatment is classically divided in four treatment categories. The preliminary treatment involves the removal of large contaminants by means of screening. Afterwards wastewater goes under the primary treatment, in which the objective is the physical removal of smaller particles by a primary sedimentation and no chemicals are used. In the secondary treatment, contaminants are removed by chemical or biological means such as oxidation of organic matter, nitrification and secondary sedimentation. Finally, the tertiary treatment takes place where the finalising treatments take place and it is also known as effluent polishing, eliminating contaminants that secondary treatment could not accomplish.
Membrane filtration technology is a perfect complement for water treatment facilities, either by replacing one or more treatment steps, by improving the quality of water since less coagulants would be used, or by supplementing water purification steps when needed (for example on the tertiary treatment, purification of water for electronics use).
2 Membrane technology for water treatment 5
Introduction
2
Membrane technology for water treatment
Membranes play an important role in all of the living organisms on Earth. They could be considered the essence of individual life since they separate organelles, enzymes, proteins, and regulate the passage of nutrients for all living beings; without them no living organism can thrive.
The production and study of synthetic membranes started in the beginning of the 1900s with studies carried out by Bechhold [9] and then continued by Brown [10, 11] in the 1910s. The commercial applications of such membranes systems were limited and it was not until the 1960s that up-scaled commercially interesting desalination membrane systems were possible to produce due to the work of Loeb and Sourirajan [12] on asymmetric membranes. This work is considered the milestone for the modern membrane technology systems and its future applications which also led to further develop ultrafiltration and microfiltration technologies. Industrial membranes for gas separation were developed in the 1980’s, particularly for hydrogen and nitrogen separation from air and carbon dioxide separation from natural gas [13].
Since then, membranes have been gaining terrain in water treatment, biotechnological and medicine fields. Reverse osmosis (RO), Ultrafiltration (UF) and Microfiltration (MF) membrane and membrane equipment sales for 2014 went from estimated sales of 7500 millione to a predicted market size of 11 000 million e according to McIlvane Company [14]. Figure 1.1 shows the sales distribution among the different market segments.
Introduction
Figure 1.1: World market sales distribution for membranes and membrane equipment per market segment. Adapted from [14].
Water, wastewater and desalination application combined account for more than 50 % of the sales market.
What are exactly membranes? They can be defined as a barrier between two separate compartments and will allow or not the selective passage of compounds based on their molecular size, chemical and/or electrochemical properties. This passage is boosted by a driving force. Driving forces are varied and they include differences in temperature, pressure, osmotic pressure, concentration and electric potential. A general diagram of this process can be seen in the following figure (Figure 1.2).
2 Membrane technology for water treatment
2.1 Membrane processes 7
Introduction
Membrane technology allows the separation of components at low temperatures – or lower than the equivalent chemical process-, with little or no use of foreign solvents. Besides, the separation is usually performed without involving a change of state, which would be the case for other separation technologies, i.e., distillation or precipitation. Therefore, energy costs can be lowered and high-quality products can be achieved. Moreover, membrane modules are easily scalable and allow the advanced treatment of water and other fluids covering less area than other technologies available. Some of the disadvantages of membranes are the membrane costs, fouling of the membrane, membrane handling, cleaning, and membrane selectivity- to achieve higher selectivities there is usually a compromise in flux.
2.1 Membrane processes
Membrane processes can be classified in different categories, such as by driving force.
Pressure-driven processes are usually divided into four categories: Microfiltration (MF), Ultrafiltration (UF), Nanofiltration (NF) and Reverse osmosis (RO). Figure 1.3 gives more information on these processes, particularly on approximate pore size of the membranes used on each application, required Trans membrane pressure (TMP), and some examples on particle sizes.
Dialysis is a typical membrane process in which the driving force is the concentration difference between two compartments and the diffusion of the concentrated solute will take place from the most to the least concentrated side. Electric potential differences are the main driving forces for Electrodialysis (ED) and electrodeionization procedures. Other membrane processes include pervaporation, membrane distillation and membrane crystallization.
Pressure-driven membrane processes described above plus ED constitute the main industrial applications for membranes as for today.
Membranes are produced as flat sheets, hollow fibres or capillaries, and are arranged into membrane modules to achieve higher filtration areas in a single equipment.
There are two basic operation modes for filtration: dead-end filtration and cross-flow filtration. For the first one the feed stream is perpendicularly fed on the
Introduction
Figure 1.3: Pressure-driven membrane processes: pore sizes, TMP, and particle size ranges.
membrane while for other method the feed is passed parallel to the membrane surface (see Figure 1.4). In this case, the feed is separated into concentrate (or retentate) and permeate (or filtrate) streams. Fouling is usually less prominent for cross-flow filtration systems.
2.2 Membrane materials
Membranes can be classified as organic or inorganic – polymeric or ceramic, respectively. The main polymers constituting the organic membranes include cellulose acetate, Polyamide (PA), Polysulfone (PSf), Polyethersulfone (PES), Polyvinylidene fluoride (PVDF), and Polypropylene (PP). Polymeric membranes are relatively cheap and easy to produce. However, they tend to be more sensitive against chemicals, pH conditions, or high temperature ranges [15]. On the other hand, inorganic membranes have high mechanical strength and can withstand a wide variety and range of operating conditions. Main materials used are alumina, zirconia and borosilicate glass. Some of the disadvantages of these membranes are the price, their brittleness and the availability is generally limited for UF or MF applications.
2 Membrane technology for water treatment
2.2 Membrane materials 9
Introduction
Figure 1.4: Diagram for the different operation modes: cross-flow and dead-end filtration.
2.2.1 Polymeric membranes
Polymeric membranes can be made out of hydrophilic or hydrophobic materials. Hydrophilic ones include cellulose esters, PSf and PES, while hydrophobic polymers used for membrane applications are PTFE, PVDF, and PP.
The selection of which polymer will be more suitable depends on the application that is needed, the characteristics of the feed stream, pH conditions it has to withstand, cleaning protocols, and sterilisation needs. Nowadays, polymers are also modified with other chemical compounds in order to combine their properties so as to yield a more resistant membrane for the desired application.
Polyvinylidene fluoride (PVDF) is a fluoropolymer, as such it is a very interesting type of material for membrane preparation due to its properties: high thermal stability, chemical resistance and low surface tension. PVDF can be produced as a membrane through a wide variety of techniques, and phase separation methods are the most used commercially [16]. Figure 1.5 shows the structure of
Introduction
PvDF which contains 59.4 wt% fluorine and 3 wt% hydrogen [17].
Figure 1.5: Structure of the PVDF molecule.
This semicrystalline polymer can be found in at least four phases: α (the most common), β, γ and δ, and the degree of crystallinity can vary between 35 % to 70 % [18]. Although PVDF is considered thermally stable, it has been shown that it can show degradation – loss of hydrogen fluoride – at high temperatures in vacuum [19]. Its chemical stability is very good, being stable against most chemicals, specially halogens and oxidants, inorganic acids and aliphatic, aromatic and chlorinated solvents; although special care has to be taken when PVDF membranes are in contact with strong base solutions, esters and ketones [18]. PVDF membranes can be prepared by different methods including phase inversion, sintering, track etching and others. Phase inversion methods used for PVDF membrane casting include Temperature induced phase separation (TIPS), Vapour induced phase separation (VIPS), and Liquid induced phase separation (LIPS). For each one of these methods careful control of solvents, evaporation time, room temperature, coagulation bath type and temperature, humidity and other added chemicals have to be taken care of for the reproducibility of the prepared membranes to be ensured.
Due to its hydrophobicity PVDF is prone to fouling. Thus, to avoid this problem more hydrophilic modified PVDF membranes are produced. Some examples include the increase in hydrophilicity by adding polyvinyl pyrrolidone (PVP) or cellulosic materials [20, 21].
3 Membrane fouling 11
Introduction
3
Membrane fouling
Fouling is a phenomena that affects membrane performance and ultimately its longevity. It occurs when particles start being deposited onto the membrane surface and into its pores while carrying out the filtration process. It depends in numerous factors involving membrane properties – chemical composition, surface rugosity, pore size, charge -, effluent composition and properties, and operating conditions – pre-treatment, flow rate, transmembrane pressure, temperature. Metastability of fluids is also a factor to consider, since changes in systems conditions could lead to their destabilization and cause a “slow fouling” phenomenon [22]. The convective flow of a solution that passes through the membrane – permeate – can be generally described as follows:
JV = ∆p − ∆π
η ∗ R (1.1)
Where JV is the convective flux density in m3m−2s−1, ∆p and ∆π represent the pressure and osmotic pressure difference respectively (in Pa), η is the dynamic viscosity of the fluid that passes through the membrane (in Pa s), and R refers to the resistance (in m−1). When a stream of pure water is being filtered, the resistance to passage is only attributed to the membrane, but when a complex solution is being treated additional resistances are created due to the concentration polarization and solute deposition onto and/or into the membrane. Thus, if the pressure difference is kept constant, fouling will affect the flux by decreasing it with time, and if the flux is kept constant the pressure difference will increase in time.
Fouling is not to be considered a static phenomenon; it is a dynamic event in which particles deposit onto the membrane, which will also interact with other particles in the surroundings, being desorbed or re-adsorbed and interact with pore structures depending on their size and chemical characteristics [23, 24].
The extent of fouling determines which type of cleaning procedure can be done to try to reach the previous permeate flux levels. For reversible fouling the permeate flux can be restored by means of a physical washing protocol or eventually by a soft chemical cleaning protocol. When flux is no longer recovered by these means irreversible fouling has occurred. Chemisorption and pore blockage are extremely
Introduction
difficult to overcome, thus extensive chemical cleaning or membrane replacement are necessary [25].
Although the ideal situation would be to attain zero-fouling conditions, it will probably never be achieved. It is definitely possible to lower fouling by different ways: effluent pretreatment, appropriate selection of operating conditions, membrane module design, membrane modification and cleaning. Each of these solutions involve a deep understanding of the system and more importantly of the fouling phenomenon involved.
Last but not least, fouling constitutes a big – if not the biggest – problem for membrane processes, due to the added pretreatment, cleaning, membrane replacement and power costs.
3.1 Foulants and types of fouling
Fluids that are intended to be purified with a membrane system will in fact contain different types of compounds that will cause membrane fouling. They are usually classified as particulates, organic, inorganic and microbiological organisms. Among organic foulants it is possible to find humic substances, proteins, and other hydrophobic and hydrophilic compounds; while inorganic foulants are considered to be metal ions and metal oxides that precipitate due to pH change or oxidation.
The extent of the organic fouling due to proteins depends on pH, ionic strength, and temperature of the fluid. Proteins can also attach to the membrane and start changing their conformation depending on the time they are in contact with the surface [26].
Microbiological foulants are the ones responsible for the biofouling phenomenon, when microorganisms attach to the membrane and form biofilms. The presence of other foulants - particularly the organic ones - can enhance this type of fouling.
Fouling can occur due to pore blocking, cake formation, concentration polarization, organic adsorption, inorganic precipitation and biological fouling [25, 27]. Each one of these phenomena will add an extra resistance against fluid flow through the membrane.
Fouling caused by cake formation could be considered to be reversible for microfiltration and ultrafiltration processes, and is weakly dependent on membrane
3 Membrane fouling
3.2 Factors that affect fouling phenomena 13
Introduction
surface characteristics, while irreversible fouling is highly dependent on surface chemistry [28].
In this work, we will consider reversible fouling as the particles and colloids that can be removed by rinsing at room temperature, while irreversible fouling will be when harsher cleaning protocols have to take place, with the use of chemicals and higher temperatures. The success of the rinsing or cleaning protocol can be assessed by comparing the initial flux, and the recovered flux after the filtration and rinsing/cleaning protocol are performed. When rinsing protocols are done, the reversibility of the fouling can be assessed.
3.2 Factors that affect fouling phenomena
In order to try to minimise fouling, it is necessary to know which factors can affect it, particularly with the one concerning the membrane material. How these factors interact with each other and with the foulants will affect how reversible the fouling will be. The following figure depicts some of the factors that affect fouling phenomena that will be explained in the lines below (Figure 1.6).
Figure 1.6: Diagram of the factors that affect fouling phenomena.
3.2.1 Hydrophilicity
There seems to be a general consensus among membrane researchers that fouling would be largely avoided by modifying the surface of the membrane in a way of making it more hydrophilic. Most of the organic and biological compounds –
Introduction
proteins, humic substances, bacteria - exhibit mostly hydrophobic characteristics, thus it is reasonable to believe that by achieving “water-loving” surfaces on “super-strong” hydrophobic materials the anti-fouling properties of a membranes would be greatly improved. Several groups have reached some degree of surface hydrophilization [29–33]. Nevertheless, some works show that hydrophobic surfaces could be less fouled than hydrophilic ones [34]. In this particular case, polyethersulfone (PES) membranes were prepared with the addition of amphiphatic macromolecules, and filtration tests were performed with humic acids. The authors found that with an increase of hydrophobicity - more modifying agent present in the membrane -, the deposition of the foulants decreased.
Water contact angle measurement is used to assess hydrophilicity; a decrease in water contact angle is considered to indicate an increase in the hydrophilicity of the surface. The measurements are easy to obtain and process. Nevertheless, changes or differences in pore size, surface roughness, surface patterns, porosity and pore size distribution, will also affect contact angle measurements [35], which makes it a difficult parameter for comparison purposes in spite of its easy measurement protocol. Another approach of trying to understand foulant interactions with membranes in a wider sense is through force analysis. Atomic force microscopy (AFM) using colloid probes is a useful tool for measuring the surface-particle interactions. Basically, the force of particles that are attached to the cantilever tip are measured while they are approaching the membrane surface on a liquid media [36–40]. This technique, while highly efficient, requires an experienced technician and accurate protocols for its implementation.
3.2.2 Roughness
As happens with water contact angle measurements, surface roughness measurements are widely spread as a tool to try to understand and explain fouling phenomena.
On one hand, the rougher the membrane the more area it will have, therefore permeation flows could be higher due to the larger contact area [41]. Nevertheless, it is generally agreed that rougher membranes are more prone to be fouled by particles [42]. The enhancement of available contact area that would improve flux values would be also responsible of the particle-membranes interaction enhancement,
3 Membrane fouling
3.2 Factors that affect fouling phenomena 15
Introduction
therefore, fouling would increase as surface roughness became higher [43]. Besides, particles – depending on their size - could be even physically trapped alongside the surface topography due to the valleys and peaks found on rougher membranes.
Roughness is usually quantified by AFM analysis, which yields values that can be compared between samples, although the scanning area could not be very significant compared to the general membrane surface – in the µm order for the (x, y) axis, and height detections down to nm or µm level.
The idea of taking membrane roughness as the sole parameter that could determine fouling properties is a limited approach, since fouling most probably depends on the particle-surface interactions that can occur for a specific system [38], thus contradictory data can be found throughout the literature.
3.2.3 Charge
Surface charge can also be a factor that affects fouling. Since most proteins have a negative charge at neutral pH [44] it is reasonable to assume that a negatively charged membrane would repel protein-fouling at such conditions. Other water colloidal components such as Natural organic matter (NOM) are also negatively charged [45]. The “most” approach does not cover the myriad of possible particles present in water or other aqueous systems, since some proteins can exhibit positive charges too. Therefore, some membrane modifications done by research groups involve the use of zwitterionic charged materials whose effectiveness against fouling could be even better [46–49].
3.2.4 Steric hindrance/repulsion
When attaching polymer chains onto membrane surfaces polymer brush-like structures can be created that can also prevent fouling steric interactions. Steric forces are the consequence of approaching two polymers which were moving freely in a certain solvent and when approached these movements are somehow limited [50]. Kang et al. detected this non-electrostatic and non-specific interaction force while measuring the force curves with BSA colloid probes against PAN-g-PEO/PAN modified membranes. They registered a range of interaction
Introduction
forces much higher than the ones expected for electrostatic forces and whose decay was independent of the ionic strength of the solution [51].
Steric hindrance is affected by several factors such as the distribution density and the chain length of polymer chains [52–54], solvent quality, bulk protein concentration, temperature, shape and dimension of particles [50, 55, 56]. The solvent quality will determine the state of the brush or “brush health”. On a good solvent the brush will be swollen and large particles will not be able to penetrate the brush while the opposite effect could take place if the polymer is in contact with a bad solvent [55].
The theoretical background that tries to explain the protective properties of polymer brushes against foulants are still under development. Some initial approaches involve using the Flory and the scaling arguments [57]. Szleifer developed also a theory for explaining adsorption of proteins onto polymer brushes using the single-chain mean-field theory [58] while Halperin et al. studied the solvent quality effect on the interactions between colloids and neutral polymer brushes [55].
4 Management of fouling for membrane filtration processes
-Membrane modification 17
Introduction
4
Management of fouling for membrane filtration processes
-Membrane modification
As seen before, fouling is an unavoidable phenomena that is affected by several parameters. Since attaining zero fouling is an utopian idea, we can definitely try to manage it.
The management of fouling involves different - yet complementary - strategies: improvement of pre-treatment processes, optimisation of cleaning protocols, amelioration of membrane module design, and development and modification of membranes.
Since membranes are the ultimate barrier in the campaign to reduce fouling, special attention has been drawn to the development of new membrane materials, or the modification of existing ones, aiming at making fouling less irreversible, so even if particles adsorb to the membrane, they will be easily removed on the cleaning step.
In the following paragraph, a selection of the research work in the modification of polymeric materials will be presented. It includes many membrane preparation techniques as well as different types of modifying agents and characterisation methods.
Tuning of polymeric membrane anti-fouling properties can be achieved by basically three methods: coating, blending and grafting.
Coating is the most simple of the three. It consists of the physical adsorption of a particular polymer onto a pre-formed polymeric membrane. Usually, the modifying polymer is an amphiphilic copolymer while the membrane is made out of a hydrophobic polymer. Although its easy manipulation makes it an ideal method for industrial scale applications, concerns of the stability of the coating limit its popularity [59].
Polymer blending is another modification method found on the literature. It expands the classic membrane casting techniques to a system with two or more different types of polymers. For our interests, a hydrophobic polymer can be mixed with a hydrophilic one - or with an amphiphilic copolymer - and during phase inversion the hydrophilic groups will tend to move towards the air outside the blend at the membrane surface or pore walls. Nanoparticules can also be used for blending
Introduction
purposes. Blending is also a potentially interesting technique for scale-up, nevertheless, many factors influence the final structure and properties of the membrane, and it could be costly to produce blended membranes, due to relatively high amounts of modifying agent needed in the blend.
Grafting involves a chemical attachment of a group onto the membrane [60]. This method is usually divided into two groups: ‘grafting from’ and ‘grafting to’. ‘Grafting to’ approaches involve the use of preformed polymer chains that contain reactive groups while with the ‘grafting from’ one the surface is activated and initiate the polymerization of monomers from the surface toward the bulk phase [61, 62]. Covalently bonded species can’t be easily detached from the surface and denser surfaces coverage can be obtained. Nevertheless, grafting techniques are not easy to set up at an industrial scale.
Examples of researchers working on this subject can be easily found in literature. Researchers at the R&D Center for Membrane Technology of the Chung Yuan Christian University in Taiwan have carried out extensive research on polymeric membrane modification using practically all of the modification techniques described before. Some examples of their work can be found in the table below (Table 1.1).
Table 1.1: Summary of membrane modification performed by researchers.
Membrane Modification Modification WCA (◦)
Ref.
material molecules method Virgin Modified
PVDF SBM A ATRP grafting 82 ± 3 51 ± 2 [63]
PVDF P EGM A ATRP grafting 82 ± 1 60 ± 2 [31]
PSf P EO − P P O − P EO VIPS 85 ± 4 58 ± 5 [64] LIPS 77 ± 4 57 ± 2 PVDF P EO − P P O − P EO VIPS 132 ± 3 41 ± 6 [65] PVDF P S55− b − P EGM A30 Coating 116 ± 2 106 ± 2 [30]
Abbreviations: Polysulfone (PSf), Polyethylene oxide (PEO), Polyphenylene oxide (PPO), Sulfobetaine
methacrylate (SBMA), Atom-transfer Radical-polymerization (ATRP); block (b) copolymers
The group of Mayes-Elimelech has also carried out interesting work in the field of membrane modification and the study of fouling. A research paper from Akthakul et al. explored some of the fouling behaviours when preparing PVDF
4 Management of fouling for membrane filtration processes
-Membrane modification 19
Introduction
membranes with PVDF-g-POEM – polyoxyethylene methacrylate – by two methods: coating and blending [66]. For the coated membrane the water contact angle decreased from 95◦ (virgin membrane) to 68◦. Filtration capabilities were assessed by using an oily feed solution and also several dye solutions; results were comparable in terms of rejections but the blended membrane showed lower flux values. For a subsequent research, the group continued to study these PVDF membranes coated with PVDF-g-POEM graft copolymer in more depth keeping in mind a possible application in membrane bioreactor (MBR) systems [32]. They found that the modified membrane showed better flux behaviour for BSA, sodium alginate and humic acid solutions filtrations against the PVDF base membrane for 10-day filtrations. AFM colloid probe technique was also used to study interaction forces between foulants and unmodified/modified membranes; the analysis showed the presence of repulsive steric interactions for the modified membranes that are probably the ones responsible for the anti-fouling properties seen in previous results. The use of natural hydrophilic polymers such as chitosan was also reported [33]. On this work three coating techniques were tested and stable anti-fouling chitosan-PVDF membranes were obtained with similar molecular weight cut-offs (MWCO). Ultimately the coating of chitosan inside the pores of the membrane led to lower fluxes, however this led to achieving less in-pore fouling since initial fluxes could be re-established after cleaning.
Nanoparticules are also being used as hydrophilic modifying materials by some. Blending of inorganic alumina (Al2O3) nano-sized particles with PVDF led to composite membranes with uniformly dispersed nanoparticles with enhanced water fluxes, lower contact angles, and improved anti-fouling performance [67]. A very popular nanoparticle used for composite membrane formation is titanium dioxide (TiO2) due to its stability and potential antibacterial and catalytic properties. Cao et al. prepared blended PVDF-TiO2 membranes and better anti-fouling membranes were obtained when compared with a PVDF one [68]. More interestingly, in this case they did not find a correlation between water contact angle measurements and anti-fouling properties; instead fouling was more influenced by the surface roughness of the membranes.
All of these examples show only a small selection of the work done in the field. The addition of modifying agents is intended to affect the properties of the
Introduction
membranes either by increasing hydrophilicity, creating steric repulsion interactions, and/or creating a hydration layer in the vicinity of the surface of the membrane, among others. How can we study these effects will be summarised in the following section.
5 Techniques for the characterisation of the modification of
membranes and of their anti-fouling properties 21
Introduction
5
Techniques for the characterisation of the modification of
membranes and of their anti-fouling properties
No matter how we approach the membrane modification issue, we need to be able to properly characterise, first, the modification that has been carried out, and then the anti-fouling properties of these membranes.
Several techniques are widely used to assess the presence of the modifying agent, hydrophilicity of the membrane, and adsorption of the foulant. The most direct method to determine the hydrophilicity of the membrane is the water contact angle analysis. It is a quite simple method, with an easy sample preparation and results do not require a big expertise for their processing. However, results can be affected by changes in pore size, roughness, porosity and pore size distribution.
For the membranes modified by coating or grafting, the presence of the modifying agent can be estimated by calculating the coating density, which involves a mass balance between the initial - unmodified - state, and the final one, so that the difference in weight is mainly due to the presence of the modifying molecule. This values are usually expressed as the mass or moles of the agent by membrane area or volume. This estimation does not help to elucidate if the grafted copolymers are on top of the membrane surface, on the pore walls, or inside the matrix (for the membranes prepared by blending). The ability of a membrane to adsorb water can be estimated in a similar way, by calculating the hydration capacity. The initial state would be the dry modified membrane, while the final weight will be determined after the membrane was put in contact for a certain period of time in water.
Fourier-transform infrared spectroscopy (FTIR) has been used to qualitatively assess the modification process and sometimes of the foulants. When a sample is irradiated with infrared light some bonds vibrate. This vibration can be detected and represented as a spectrum (see Figure 1.7). An infrared spectrometer measures the frequencies of infrared light absorbed by a compound, whereas a Fourier-transform infrared spectrometer uses an interferometer creating an interferogram which contains all the information from the spectrum and is converted to a frequency or wavenumber graph by applying the Fourier transform algorithm [69]. The peaks that can be measured on these spectra correspond to a particular bond vibration, allowing the identification of the chemical species on the sample [70, 71]. IR spectra provide
Introduction
information on the presence of functional groups, if the structure of the molecule should be elucidated, other techniques should be used. Sample preparation and data analysis is quite simple, although the technique is limited to the analysis of the surface of the membrane.
Figure 1.7: FTIR technique. (A): Schematics on the stretching of the bonds when irradiated with a beam and the generation of the subsequent spectra. (B): Regions of the spectrum where the concerned bonds typically absorb (taken from [69]).
Atomic force microscopy (AFM) can be used to measure surface roughness. When used in force spectroscopy mode specific particles are attached to the probe, and it is possible to measure surface-particle interaction forces [51]. These particles can be very varied depending on which kind of system researchers want to study, and the experience the team has with attaching them to the probe. A drawback of AFM is that it is a very local measurement. If the surface of membrane is not perfectly homogeneous, as it is generally assumed when membranes are produced, it might not be possible to get a realistic view of the coating homogeneity.
The adsorption of foulant species can be determined by several methods, depending on the type of foulant. UV spectrophotometry is widely used for the
5 Techniques for the characterisation of the modification of
membranes and of their anti-fouling properties 23
Introduction
detection of the adsorbed proteins, or their presence in the rententate and permeate flows, by measuring the absorbance at a wavelength of 280 nm [30]. Confocal microscopy takes advantage of the natural fluorescence of natural agents, therefore it can be used to acquire images of blood cells and bacteria present on the surface of the memnbrane, which can later be counted with a software [52]. X-ray photoelectron spectroscopy (XPS) is used to chemically detect the presence of proteins and other biofoulants [52]. In the case of bacteria or other bigger biofouling agents, scanning electron microscopy (SEM) can also be used to directly detect and count their presence on the surface of the membranes [72].
The determination of fouling by most of these techniques can be regarded as static, foulants reach the surface by diffusion and adsorb, and then its presence and concentration is determined. It is an indication of the behaviour and properties of the system but they have not to be regarded as the absolute truth. These membranes are supposed to be used for filtration set-ups or in systems that there will be a flow, thus final fouling behaviour can be different.
To better assess the effect of the modification in the anti-fouling properties of the membrane it is always necessary to perform filtration tests. They normally involve one filtration and cleaning cycle with the determination of pure water fluxes and evolution of the foulant solution flux. More interesting data can be obtained when more than one fouling-cleaning cycle is performed, since it emulates the way membranes are operated in reality. Some of the previously-mentioned analytical techniques can be applied to analyse the fouled membranes after filtration has been carried out to complement the obtained results.
Is it possible to improve the study of fouling? One interesting approach is the development of direct ways to observe fouling [73, 74], more particularly with the combination of microfluidic devices with fluorescence microscopy [75]. Microfluidic devices rely on the miniaturisation of processes by fabricating systems that handle small volumes (10−9 to 10−18 litres) at a scale of tens to hundreds of micrometres [76]. These devices have the advantages of being portable, on the flexibility of their design, and choice of materials that can be used for their fabrication. Due to their reduced size, the consumption of chemicals, generated waste, and fabrication costs are also reduced. The following figure (Figure 1.8) compares the sizes of the membranes used for typical laboratory filtration
Introduction
experiments against the size of the membranes that can be inserted insed microfluidic chips, and an estimation of volume of fluid necessary for a filtration protocol, assuming same membrane, same permeabilities, and operating conditions.
Figure 1.8: Comparison of membrane area and filtration volumes necessary for a typical laboratory-scale filtration device (left) and a membrane inserted inside a microfluidic device (right).
For membrane processes and the study of fouling, the integration of membranes inside the microfluidic chips is of great interest [77, 78]. With these kind of chips, the advantages of static tests - determination of adsorption properties on the surface of the membrane - could be combined with those of filtration systems - determination of filtration parameters - at the same time for those experimental conditions. When the chips are assembled with transparent materials, microscopy techniques can be used for the direct observation of the fouling on the surface of the membrane.
Another option for the improvement of the study of fouling would be the application of FTIR-mapping techniques, that would yield interesting chemical maps of the surfaces in which the modification and fouling layers could be simultaneously detected.
6 Presentation of the SuperNAM project 25
Introduction
6
Presentation of the SuperNAM project
The present PhD project has been fully funded by the SuperNAM project. The Super Non-Adhesive Membranes for Sustainable Water Treatment project (SuperNAM) is a project performed in close international collaboration between two research groups: the Laboratoire de Génie Chimique (UMR 5503, Université de Toulouse, CNRS, INPT, UPS, Toulouse, France) and the Research and Development Center for Membrane Technology (Chung Yuan Christian University, ChungLi, Taiwan).
This project aims at developing a series of polymer membranes for the filtration of water or waste waters, and bearing super non-adhesive properties. This would lead to make membrane fouling very reversible, hence to save energy, productivity, cleaning agents and membrane lifetime.
Its general objective is the creation of a full generation of non adhesive membranes, which can be produced by simple and easily up-scalable processes. Specifically, this involves the synthesis of new additives that would be miscible with the chosen PVDF membrane, followed by the development of an efficient membrane preparation method to yield low-fouling membranes at large scales. The third target is to fully characterize the membrane physico-chemical and functional properties and to find correlations between structural, chemical and antifouling properties. The study of fouling and its reversibility is also among the objectives of the project, to finalise use these low-fouling membranes in water treatment applications.
The total budget of the project is of 400 000e, half of this amount is funded by the Agence Nationale de la Recherche (ANR, ANR-12-IS08-0002, France) and the other half by the Ministry of Science and Technology (MOST 102-2923-E-033-001-MY3, Taiwan).
Introduction
7
Objectives
The main objective of this manuscript is to study the anti-fouling properties of modified membranes.
The base membranes used are made of PVDF, and the modifying agents concern PS-PEGMA copolymers with three different conformations: diblock, triblock, or random.
Firstly, this study will be performed using most the usual techniques found in bibliography (see Chapters 2 and 5, pages 37 and 147, respectively).
Then, new techniques will be developed or adapted to our system. On the one hand, novel microfluidic chips that contain the membranes will be developed and the fouling will be detected using fluorescence microscopy while performing filtration tests (see Chapter 3, page 81). On the other hand, FTIR-mapping techniques will be applied to the study of our system to see how coating and fouling relate (see Chapter 4, page 113).
8 References 27
Introduction
8
References
[1] UN Water. Water Security and the Global Agenda: A UN-Water Analytical Brief. United Nations University, Institute for Water, Environment & Health (UNU-INWEH), Hamilton, Ontario, Canada, 2013.
[2] UN Water. Policy brief: Water quality, 2011.
[3] WWAP (World Water Assessment Programme). The United Nations World Water Development Report 4: Managing Water under Uncertainty and Risk. UNESCO, Paris, 2012.
[4] Mark Sanctuary, Laurence Haller, and Hakan Tropp. Making water a part of economic development: the economic benefits of improved water management and services. SIWI, 2004.
[5] Guy Hutton, Laurence Haller, et al. Evaluation of the costs and benefits of water and sanitation improvements at the global level. Water, Sanitation, and Health, Protection of the Human Environment, World Health Organization, 2004. [6] D Flynn. Germany’s E. coli outbreak most costly in history, Food safety news,
2011.
[7] Mark A Shannon, Paul W Bohn, Menachem Elimelech, John G Georgiadis, Benito J Marinas, and Anne M Mayes. Science and technology for water purification in the coming decades. Nature, 452(7185):301–310, 2008.
[8] Donald R Rowe and Isam Mohammed Abdel-Magid. Handbook of wastewater reclamation and reuse. CRC Press, 1995.
[9] Heinrich Bechhold. Kolloidstudien mit der Filtrationsmethode. Zeitschrift für Elektrochemie und angewandte physikalische Chemie, 13(32):527–533, 1907. [10] William Brown. On the preparation of collodion membranes of differential
permeability. Biochemical Journal, 9(4):591, 1915.
[11] William Brown. Further Contributions to the Technique of preparing Membranes for Dialysis. Biochemical Journal, 11(1):40, 1917.
Introduction
[12] Sidney Loeb and Srin Sourirajan. Sea water demineralization by means of a semipermeable membrane. University of California, Department of Engineering, 1963.
[13] R.W. Baker. Membrane Technology and Applications. John Wiley & Sons, 2 edition, 2004.
[14] The McIlvaine Company. RO, UF, MF World Markets. Technical report, The McIlvaine Company, 2011-2016.
[15] ZF Cui and HS Muralidhara. Membrane technology: a practical guide to membrane technology and applications in food and bioprocessing. Elsevier, 2010.
[16] Zhaoliang Cui, Enrico Drioli, and Young Moo Lee. Recent progress in fluoropolymers for membranes. Progress in Polymer Science, 39(1):164–198, 2014.
[17] Bruno Ameduri. From vinylidene fluoride (VDF) to the applications of VDF-containing polymers and copolymers: recent developments and future trends. Chem. Rev, 109(12):6632–6686, 2009.
[18] Fu Liu, N Awanis Hashim, Yutie Liu, MR Moghareh Abed, and K Li. Progress in the production and modification of PVDF membranes. Journal of Membrane Science, 375(1):1–27, 2011.
[19] SL Madorsky. Fluorocarbon and chlorocarbon polymers. Thermal degradation of organic polymers, John Wiley & Sons Inc, pages 130–172, 1964.
[20] Flemming F Stengaard. Characteristics and performance of new types of ultrafiltration membranes with chemically modified surfaces. Desalination, 70(1):207–224, 1988.
[21] Dongliang Wang, K Li, and WK Teo. Preparation and characterization of polyvinylidene fluoride (PVDF) hollow fiber membranes. Journal of Membrane Science, 163(2):211–220, 1999.
[22] Pierre Aimar and Patrice Bacchin. Slow colloidal aggregation and membrane fouling. Journal of Membrane Science, 360(1):70–76, 2010.