HAL Id: dumas-01738136
https://dumas.ccsd.cnrs.fr/dumas-01738136
Submitted on 20 Mar 2018HAL is a multi-disciplinary open access L’archive ouverte pluridisciplinaire HAL, est
Impact of disturbances on invasive blood pressure signal
recorded by TruWave® (Edwards) pressure-transducer
and continuous cardiac output estimation by Vigileo®
and MostCare® devices
Julie Grelier
To cite this version:
Julie Grelier. Impact of disturbances on invasive blood pressure signal recorded by TruWave® (Ed-wards) pressure-transducer and continuous cardiac output estimation by Vigileo® and MostCare® devices. Human health and pathology. 2017. �dumas-01738136�
AVERTISSEMENT
Ce document est le fruit d'un long travail approuvé par le
jury de soutenance et mis à disposition de l'ensemble de la
communauté universitaire élargie.
Il n’a pas été réévalué depuis la date de soutenance.
Il est soumis à la propriété intellectuelle de l'auteur. Ceci
implique une obligation de citation et de référencement
lors de l’utilisation de ce document.
D’autre part, toute contrefaçon, plagiat, reproduction illicite
encourt une poursuite pénale.
Contact au SID de Grenoble :
bump-theses@univ-grenoble-alpes.fr
LIENS
LIENS
UNIVERSITE GRENOBLE ALPES FACULTÉ DE MÉDECINE DE GRENOBLE Année 2017
IMPACT OF DISTURBANCES ON INVASIVE BLOOD PRESSURE
SIGNAL RECORDED BY TRUWAVE
®PRESSURE-TRANSDUCER AND CONTINUOUS CARDIAC
OUTPUT ESTIMATION BY VIGILEO
®AND MOSTCARE
®DEVICES
THÈSE
PRÉSENTÉE POUR L’OBTENTION DU DOCTORAT EN MÉDECINE
DIPLÔME D’ÉTAT
Par Melle Julie GRELIER
THÈSE SOUTENUE PUBLIQUEMENT À LA FACULTÉ DE MÉDECINE DE GRENOBLE *
Le 20 Mars 2017
DEVANT LE JURY COMPOSÉ DE
Président du jury : M. le Professeur Jean-François PAYEN de la GARANDERIE Membres du jury : M. le Professeur Pierre ALBALADEJO
M. le Professeur Pierre BOUZAT
M. le Professeur Alexandre MOREAU-GAUDRY
A computer would deserve to be called intelligent if it could deceive a human into believing that it was human.
Table des matières
Remerciements...9
Résumé ...13
Abstract ...14
Introduction... 15
1/ Invasive blood pressure measurement ... 15
A/ Intra-arterial catheter ... 15
B/ Fluid-filled tubing... 15
C/ Transducer... 15
D/ Flushing system ... 15
E/ Processing and amplification of the signal ... 16
2/ Arterial waveform analysis... 16
3/ Natural frequency and resonance... 16
4/ Damping... 17
5/ Applications in Intensive Care Units... 18
Methods... 20
1/ 1st stage: clinical data record... 20
2/ 2nd stage: test-bench replay of recorded BP signals... 20
3/ Statistical analysis... 23
Results... 25
1/ Harmonic analysis... 25
2/ Millar® sensor, BP records with versus without disturbance...26
3/ TruWave® sensor, BP records with versus without disturbance...26
4/ TruWave® sensor BP records with disturbance compared to Millar® sensor records at the same time ... 27
B/ MOSTCARE®... 30
Discussion...32
Conclusion... 36
Remerciements
Résumé
Introduction
: La mesure de pression artérielle (PA) invasive nécessite un capteur de pression relié au patient par liaison hydraulique. Différents phénomènes en modifient les propriétés mécaniques comme des bulles dans la tubulure, plicature ou obstruction du cathéter, perturbant le signal de PA et l'estimation du débit cardiaque (DC) par Vigileo® et MostCare®.
Méthode
: Un signal de PA invasive était enregistré chez 20 patients en post-opératoire immédiat de chirurgie cardiaque. Pour chacun des signaux, un segment de 10 minutes de signal stable était sélectionné, reproduit sur banc d'essai. Les pressions étaient enregistrées par un capteur Millar® à l'entrée du banc, et par un cathéter relié lui-même par une tubulure à un capteur TruWave® et deux débitmètres
(Vigileo® et MostCare®). Pressions systolique, diastolique, moyenne, pulsée (PP) et
DC étaient enregistrés sans puis avec perturbation du système (bulles de 50μL, 100μL, plicature, obstruction du cathéter). Les données étaient analysées par le test de Friedman avec analyse post-hoc en cas de p < 1/1000.
Résultats
: Bulles et plicature du cathéter modifiaient significativement le signal de PA enregistré par TruWave®, contrairement à l'obstruction du cathéter, et 25,7% à
73,8% des estimations de DC par Vigileo® étaient erronées. L'estimation du DC par
MostCare® est elle aussi impactée lors de perturbations du système, sans lien avec
l'intensité de la modification de PP.
Conclusion
:
Divers phénomènes quotidiens peuvent perturber le signal de PA invasive et l'estimation du débit cardiaque par Vigileo® et MostCare®.Abstract
Introduction
: Invasive arterial blood-pressure (BP) measurement requires a liquid-filled catheter-transducer system. Some phenomenon may disturb its mechanical properties such as bubbles in the tubing, bending, catheter-obstruction, with consequently a disturbed BP waveform. This may alter not only BP measurement but also waveform-based continuous cardiac-output (CO) estimation by Vigileo® and MostCare® devices.
Methods
: A continuous invasive arterial BP signal was recorded in 20 patients after cardiac surgery. For each, 10 minutes of stable signal was selected and replayed on a test-bench to be recorded by Millar® sensor right into a dome, catheter
and 1,50m fluid-filled tubing leading to TruWave® sensor and Vigileo® and MostCare®
devices. Data (systolic, diastolic, mean, pulsatile pressure (PP), cardiac-output) were recorded without then with added disturbances (50μL bubbles, 100μL bubbles, catheter-obstruction, catheter-bending). Statistical analysis were performed using Friedman-test with post-hoc analysis if p-value under 1/1000.
Results
: While 50μL and 100μL bubbles and catheter-bending significantly altered BP signal recorded by TruWave® sensor, it is less obvious for catheter-obstruction.
The experiments revealed 25,7% to 73,8% CO misestimations by Vigileo® depending
on PP distortion and disturbance. CO estimation by MostCare®, even if undoubtedly
altered when disturbances were applied to the system, did not seemed related to PP as there is no significant difference depending on PP distortion level.
Conclusion
: Everyday phenomena may disturb invasive BP signal and so waveform-based continuous CO estimation by Vigileo® and MostCare® devices.
Introduction
1/ Invasive blood pressure measurement
Invasive arterial blood pressure (BP) measurement requires a liquid-filled catheter-transducer system, described as an underdamped second-order dynamic system. The system is composed of an intra-arterial catheter, a fluid filled tubing and a transducer.
A/ Intra-arterial catheter
A short, narrow, specially designed catheter is inserted into a peripheral artery, mainly radial or femoral artery. The smaller is the catheter diameter, the lower is the risk of thrombus formation, however the most it increases damping in the system.
B/ Fluid-filled tubing
A fluid-filled tubing provides a non-compressible hydraulic bond between arterial blood and the pressure tranducer. In order to reduce damping, it should be as short, as wide and as stiff (for low compliance) as possible.
C/ Transducer
The transducer is composed of a membrane in contact with fluid in the tubing, to convert the pressure waveform into an electrical signal.
D/ Flushing system
E/ Processing and amplification of the signal
A microprocessor filters, amplifies and analyses the signal before displaying the pressure versus time waveform, which shape can be used to estimate different parameters such as cardiac output (CO).
2/ Arterial waveform analysis
The arterial waveform is made of the fundamental wave – sine wave which frequency is equal to cardiac frequency - and component smaller sine waves called harmonic waves. Harmonic waves frequencies are multiples of the fundamental frequency. Fourier Analysis allows to analyse such a complex waveform and determine its constituent sine waves.
In intra-arterial blood pressure measurement systems, in order to display a blood pressure waveform as accurate as possible, the microprocessor breaks down the complex waveform into fundamental and harmonic sine waves.
3/ Natural frequency and resonance
Natural frequency is the frequency at which a system oscillates freely, it is determined by physical properties of its components. When a force with a similar frequency as the natural frequency of the system is applied, the system will oscillate at its maximum amplitude, that is called resonance. A resonant invasive arterial blood pressure measurement system might over-read systolic blood pressure and under-read diastolic blood pressure.
of the arterial waveform which is the pulse rate. Considering heart rates up to 180bpm (3Hz) and at least eight times this frequency, the natural frequency of the system must be at least 24Hz.
The natural frequency of our systems may be increased by : -shorter catheter or tubing
-higher diameter of catheter or tubing
-less compliant catheter or transducer's membrane -lower-density fluid in the tubing
In Intensive Care Units, the natural frequency of such systems can be reduced by : -bubbles in the tubing
-clots in catheter
-addition of taps or tubing
The fast-flush test is a bedside-test to measure the natural frequency of the system. Flushing the system with high-pressure saline generates an undershoot and overshoot of waves. These waves will resonate at the natural frequency of the system.
4/ Damping
Damping is a decrease in amplitude of oscillations created by anything that reduces energy in an oscillating system. In intra-arterial blood pressure
Over-damping causes under-reading of systolic blood pressure and over-reading of diastolic blood pressure, but also reduces the natural frequency of the system and so allows resonance of the signal. On the contrary, under-damping increases systolic blood pressure and decreases diastolic blood pressure, as can be seen in a resonant signal. For an adequate balance between speed of response and accuracy, the damping coefficient should be around 0.7.
The fast-flush test also allows to measure the damping coefficient by measuring the amplitude ratio of two consecutive resonant waves and reading the corresponding damping coefficient in a chart.
5/ Applications in Intensive Care Units
Mechanical properties (natural frequency (Fn), resonance, damping coefficient) (1–5) of these systems may vary throughout its use due to exposure to patient and environment.
Monitoring devices use mechanical or electronic corrective filters, assuming the transfer function (TF) of the liquid-filled catheter-transducer remains constant (6). However, some phenomenon may disturb mechanical properties of the systems such as bubbles in the tubing, bending or obstruction of the catheter (6–9), resulting in significant modifications of its TF and therefore inaccurate correction by usual filters.
Furthermore, CO estimation devices such as Vigileo® (FloTrac; Edwards™; Lifesciences, Irvine, CA, USA) and MostCare® (Vygon, Vytech, IT), performing waveform-based algorithms, may be misled by a distorted invasive arterial BP signal (10–12). As a result, some disturbances may impact not only BP measurement, but
bending or obstruction of the catheter on both invasive arterial BP signal monitored by a TruWave® pressure-transducer and continuous CO monitoring by Vigileo® and
Methods
1/ 1st stage: clinical data record
According to a clinical protocol approved by an ethic committee (Comité d'Ethique des Centres d'Investigation Clinique (CECIC) inter-région Rhône-Alpes-Auvergne, n° IRB 5891) a continuous invasive arterial BP signal (liquid-filled catheter-transducer system composed of arterial catheter, 1.50m fluid-filled tubing leading to a TruWave® sensor) has been recorded in 20 patients after cardiac surgery in
cardio-vascular and thoracic intensive care unit. For each patient, within the 4 to 20 hours of the recorded signal, a 10 consecutive minutes portion was selected: we chose a stable signal with neither artefact nor amplitude variation, registered less than one hour after the last flushing of the system. These whole 10 minutes signals where saved end-to-end in order to make a unique 200 minutes signal.
All patients consented to participate in the study.
2/ 2nd stage: test-bench replay of recorded BP signals
Recorded BP signals were then replayed using a test bench (Figure 1) composed of a computer which sent the signal into the Flometric® dome calibrated
with a water column, in order to transform the electric pressure signal input into a physically measurable pressure signal.
Two devices left the dome through independent outlets :
-Millar® pressure sensor, plugged right into the dome, in order to control BP signal
-FloTrac® sensor for cardiac output measurement with two different devices :
Vigileo® and MostCare®
-TruWave® sensor, to measure changes in BP after disturbances were applied
on the fluid-filled catheter-transducer system
Figure 1. Test-bench design
A PC sends an electronic pressure signal into the Flowmetric® dome in which the electric signal is transformed into a physical pressure signal.
Different devices leave the dome through two different outlets : -Millar® pressure sensor, plugged right into the dome
-1.50m water-filled tubing linked to a FloTrac® sensor (for CO measurement with two different devices : Vigileo® and MostCare®) the another 10cm water-filled tubing linked to a TruWave®
sensor.
Another PC is dedicated to the recording of those 4 signals (Millar® pressure sensor, TruWave® pressure sensor, Vigileo® and MostCare®)
dBP]/3), pulsatile pressure (PP = sBP-dBP) - and cardiac output (Vigileo® and
MostCare®) data were collected and saved onto two different monitors.
After calibrating the test bench, an harmonic analysis (study of the system frequency response after the application of a variable-frequency, constant-amplitude signal) was performed at the beginning and at the end of every experiment in order to characterise and assure the steadiness of the hydraulic bond. If the response frequency of the liquid-filled catheter-transducer system increased more than 1 Hertz (absolute value), the experiment was to be replayed.
Experiments were conducted as following (Figure 2): no added disturbance, added 50µL then 100µL bubbles, bending of the catheter (voluntarily folded as it leaves the dome) and last obstruction of the catheter. This sequence has been repeated in order to evaluate our experiment's reliability through inter-series consistency. Bubbles were inserted into the tubing using an Hamilton 50µL syringe.
Figure 2. Experimental progress
All the five experiments were performed one after another in this order : no added disturbance, 50µL bubble, 100µL bubble, catheter-bending, catheter-obstruction, and again in the same order, so as two
Catheter-bending Catheter-obstruction 100µL bubble 50µL bubble No added disturbance FIRST SERIES Catheter-bending Catheter-obstruction 100µL bubble 50µL bubble No added disturbance SECOND SERIES
Harmonic analysis performed before and after each experiment to check the steadiness of the hydraulic bond. If the response frequency of the liquid-filled catheter-transducer system changed over 1 Hertz (absolute value), the experiment needed to be replayed.
For each experiment, the first 60s of blood pressure and CO signals were skipped due to time needed by the software to adjust the signal to the Flowmetric®
dome temperature but also in order to compare stable CO signal.
1000Hz sampling was performed on signals recorded by BP sensors and CO estimation devices.
3/ Statistical analysis
Missing data were recoded according to the method of the worst case scenario (i.e. they take the values of undisturbed signals). Statistical analyses were performed with R software (version 3.1.0).
Impact of disturbances on BP signal:
BP signals without and with disturbances were compared point-to-point. Given the little number of patients (20), descriptive statistics were expressed as the median [25% percentile ; 75% percentile] for quantitative variables.
The Friedman test was applied to all variables of interest to identify significant differences for each data (sBP, dBP, mBP, PP) all disturbances considered (added 50µL bubbles, 100µL bubbles, bending of the catheter and obstruction of the
analysis on Friedman’s test results (multiple comparison test) was performed to determine which disturbances significantly disturbed the signal (p value < 1/100). We established inter-series consistency, as the percentage of similarities between the two series for each disturbance.
Impact of PP distortion on CO estimation:
For each signal and each experiment was determined the mean of absolute values of point-to-point differences in PP recorded by TruWave® sensor with versus
without disturbance. PP distortion expressed in percentages refers to this analysis. Below 5% difference in PP value, the liquid-filled catheter-transducer system was considered still able to carry the pressure signal from the dome to the pressure-transducer (13).
As a CO variation about 10% seems clinically relevant (14,15), we chose to evaluate the relation between PP distortion (absolute values) with 5% and 20% thresholds and CO estimation (10% threshold) by Vigileo® and MostCare® devices.
For each disturbance and each range of PP distortion were scored the amount of CO misestimations (expressed in numbers and percentages).
Results
In the first series during the 50µL bubbles experiment, neither BP nor CO were recorded for one of the 20 patients, statistical analysis were performed upon the 19 other patients. 1/ Harmonic analysis Experiment ∆F(b-e) No added disturbance 1st series 0.3225 2nd series 0.7515 50µL bubble 1 st series 0.282 2nd series 0.435 100µL bubble 1 st series 0.392 2nd series 0.251 Catheter obstruction 0 Catheter-bending 0
Table 1. Harmonic analysis results
∆F(b-e): Frequency difference (Hertz) between beginning and end of the experiment (absolute values) The hydraulic bond is steady if frequency increases less than 1 Hertz.
As difference in frequencies in case of obstruction or bending of the catheter was strictly 0 Hz, the analysis has not been repeated for catheter-bending and catheter-obstruction in the 2nd series.
The harmonic analysis performed at the beginning and end of every experiment confirmed the hydraulic bond was stable (frequency difference below 1 Hertz), no experiment had to be repeated (Table 1).
As difference in frequencies in case of obstruction or bending of the catheter was strictly 0 Hz, the analysis has not been repeated for catheter-bending and catheter-obstruction in the 2nd series.
2/ Millar® sensor, BP records with versus without disturbance
50μL bubble 100μL bubble Obstruction Catheter-bending
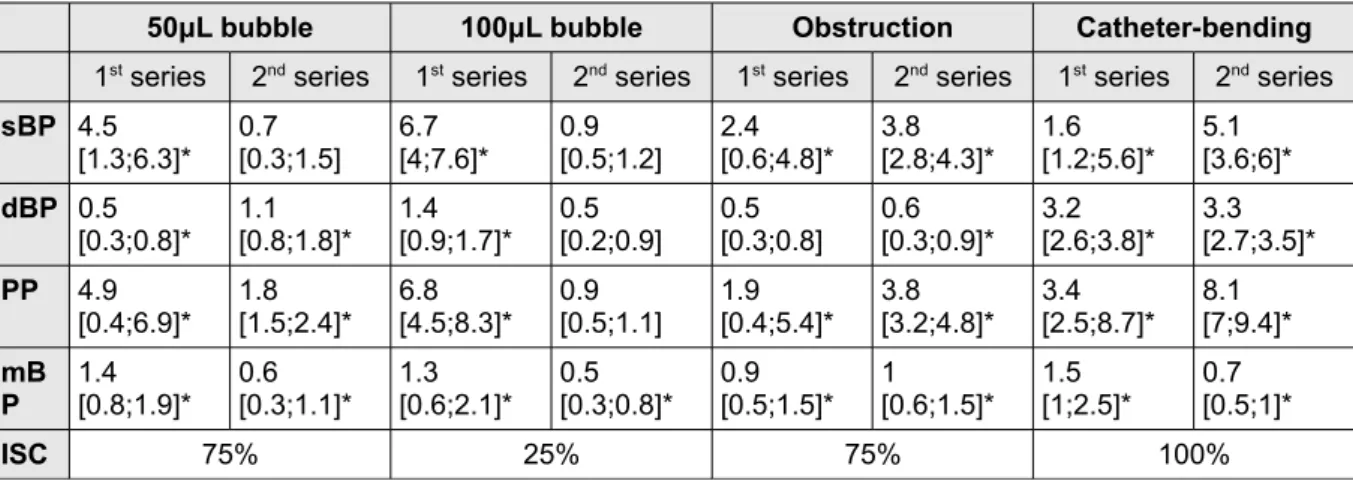
1st series 2nd series 1st series 2nd series 1st series 2nd series 1st series 2nd series sBP 4.5 [1.3;6.3]* 0.7[0.3;1.5] 6.7[4;7.6]* 0.9[0.5;1.2] 2.4[0.6;4.8]* 3.8[2.8;4.3]* 1.6[1.2;5.6]* 5.1[3.6;6]* dBP 0.5 [0.3;0.8]* 1.1[0.8;1.8]* 1.4[0.9;1.7]* 0.5[0.2;0.9] 0.5[0.3;0.8] 0.6[0.3;0.9]* 3.2[2.6;3.8]* 3.3[2.7;3.5]* PP 4.9 [0.4;6.9]* 1.8[1.5;2.4]* 6.8[4.5;8.3]* 0.9[0.5;1.1] 1.9[0.4;5.4]* 3.8[3.2;4.8]* 3.4[2.5;8.7]* 8.1[7;9.4]* mB P 1.4[0.8;1.9]* 0.6[0.3;1.1]* 1.3[0.6;2.1]* [0.3;0.8]*0.5 0.9[0.5;1.5]* 1[0.6;1.5]* 1.5[1;2.5]* 0.7[0.5;1]* ISC 75% 25% 75% 100%
Table 2. Millar® sensor, BP records with versus without disturbance
sBP: systolic blood pressure, dBP: diastolic blood pressure, PP: pulsatile pressure, mBP: mean blood pressure, ISC: Inter-series consistency
Median [25% percentile ; 75% percentile], all expressed in mmHg * stands for significant difference, p value < 0.01
sBP, dBP, mBP together with PP were disturbed when 50µL or 100µL bubbles were introduced into the tubing or when the catheter was bended or obstructed (except for dBP) in the 1st series. In the 2nd series, whilst 50µL altered all but sBP
measurement, 100µL bubbles only disturbed mBP.
Inter-series consistency is poor (25%) in 100µL bubbles experiment, whereas 75 to 100% for the three others.
3/ TruWave® sensor, BP records with versus without disturbance
50μL bubble 100μL bubble Obstruction Catheter-bending
1st series 2nd series 1st series 2nd series 1st series 2nd series 1st series 2nd series sBP 5.3 [2.9;7]* 9.5[4.4;13.1]* 6.9[3.2;10.1]* 16.5[9.3;23.3]* 4.2[2.8;7]* 1.5[1.1;2.3] 25.3[21.7;37.4]* 21.6[17.3;31.6]* dBP 2.5 [1.6;3.1]* 0.9[0.6;1.2]* 2.5[1.3;3.2]* 0.9[0.6;1.2]* 2.2[1.8;2.6]* 0.7[0.5;1.2]* 11.8[10.5;14.1]* 11.1[9;14.1]* PP 6.5 [4.2;10.6]* 9.5[5.2;13.6]* 6.1[4.5;11.9]* 16.1[9.6;22.6]* 7.6[5.2;9.6]* 1.3[1;1.8] 36.5[33.2;49.3]* 34.3[27;45]*
Table 3. TruWave® sensor, BP records with versus without disturbance
sBP: systolic blood pressure, dBP: diastolic blood pressure, PP: pulsatile pressure, mBP: mean blood pressure
Median [25% percentile ; 75% percentile], all expressed in mmHg * stands for significant difference, p value < 0.01
Both 50µL and 100µL bubbles and catheter-bending significantly disturbed BP signal considering sBP, dBP, PP and mBP, with 100% inter-series consistency.
Obstruction of the arterial catheter disturbed sBP, dBP, mBP together with PP in the 1st series whereas only dBP in the 2nd series.
4/ TruWave
®sensor BP records with disturbance compared to
Millar
®sensor records at the same time
No added
disturbance 50μL bubble 100μL bubble Obstruction Catheter-bending
1st
series 2
nd
series 1
st series 2nd series 1st series 2nd series 1st series 2nd
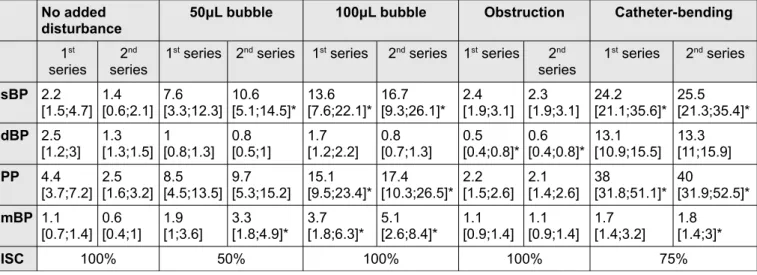
series 1 st series 2nd series sBP 2.2 [1.5;4.7] 1.4[0.6;2.1] 7.6[3.3;12.3] 10.6[5.1;14.5]* 13.6[7.6;22.1]* 16.7[9.3;26.1]* 2.4[1.9;3.1] 2.3[1.9;3.1] 24.2[21.1;35.6]* 25.5[21.3;35.4]* dBP 2.5 [1.2;3] 1.3[1.3;1.5] 1[0.8;1.3] 0.8[0.5;1] 1.7[1.2;2.2] 0.8[0.7;1.3] 0.5[0.4;0.8]* 0.6[0.4;0.8]* 13.1[10.9;15.5] 13.3[11;15.9] PP 4.4 [3.7;7.2] 2.5[1.6;3.2] 8.5[4.5;13.5] 9.7[5.3;15.2] 15.1[9.5;23.4]* 17.4[10.3;26.5]* 2.2[1.5;2.6] 2.1[1.4;2.6] 38[31.8;51.1]* 40[31.9;52.5]* mBP 1.1 [0.7;1.4] 0.6[0.4;1] 1.9[1;3.6] 3.3[1.8;4.9]* 3.7[1.8;6.3]* 5.1[2.6;8.4]* 1.1[0.9;1.4] 1.1[0.9;1.4] 1.7 [1.4;3.2] 1.8[1.4;3]* ISC 100% 50% 100% 100% 75%
Table 4. TruWave® sensor BP records with disturbance compared to Millar® sensor records at
the same time
sBP: systolic blood pressure, dBP: diastolic blood pressure, PP: pulsatile pressure, mBP: mean blood pressure
dBP (100% inter-series consistency).
Catheter-obstruction altered dBP measurement only (100% inter-series consistency).
Catheter-bending disturbed sBP and PP in both the two series, mBP in the 2nd
series only (75% inter-series consistency).
5/ Inter-series consistency
Percentage of similarities between the two series for each disturbance are shown in Table 5. During Millar® sensor BP records with versus without disturbances
experiment inter-series consistency was excellent for catheter-bending, whilst 75% with 50μL bubbles and catheter-obstruction and only 25% with 100μL bubbles. However the same experiments with TruWave® sensor led to excellent inter-series
consistency (100%) in 3 out of 4 disturbances. When comparing TruWave® sensor
BP records with disturbance to Millar® sensor records at the same time inter-series
consistency was excellent (100%) before adding any disturbance, as with 100μL bubbles and obstruction, whereas a little lower experimenting catheter-bending (75%) and only 50% with 50μL bubbles.
Inter-series
consistency No added disturbance 50μL bubble 100μL bubble Obstruction Catheter-bending
2 75% 25% 75% 100%
3 100% 100% 25% 100%
4 100% 50% 100% 100% 75%
Table 5. Inter-series consistency for each experiment 2 Millar® sensor, BP records with versus without disturbance
3 TruWave® sensor, BP records with versus without disturbance
7/ CO estimation perturbation hazard in case of PP distortion for
each disturbance
Statistical analysis were performed on the 159 BP patterns studied (20 patients, 4 disturbances, 2 series for each disturbance, minus one pattern as in the 1st series during the 50µL bubbles experiment, neither BP nor CO were recorded for a
patient). All together with BP datas were recorded CO estimation by Vigileo® and
MostCare®.
Results in tables are expressed with rational number then percentages as the amount of CO misestimations for this disturbance in this series upon the amount of BP signals in this range of PP distortion for this disturbance in this same series.
A/ VIGILEO®
Disturbance 50µL bubbles 100µL bubbles Obstruction Catheter-bending Any disturbance, Any series PP distortion 1 st series 2 nd series 1 st series 2 nd series 1 st series 2 nd series 1 st series 2 nd series
< 5% (20.0%)1/5 0 (NA) (0.0%)0/2 0 (NA) (0.0%)0/3 (11.1%)2/18 0 (NA) 0 (NA) 3/28 (10.7%) [5-20%] (25.0%)3/12 (6.7%)1/15 (37.5%)6/16 (50.0%)4/8 (23.5%)4/17 (0.0%)0/2 0 (NA) 0 (NA) 18/70 (25.7%)
> 20% (50.0%)1/2 (20.0%)1/5 (0.0%)0/2 (41.7%)5/12 0 (NA) 0 (NA) (95.0%)19/20 (95.0%)19/20 45/61 (73.8%)
Table 7. CO perturbation hazard in case of PP distortion for each disturbance, Vigileo® device
PP: pulsatile pressure
[amount of CO misestimations for this disturbance in this series] / [amount of BP signals in this range of PP distortion for this disturbance in this series], rational numbers and percentages
In 131 out of the 159 BP patterns studied, we observed more than 5% PP distortion. 25.7% and 73.8% of CO estimation appeared to be wrong respectively for [5-20%] PP distortion and > 20% PP distortion.
induced 5 to 20% PP distortion, impact on CO estimation was variable between the 2 series, from 6,7% to 25%. In case of PP distortion over 20%, CO estimation was more likely to be disturbed (20% to 50% depending on the series).
With regard to 100µL bubbles, they mostly induced a > 5% PP distortion and disturbed CO estimation from 37.5% to 50% depending on the series in 5 to 20% PP distortion, up to 41.7% in case of PP distortion over 20%.
Obstruction of the catheter disturbed PP from 5 to 20% for 17 patients in the 1st
series, associated with 23.5% risk of wrong CO estimation, whereas in the 2nd series
such a distortion was observed in only 2 patients, without leading to a wrong CO estimation.
Catheter-bending disturbed PP more than 20%, in the 20 patients, for 19 of them CO was impacted.
B/ MOSTCARE®
Disturbance 50µL bubbles 100µL bubbles Obstruction Catheter-bending Any disturbance, Any series PP distortion 1st series 2nd series 1st series 2nd series 1st series 2nd series 1st series 2nd series
< 5% (80%)4/5 0 (NA) (50%)1/2 0 (NA) (66.7%)2/3 (61.1%)11/18 0 (NA) 0 (NA) 18/28 (64.3%) [5-20%] (50%)6/12 (73.3%)11/15 (68.8%)11/16 (100%)8/8 (64.7%)11/17 (50%)1/2 0 (NA) 0 (NA) 48/70 (68.6%) > 20% (50%)1/2 (40%)2/5 (50%)1/2 (66.7%)8/12 0 (NA) 0 (NA) (65%)13/20 (70%)14/20 39/61 (64%)
Table 8. CO perturbation hazard in case of PP distortion for each disturbance, MostCare®
device
PP: pulsatile pressure
[amount of CO misestimations for this disturbance in this series] / [amount of BP signals in this range of PP distortion for this disturbance in this series], rational numbers and percentages
In 131 out of the 159 BP signals studied, we observed more than 5% PP distortion (respectively 70 for [5-20%] PP distortion and 61 when PP distortion over
and 64% inaccurate CO estimation when PP distortion was over 20%.
50µL bubbles disturbed BP signal in 14 to 20 experiments depending on the series, mostly 5 to 20% PP distortion, associated with 40 to 73.3% wrong CO estimations. As for them, 100µL bubbles disturbed BP signals in 18 to 20 experiments depending on the series, associated with 50% to 100% wrong CO estimations.
Obstruction of the catheter disturbed PP for 2 to 17 out of the 20 patients, CO misestimation varied from 50 to 64.7%.
Catheter-bending disturbed PP in every patient whatever the series, for 13 to 14 of them CO estimation was inaccurate.
Discussion
This study confirmed the impact of bubbles, bending and catheter-obstruction on invasive BP signal, and as expected on waveform-based CO estimation.
Qualitative arterial waveform analysis have been used for years, and nowadays commonly used as caregivers estimate accuracy of sBP, dBP and mBP read on monitoring devices by visual-checking of continuous arterial BP waveform. More recently quantitative analysis has been developed in order to deduce hemodynamic parameters such as left ventricular contractility, stroke volume, CO, central arterial pressure (deduced from peripheral arterial pressure signal using a Generalised Transfer Function) (7,16–19).
Even if the 10 minutes BP signals replayed on the test-bench were extracted from a few hours-long patient recording considered as “a pure signal”, we must keep in mind that these BP signals were already TruWave® signals, a fluid-filled
catheter-transducer system already potentially disturbed by bubbles, catheter-bending or catheter-obstruction, although BP signals were selected less than 1 hour after a flush.
The harmonic analysis showed a stable signal during the whole record so the disturbance can be considered as similar from the beginning to the end of each experiment.
When studying BP signal recorded by Millar® sensor with versus without
disturbance, as the disturbance was applied on the fluid-filled catheter and tubing system leading to TruWave® sensor, Millar® sensor, which recorded the pressure
pressure wave meets the disturbance (catheter-bending, catheter obstruction or bubbles introduced into the tubing). Thus the signal replayed was modified before being recorded by TruWave® sensor when we applied disturbances. For example,
simulating obstruction of the catheter, whereas we expected a decreasing sBP, we observe an increased sBP in the dome.
In TruWave® sensor BP signal with versus without disturbance experiment,
inter-series consistency was not as good when bubbles were introduced into the tubing as for catheter-bending and obstruction (100% inter-series consistency), raising experimental alea (situation of the bubble inside the tubing) or relevance of the chosen criteria. As the intra-dome BP signal was modified after application of disturbances to the catheter and liquid-filled tubing, TruWave® sensor recorded a
signal modified not only by a reflected wave back into the dome (as showed by Millar® sensor BP analysis) but also by the disturbance applied to the liquid-filled
catheter-tubing system.
Observing TruWave® and Millar® sensors BP signals recorded simultaneously
without then with disturbances, we overcame the test-bench limit, taking into account intra-dome modification of the BP signal when applying a disturbance on the catheter or fluid-filled tubing. Moreover, in this experiment, inter-series consistency was satisfying for 100µL bubbles, catheter-bending and catheter-obstruction (75 to 100%) whereas only 50% for 50µL bubbles.
This study confirmed that CO estimation through Vigileo® and MostCare®
devices may be disrupted by BP signal distortions, as we showed the more PP was distorted, the more Vigileo®'s CO estimation may be wrong, (10.7%, 25.7%, 73,8%
misestimation trend with both the two CO monitoring devices studied we must be careful interpreting the result: inter-series consistency was poor, especially when bubbles were introduced into the tubing; this was probably due to the position of the bubbles into the tubing or stopcocks. However, the bigger were the bubbles, the more PP seemed distorted and CO estimation tended to be inaccurate. As expected, catheter-bending disturbed both PP and CO estimation by both Vigileo® and
MostCare®.
We showed 100µL bubble, catheter-bending and partial or total obstruction of the catheter induced significant changes in TruWave® and CO monitoring. As these
devices are based on blood pressure waveform, and figures calculated from sBP and dBP (PP, mBP), estimation of cardiac output by these CO monitoring devices may be inaccurate. Fluid management concept recently became a major concern, using new technologies including pulse contour analysis to determine cardiac output and stroke volume changing in response to dynamic tests (14,20,21).
CO comparisons confirm Romagnoli's observations about incorrect estimation of hemodynamic parameters by monitoring devices using pulse contour analysis (22). Algorithms already have been updated to adjust to physiological or pathological conditions, Compton and al. studied performances of Vigileo® CO monitoring in
hemodynamically unstable patients in 2007, after an update designed to increase aortic compliance estimation. Despite this update, they concluded CO estimation by Vigileo still was not accurate enough to replace invasive CO monitoring (23). In clinical practice, such as Monnet and al. studied third generation FloTrac/Vigileo®
device's reliability in tracking changes in cardiac index induced by volume expansion or norepinephrine (24). They found that the device was not accurate enough to evaluate cardiac index changes after volume expansion or vasoconstriction induced
to a second generation FloTrac software in patients with sepsis, showing the latest improved, being less influenced by total systemic vascular resistance and so more accurate for these patients (25).
By using real-time Transfer Function estimation of the arterial catheter and liquid-filled tubing we could detect and maybe correct pressure distortion induced by disturbances (bubbles, obstruction, catheter-bending) or due to modification of physical characteristics of the tubing during its use (air, heat, saline exposure). A medical device able to characterise BP signal may be helpful for clinicians not only to determine if BP and CO estimations are accurate and if possible, but also to correct BP signal and therefore improve CO estimations, giving a reliable input signal to medical devices such as Vigileo® and MostCare®.
Conclusion
Bubbles, catheter-bending, catheter obstruction may significantly alter TruWave® pressure-transducer input invasive arterial blood pressure signal and by
the way waveform-based continuous cardiac output estimation by Vigileo® and
MostCare®. As BP and CO monitoring are daily used in intensive care units and those
disturbances an everyday issue, their accuracy is a main element to give the most suitable cares to our patients. By designing a device able to detect and correct BP signal distortion we could improve reliability of pulse contour analysis CO monitoring.
References
1. Hunziker P. Accuracy and dynamic response of disposable pressure transducer-tubing systems. Can J Anaesth J Can Anesxth. 1987 Jul;34(4):409–14.
2. Taylor BC, Ellis DM, Drew JM. Quantification and simulation of fluid-filled catheter/transducer systems. Med Instrum. 1986 Jun;20(3):123–9.
3. Romagnoli S, Ricci Z, Quattrone D, Tofani L, Tujjar O, Villa G, et al. Accuracy of invasive arterial pressure monitoring in cardiovascular patients: an observational study. Crit Care. 2014;18(6):644.
4. Gardner RM. Direct blood pressure measurement--dynamic response requirements. Anesthesiology. 1981 Mar;54(3):227–36.
5. Cao H, Norris P, Ozdas A, Jenkins J, Morris JA. A simple non-physiological artifact filter for invasive arterial blood pressure monitoring: a study of 1852 trauma ICU patients. In: Engineering in Medicine and Biology Society, 2006 EMBS’06 28th Annual International Conference of the IEEE [Internet]. IEEE; 2006 [cited 2017 Feb 26]. p. 1417–20. Available from:
http://ieeexplore.ieee.org/abstract/document/4462027/
6. Promonet C, Anglade D, Menaouar A, Bayat S, Durand M, Eberhard A, et al. Time-dependent pressure distortion in a catheter-transducer system: correction by fast flush. Anesthesiology. 2000 Jan;92(1):208–18.
7. Thiele RH, Durieux ME. Arterial Waveform Analysis for the Anesthesiologist: Past, Present, and Future Concepts. Anesth Analg. 2011 Sep;1.
8. Shinozaki T, Deane RS, Mazuzan JE. The dynamic responses of liquid-filled catheter systems for direct measurements of blood pressure. Anesthesiology. 1980 Dec;53(6).
9. Kleinman B, Powell S, Kumar P, Gardner RM. The fast flush test measures the dynamic response of the entire blood pressure monitoring system.
Anesthesiology. 1992 Dec;77(6):1215–20.
10. Funk DJ, Moretti EW, Gan TJ. Minimally invasive cardiac output monitoring in the perioperative setting. Anesth Analg. 2009 Mar;108(3):887–97.
11. Manecke GRJ, Auger WR. Cardiac output determination from the arterial pressure wave: clinical testing of a novel algorithm that does not require calibration. J Cardiothorac Vasc Anesth. 2007 Feb;21(1).
12. Terada T, Usami A, Iwasaki R, Toyoda D, Ozawa J, Ochiai R. [A pilot assessment of the FloTrac cardiac output monitoring system comparing with pulmonary
therapy. Ann Intensive Care. 2011;1(1).
15. Marik PE, Cavallazzi R, Vasu T, Hirani A. Dynamic changes in arterial waveform derived variables and fluid responsiveness in mechanically ventilated patients: a systematic review of the literature. Crit Care Med. 2009 Sep;37(9):2642–7. 16. Donati A, Nardella R, Gabbanelli V, Scarcella M, Romanelli M, Romagnoli L, et
al. The ability of PiCCO versus LiDCO variables to detect changes in cardiac index: a prospective clinical study. Minerva Anestesiol. 2008 Aug;74(7-8):367– 74.
17. Romagnoli S, Franchi F, Ricci Z, Scolletta S, Payen D. The Pressure Recording Analytical Method (PRAM): Technical Concepts and Literature Review. J
Cardiothorac Vasc Anesth. 2016 Sep 14;
18. Asamoto M, Orii R, Otsuji M, Bougaki M, Imai Y, Yamada Y. Reliability of cardiac output measurements using LiDCOrapid and FloTrac/Vigileo across broad ranges of cardiac output values. J Clin Monit Comput. 2016 Jun 14;
19. Park JH, Hwang G-S. Respiratory variation of systolic and diastolic time intervals within radial arterial waveform: a comparison with dynamic preload index. J Clin Anesth. 2016 Aug;32:75–81.
20. Choi S-S, Jun I-G, Cho S-S, Kim S-K, Hwang G-S, Kim Y-K. Effect of stroke volume variation-directed fluid management on blood loss during living-donor right hepatectomy: a randomised controlled study. Anaesthesia. 2015
Nov;70(11):1250–8.
21. Zhang D, Song Y, Yang Y, Duan A, Zhang Z, Wang Y. [An application of arterial pressure-based cardiac output measurements in fluid management strategies of critically ill patients]. Zhonghua Wei Zhong Bing Ji Jiu Yi Xue. 2014
Sep;26(9):620–3.
22. Romagnoli S, Romano SM, Bevilacqua S, Lazzeri C, Gensini GF, Pratesi C, et al. Dynamic response of liquid-filled catheter systems for measurement of blood pressure: precision of measurements and reliability of the Pressure Recording Analytical Method with different disposable systems. J Crit Care. 2011
Aug;26(4):415–22.
23. Compton FD, Zukunft B, Hoffmann C, Zidek W, Schaefer J-H. Performance of a minimally invasive uncalibrated cardiac output monitoring system
(Flotrac/Vigileo) in haemodynamically unstable patients. Br J Anaesth. 2008 Apr;100(4):451–6.
24. Monnet X, Anguel N, Jozwiak M, Richard C, Teboul J-L. Third-generation FloTrac/Vigileo does not reliably track changes in cardiac output induced by norepinephrine in critically ill patients. Br J Anaesth. 2012 Apr;108(4):615–22. 25. De Backer D, Marx G, Tan A, Junker C, Van Nuffelen M, Huter L, et al. Arterial
pressure-based cardiac output monitoring: a multicenter validation of the third-generation software in septic patients. Intensive Care Med. 2011 Feb;37(2):233–
En presence des Maitres de cette Faculte, de mes chers condisciples et devant l’effigie d’HIPPOCRATE,
Je promets et je jure d’etre fidele aux lois de l’honneur et de la probite dans l’exercice de la Medecine.
Je donnerai mes soins gratuitement a l’indigent et n’exigerai jamais un salaire au-dessus de mon travail. Je ne participerai a aucun partage clandestin d’honoraires.
Admise dans l’intimite des maisons, mes yeux ne verront pas ce qui s’y passe ; ma langue taira les secrets qui me seront confies et mon etat ne servira pas a corrompre les mœurs, ni a favoriser le crime.
Je ne permettrai pas que des considerations de religion, de nation, de race, de parti ou de classe sociale viennent s’interposer entre mon devoir et mon patient.
Je garderai le respect absolu de la vie humaine.
Meme sous la menace, je n’admettrai pas de faire usage de mes connaissances medicales contre les lois de l’humanite.
Respectueuse et reconnaissante envers mes Maitres, je rendrai a leurs enfants l’instruction que j’ai reçue de leurs peres.