THESIS PRESENTED TO THE
UNIVERSITY OF QUEBEC AT CHICOUTIMI
IN PARTIAL FULFILLMENT OF THE
REQUIREMENT FOR THE DEGREE OF
DOCTOR OF PHILOSOPHY IN ENGINEERING
BY
MOHAMED HASSAN A. ABDELAZIZ
MICROSTRUCTURAL AND MECHANICAL CHARACTERIZATION
OF TRANSITION ELEMENTS-CONTAINING Al-Si-Cu-Mg ALLOYS
FOR ELEVATED-TEMPERATURE APPLICATIONS
QUÉBEC, CANADA ©M.H. ABDELAZIZ, 2018
THÈSE PRÉSENTÉE À
L’UNIVERSITÉ DU QUÉBEC À CHICOUTIMI
COMME EXIGENCE PARTIELLE
DU DOCTORAT EN INGÉNIERIE
PAR
MOHAMED HASSAN A. ABDELAZIZ
CARACTÉRISATION MICROSTRUCTURALE ET MÉCANIQUE
DES ALLIAGES Al-Si-Cu-Mg CONTENANT DES ÉLÉMENTS DE
TRANSITION POUR DES APPLICATIONS À TEMPÉRATURE
ÉLEVÉE
QUÉBEC, CANADA ©M.H. ABDELAZIZ, 2018
Dedicated to my parents, my wife Aya, and my daughter Laura
RÉSUMÉ
L’objectif principal de cette étude est de comprendre et d’améliorer les performances mécaniques des alliages 354 Al-Si-Cu-Mg à température ambiante et à température élevée avec ajout de zirconium (Zr) comme élément d’alliage de base et l’ajout subséquent de nickel (Ni) et DE manganèse (Mn) pour valider l’utilité de ces alliages dans l’industrie automobile. Les motifs de ces ajouts sont de développer une microstructure thermiquement stable, capable de résister au grossissement provoqué par une exposition prolongée à des températures élevées et donc de préserver des propriétés mécaniques acceptables lorsqu'il est utilisé dans des applications à haute température.
L’analyse des données obtenue par différentiel scanning calorimétrique (DSC) et par l’identification des phases démontre que les alliages de type 354 développe une microstructure complexe à l’état brut de coulée qui contient des phases communes incluant: α-Al, silice eutectique, aluminure de cuivre (Al2Cu) avec différente morphologies, phases
riche en Mg comme le siliciure de magnésium (Mg2Si), phase-Q (Al5Cu2Mg8Si6) et des
phases intermétalliques à base de Fe incluant β-Al5FeSi, α-Al15(Fe, Mn)3Si2, and
π-Al8FeMg3Si6.
En ce qui concerne les précipités de renforcement, les études microscope électronique transmission (MET) confirment que les alliages étudiés ont été renforcés principalement par les précipités θ-Al2Cu et S-Al2CuMg et leurs précurseurs, en plus d'un
effet de renforcement secondaire par des précipités en Alx(Zr, Ti) Si qui s'est formé après
l'addition de Zr. Les données montrent que l'alliage de base (M1S), qui est un alliage sans Ni, comprend des fractions plus élevées de précipités de θ-Al2Cu que l'alliage contenant 4%
de Ni (M4S).
Les additions de Ni et Mn en différentes quantités et combinaisons (alliages M2S à M5S) ont augmenté la fraction volumique des composés intermétalliques par rapport à l'alliage de base (M1S) (2,5% pour l'alliage M1S et 12,21% pour l'alliage M4S). Ils ont des effets indiscutables sur les propriétés mécaniques. Les ajouts proposés ont amélioré les performances mécaniques des alliages, à savoir les propriétés de traction à température ambiante et élevée, les valeurs de dureté et les propriétés d'impact. Pour les alliages contenant du Mn, les performances mécaniques améliorées ont été attribuées à la formation de particules de boue sous la forme de α-Al15 (Fe, Mn)3Si2 à côté de la phase α de type
script qui pourrait résister aux propagations de fissures; tandis que la précipitation de phases portant Ni dans les alliages contenant du Ni (tels que: Al9FeNi, Al3CuNi et Al3Ni)
était considérée comme gênant la propagation des fissures et améliorant ainsi les propriétés mécaniques.
La présence d'entailles asymétriques s'avérait plus délétère que les propriétés symétriques des propriétés de traction obtenues à température ambiante et à 250°C, même si la surface réduite était la même en raison de l'état complexe des contraintes qui se développent à la racine de l'entaille. Les effets de diverses additions chimiques sur les
propriétés de traction des barres crantées obtenues à température ambiante et à 250°C se sont révélés faibles comparés à leurs effets évidents sur les propriétés en traction des barres lisses (non entaillées). À la température ambiante, les valeurs de résistance à la traction (NTS) étaient inférieures aux valeurs de résistance à la traction obtenues pour les barres lisses (non entaillées) correspondantes attribuées à la ductilité limitée des alliages coulés Al-Si-Cu-Mg (type 354). Le ramollissement qui a eu lieu lors des essais de traction à 250°C a rendu les alliages quelque peu ductiles, en particulier les alliages M1S à M3S. Par conséquent, les barres de traction crantées avec des trous asymétriques de ces alliages présentaient des valeurs élevées de NTS par rapport à la résistance à la traction des barres non tordues soumises à des conditions de traitement similaires, à l'exception de la condition T5 de l'alliage M2S.
La variation de la technique d'exposition thermique de statique à dynamique, a eu un effet subtil sur les données de traction et de dureté obtenues à température ambiante; ainsi, la technique d'exposition statique (stabilisation) pourrait être utilisée pour simuler le comportement du matériau employé dans une application d'exposition thermique dynamique (comme dans les composants du moteur). Le grossissement des précipités de renforcement après l'exposition prolongée à 250°C a eu un effet délétère sur les propriétés de traction et les valeurs de dureté. Une réduction notable des valeurs de résistance, en particulier la limite élastique, et une augmentation remarquable des valeurs de ductilité ont été observées en association avec une stabilisation à 250°C. Cependant, la cinétique de précipitation des précipités s'est détériorée avec le temps en raison de l'augmentation continue de la distance entre les précipités avec l'augmentation du temps d'exposition et donc une sérieuse détérioration des performances mécaniques associée à une exposition à 250°C pendant les 100 premières heures. Cependant, une exposition thermique supplémentaire jusqu'à 200 heures n'a pas entraîné de réduction supplémentaire des valeurs de résistance et de dureté.
Les valeurs de résistance mécanique: limite élastique (LE) et limite ultime (LU) obtenues à température ambiante pour les conditions stabilisées T5 étaient comparables à celles des conditions stabilisées T6, et elles étaient plus élevées dans le cas d'essais de traction à température élevée des conditions stabilisées. En ce qui concerne les valeurs de dureté, les alliages traités au T5 ont présenté des valeurs de dureté supérieures à celles des alliages traités au T6 après application du traitement de stabilisation; tandis que les alliages traités au T6 ont montré de meilleures valeurs de dureté que les alliages traités au T5 sans appliquer le traitement de stabilisation.
De manière intéressante, les résultats montrent que l'addition de 0,75% en poids de Mn était compétitive à l'addition de 2 et 4% en poids de Ni par rapport aux valeurs de résistance à température élevée et ambiante, respectivement; de plus, l'alliage contenant du Mn (alliage M3S) présentait des valeurs de ductilité améliorées à la température ambiante et à 250°C par rapport à celles des matériaux contenant du Ni. L'étude de fractographie a révélé le rôle avantageux des particules de boue dans l'amélioration des performances des alliages contenant du Mn en résistant à la propagation des fissures qui ont été développées dans de nombreuses phases intermétalliques. Cette constatation est considérée comme
économiquement significative en raison du prix plus bas du manganèse comparativement à celui du nickel.
La modification thermique des particules de silicium s'est révélée plus efficace avec des alliages modifiés au Sr plutôt qu'avec des homologues sans Sr. L'évolution des particules de silicium au cours des traitements en solution prolongée a suivi les mêmes tendances et séquences pour les alliages non modifiés de type 354 et 356 ainsi que pour les alliages de type 354 et 356 modifiés par Sr à différentes vitesses d'évolution. Le grossissement des particules de Si eutectique a été obtenu grâce à la coalescence des particules et aux mécanismes de mûrissement d'Ostwald; les deux mécanismes étaient actifs en même temps; Cependant, ils ont fonctionné de manière indépendante et additive. Les piqûres qui peuvent exister dans les particules de silicium peuvent être comprises comme l'impression (impression ou empreinte) laissée derrière la agglomération et la diffusion de petites particules avec / dans une (des) plus grande (s) particule (s).
Pour les résultats des essais de traction obtenus à température ambiante, le traitement thermique en solution a amélioré les valeurs LU et de ductilité des alliages modifiés et non modifiés au Sr au cours des 100 premières heures du traitement, suivi de la réduction des valeurs de ces propriétés par le résultat du changement morphologique des particules de Si. De plus, les valeurs LE ont resté presque inchangées. Les changements morphologiques des particules de Si ont eu un effet vraiment limité sur les propriétés de traction à haute température et cet effet limité s’est étonnamment étendue aux valeurs de la ductilité.
ABSTRACT
The main objective of this study was to understand how to enhance the mechanical performance of 354-type Al-Si-Cu-Mg cast alloys at both ambient and elevated temperatures through the addition of zirconium (Zr) as a base alloying element and subsequent additions of nickel (Ni) and manganese (Mn), to validate the use of such alloys in automotive engine applications. The motive behind these additions was to develop thermally stable microstructures capable of resisting coarsening instigated by prolonged exposure at elevated temperatures and hence preserve acceptable mechanical properties of these alloys when employed in high-temperature applications.
Examination of the data obtained from differential scanning calorimetric (DSC) and phase identification analyses shows that 354-type alloys developed complex as-cast microstructures containing the commonly existing phases, including α-Al, eutectic silicon, copper aluminide (Al2Cu) with different morphologies, Mg-rich phases such as magnesium
silicide (Mg2Si), Q-phase (Al5Cu2Mg8Si6), and Fe-based intermetallic phases including
β-Al5FeSi, α-Al15(Fe, Mn)3Si2, and π-Al8FeMg3Si6. The addition of transition elements Zr,
Ni, and Mn produced other phases such as (Al,Si)3(Ti,Zr), (Al,Si)3Zr, Al9FeNi, Al3Ni,
Al3CuNi, Al9FeSi3Ni4Zr, and α-Al15(Fe,Mn)3Si2. Nickel proved to have a retarding effect
on the kinetics of precipitation of the α-Al network and the eutectic Al-Si structure. Also, the presence of Ni consumed a considerable amount of Cu to form Al-Cu-Ni particles instead of Al2Cu particles. Comparison between DSC thermograms obtained for as-cast and
as-quenched alloys revealed that solution treatment at 495°C for 5 hours was sufficient to dissolve a large amount of Al2Cu particles in the α-Al matrix, which is mandatory for a
successful aging treatment.
With respect to the strengthening precipitates, transmission electron microscopy (TEM) investigations confirmed that the investigated alloys were strengthened primarily by θ-Al2Cu and S-Al2CuMg precipitates and their precursors, in addition to a secondary
strengthening effect by precipitates in the form of Alx(Zr,Ti)Si which formed following the
addition of Zr. The data showed that the base alloy M1S, which is a Ni-free alloy, comprised higher fractions of θ-Al2Cu precipitates than the 4 wt.% Ni-containing alloy
M4S.
Additions of Ni and Mn in different amounts and combinations increased the volume fraction of intermetallic compounds in the resulting alloys M2S through M5S, compared to the base alloy (cf. 12.21% for M4S with 2.5% for M1S), producing a significant effect on the mechanical performance. The proposed additions enhanced the mechanical performance of the alloys, namely, the ambient- and elevated-temperature tensile properties, hardness values, and impact properties. For the Mn-containing alloys, the improvement in properties was attributed to the formation of sludge particles in the form of blocky α-Al15(Fe,Mn)3Si2 alongside the script-like α-iron phase which resisted crack
in the Ni-containing alloys hindered the propagation of cracks and thus improved the mechanical properties.
The presence of asymmetric notches in the tensile test bars proved more deleterious than symmetric notches to the tensile properties obtained at ambient temperature and at 250°C, even if the reduced area was the same, owing to the complex state of stresses that develop at the notch root. The effects of various chemical additions on the tensile properties at ambient and high temperature were feeble in the case of notched bars compared to their obvious effects on the tensile properties of smooth (unnotched) bars. At ambient temperature, notch tensile strength (NTS) values were lower than the tensile strength values obtained for the corresponding smooth (unnotched) bars, attributed to the limited ductility of the Al-Si-Cu-Mg (354-type) cast alloys. The softening that took place during tensile testing at 250°C rendered the alloys some ductility, in particular, the M1S, M2S and M3S alloys. Consequently, the notched tensile bars with asymmetric holes for these alloys exhibited high NTS values compared to the tensile strength of unnotched bars subjected to similar treatment conditions, except for the M2S alloy in the T5-treated condition.
Varying the thermal exposure technique from static into dynamic had little effect on the tensile and hardness data obtained at room temperature. This permitted using the static exposure (stabilization) technique to simulate the behavior of the material under dynamic thermal exposure conditions as in the case of engine components. Coarsening of the strengthening precipitates following prolonged exposure at 250°C had a deleterious effect on the tensile properties and hardness values. Noticeable reduction in the strength values, particularly the yield strength, and a remarkable increase in the ductility values were observed. The coarsening kinetics of the precipitates decayed with time, due to the continuously increased distance between the precipitates with increase in the exposure time, causing the observed deterioration in the mechanical performance after stabilization at 250°C up to the first 100 hours. However, further thermal exposure up to 200 hours did not result in further reduction in the strength and hardness values.
The strength values (UTS and YS) obtained at room temperature for the stabilized T5-treated conditions were comparable to those of the stabilized T6-treated conditions, and higher in the case of elevated-temperature tensile testing of the stabilized conditions. With respect to the hardness values, T5-treated alloys exhibited higher hardness values than T6-treated alloys after applying the stabilization treatment. Without stabilization, however, the T6-treated alloys showed better hardness values than T5-treated ones.
Interestingly, the results showed that the addition of 0.75 wt.% Mn was competitive with the addition of 2 and 4 wt.% Ni with respect to the elevated-temperature and ambient temperature strength values, respectively. In addition, the Mn-containing alloy M3S exhibited improved ductility values at ambient temperature and at 250°C, compared to the Ni-containing alloys. Examination of the fracture surface of tested samples revealed the advantageous role of sludge particles in enhancing the performance of Mn-containing alloys through their resistance to the propagation of cracks that developed in many intermetallic phases. This finding is considered to be economically significant in view of the lower price of manganese compared to that of nickel.
Thermal modification of silicon particles proved to be more effective in the Sr-modified alloys rather than their Sr-free counterparts. The evolution of silicon particles during extended solution treatments followed the same trends and sequences for non-modified and Sr-non-modified 354- and 356-type alloys, at different evolution rates. The coarsening of eutectic Si particles occurred through particle coalescence and Ostwald ripening mechanisms. While both mechanisms were active at the same time, however, they operated independently and additively. The pinholes observed in the silicon particles derive from the impression or imprint left behind from the agglomeration of small particles with, and their diffusion into, larger particles.
With respect to the tensile test data obtained at room temperature, solution heat treatment improved the UTS and ductility values of both Sr-modified and non-modified alloys in the first 100 hours of the treatment followed by reduction in the values as a result of the morphological changes in the Si particles; however, YS values remained almost unchanged. Morphological changes in the Si particles had a very limited effect on the high temperature tensile properties and, surprisingly, this limited effect extended to the ductility values as well.
ACKNOWLEDGEMENTS
By the grace of Almighty Allah, I have been endowed the enthusiasm and strength to complete this work.
My feelings of gratitude are indebted to my advisor Prof. Fawzy Hosny Samuel for his guidance, support, providing me with every opportunity, and believing in me in all aspects of my study since the very beginning to the final stages. His advices and guidance throughout this work have been of immeasurable help; not only in academic work, but also in developing my life experiences.
A most heartfelt appreciation and gratefulness are due to Prof. Agnes-Marie Samuel, research professor at Université du Québec à Chicoutimi (Canada), for her continuous guidance, valuable assistance, and mentoring during the entire duration of the study, in addition to editing the thesis. Thank you for being a role model in morals as well as kindness and gentleness.
Also, I would like to express my gratitude to Dr. Emad Elgallad for his invaluable comments, fruitful discussions, and help in all aspects of scanning microscopy. My appreciation is extended to Dr. Mohamed Ibrahim for his technical assistance during the course of the study.
Financial support received from General Motors Powertrain Group (USA), Natural Sciences and Engineering Research Council of Canada (NSERC), and Corporativo Nemak (Mexico) is gratefully acknowledged.
Thanks are also due to Mr. Samuel Dessureault, technician of TAMLA group at UQAC, for his tremendous efforts in castings and sample preparation, as well as to Dr. David Liu, McGill University, for assisting in carrying out FESEM and TEM investigations.
Lastly but most importantly, I wish to express my heartfelt and deep gratitude to my parents, my wife, my daughter, and my sisters and dear brother for their guidance, moral support, encouragement, understanding and infinite love. I could never ever pay them back all their efforts, love, and all what they have done for me. Without their love none of this achievement would have been possible.
To all of them, thank you so much …
PUBLICATIONS
Journal Papers
1. M.H. Abdelaziz, E.M. Elgallad, H.W. Doty, S. Valtierra, F.H. Samuel, “Melting and Solidification Characteristics of Zr-, Ni-, and Mn-containing 354-type Al-Si-Cu-Mg cast alloys”, submitted to Journal of Materials Characterization, manuscript ID: MATERIALSCHAR_2018_698.
2. L. Alyaldin, M.H. Abdelaziz, A.M. Samuel, H.W. Doty, S. Valtierra, F.H. Samuel, “Effect of transition metals addition on the microstructure, incipient melting and tensile properties of 354-based alloys”, submitted to Journal of Advances in Materials Science and Engineering, manuscript ID: 8307907.
3. Alyaldin, L., M. H. Abdelaziz, A. M. Samuel, H. W. Doty, S. Valtierra, and F. H. Samuel. "Effects of Alloying Elements and Testing Temperature on the Q-Index of Al–Si Based Alloys." International Journal of Metalcasting (2018): 1-14.
4. Alyaldin, Loay, M. H. Abdelaziz, Agnes M. Samuel, Herbert W. Doty, Salvador Valtierra, and Fawzy H. Samuel. "Effect of Ni and Mn Additions on the Ambient and High-Temperature Performance of Zr-Containing Al–Si–Cu–Mg-Based Alloys: Role of Precipitation Hardening." International Journal of Metalcasting (2018): 1-14.
5. Elsharkawi, E. A., M. H. Abdelaziz, H. W. Doty, S. Valtierra, and F. H. Samuel. "Effect of β-Al 5 FeSi and π-Al 8 Mg 3 FeSi 6 Phases on the Impact Toughness and Fractography of Al–Si–Mg-Based Alloys." International Journal of Metalcasting 12, no. 1 (2018): 148-163.
6. M. H. Abdelaziz, M. Paradis, A. M. Samuel, H. W. Doty, and F. H. Samuel, “Effect of Aluminum Addition on the Microstructure, Tensile Properties, and Fractography of Cast Mg-Based Alloys.” Advances in Materials Science and Engineering, vol.
2017, Article ID 7408641, 10 pages, 2017. doi:10.1155/2017/7408641.
7. Paradis, M., M. H. Abdelaziz, A. M. Samuel, H. W. Doty, and F. H. Samuel. "Effect of Mold Type on the Microstructure and Tensile Properties of A356 Alloy." International Journal of Metalcasting 11, no. 3 (2017): 523-535.
8. Paradis, M., M. H. Abdelaziz, H. W. Doty, and F. H. Samuel. "On the Mechanical Properties of Lost Foam Cast A356 Automotive Components: Effects of Melt Treatment and Solidification Conditions." International Journal of Metalcasting11, no. 3 (2017): 494-505.
Book Chapter
9. Ibrahim, Mohamed F., Mohamed H. Abdelaziz, Herbert W. Doty, Salvador Valtierra, and Fawzy H. Samuel. "Effect of Microalloying Elements on the Heat Treatment Response and Tensile Properties of Al-Si-Mg Alloys." In Solidification. InTech, 2018.
Manuscripts under Preparation
10. M.H. Abdelaziz, E.M. Elgallad, H.W. Doty, S. Valtierra, F.H. Samuel, “Precipitation strengthening in transition elements-containing 354-based alloys” 11. M.H. Abdelaziz, H.W. Doty, S. Valtierra, F.H. Samuel, “Mechanical performance
of Zr-containing 354-type Al-Si-Cu-Mg cast alloy: Part I- Role of additions and heat treatment”
12. M.H. Abdelaziz, H.W. Doty, S. Valtierra, F.H. Samuel, “Mechanical performance of Zr-containing 354-type Al-Si-Cu-Mg cast alloy: Part II- Role of geometrical discontinuities”
13. M.H. Abdelaziz, A.M. Samuel, H.W. Doty, S. Valtierra, F.H. Samuel, “Effect of static versus dynamic thermal exposure on the mechanical performance of transition metals-containing Al-Si-Cu-Mg cast alloy”
14. M.H. Abdelaziz, A.M. Samuel, H.W. Doty, S. Valtierra, F.H. Samuel, “Mechanical behavior of transition metals-containing Al-Si-Cu-Mg cast alloy subjected to prolonged thermal exposure”
15. M.H. Abdelaziz, M.F. Ibrahim, H.W. Doty, S. Valtierra, F.H. Samuel, “Evolution of eutectic silicon particles during extended solution treatment: PartI: Metallographic study”
16. M.H. Abdelaziz, A.M. Samuel, H.W. Doty, S. Valtierra, F.H. Samuel, “Evolution of eutectic silicon particles during extended solution treatment: PartII: Quantitative study”
17. M.H. Abdelaziz, H.W. Doty, S. Valtierra, F.H. Samuel, “Effect of extended solution treatment on the mechanical performance of Zr-containing 354-type alloys and 356-type alloys”
TABLE OF CONTENTS
RÉSUMÉ... i ABSTRACT ... iv ACKNOWLEDGEMENTS ... vii PUBLICATIONS ... viii TABLE OF CONTENTS ... xLIST OF FIGURES ... xiv
LIST OF TABLES ... xxv
CHAPTER 1 INTRODUCTION AND OBJECTIVES ... 1
1.1 SYNOPSIS AND PROBLEM STATEMENT ... 2
1.2 RESEARCH OBJECTIVES ... 6
1.3 RESEARCH OUTLINE ... 8
CHAPTER 2 SURVEY OF THE LITERATURE ... 11
2.1 INTRODUCTION ... 12
2.2 ALUMINUM-SILICON CAST ALLOYS ... 13
2.2.1 354 (Al-Si-Cu-Mg) ALLOY SYSTEM ... 18
2.2.2 356 (Al-Si-Mg) ALLOY SYSTEM ... 19
2.3 METALLURGICAL ASPECTS ... 22
2.3.1 PROCESSING TECHNIQUE ... 23
2.3.1.1 TRADITIONAL ALLOYING ELEMENTS ... 23
2.3.1.2 MELT TREATMENT ... 33
2.3.2 HEAT TREATMENT ... 36
2.3.2.1 SOLUTION HEAT TREATMENT ... 40
2.3.2.2 QUENCHING ... 41
2.4 ROLE OF SOLUTION TREATMENT IN MICROSTRUCTURE EVOLUTION ..
... 48
2.4.1 DISSOLUTION OF SOLUBLE INTERMETALLIC COMPOUNDS ... 49
2.4.2 HOMOGENIZATION OF THE AS-CAST STRUCTURE ... 50
2.4.3 MORPHOLOGICAL CHANGES OF EUTECTIC SILICON ... 50
2.5 STRENGTHENING MECHANISMS IN AL ALLOYS ... 53
2.5.1 SECOND PHASE PARTICLE STRENGTHENING ... 53
2.5.2 PRECIPITATION STRENGTHENING ... 55
2.6 TAILORING AL ALLOYS FOR ELEVATED-TEMPERATURE APPLICATIONS USING TRANSITION ELEMENT ADDITIONS ... 59
2.6.1 SELECTION CRITERIA OF TRANSITION ELEMENTS ... 60
2.6.2 ZIRCONIUM ... 64
2.6.3 NICKEL ... 69
2.7 THERMAL EXPOSURE ... 73
2.8 CONCEPT OF QUALITY INDICES AND CHARTS ... 75
2.8.1 QUALITY INDEX (Q) PROPOSED BY DROUZY ET AL. ... 76
2.8.2 QUALITY INDEX (QC) PROPOSED BY CÁCERES ... 80
2.9 GEOMETRICAL DISCONTINUITIES (NOTCHES) ... 87
2.9.1 EFFECT OF NOTCHES ... 88
CHAPTER 3 METHODOLOGY AND EXPERIMENTAL PROCEDURES ... 91
3.1 INTRODUCTION ... 92
3.2 MATERIALS AND ALLOYS ... 93
3.3 MELTING AND CASTING ... 95
3.3.1 HIGH COOLING RATE CASTING ... 96
3.3.2 SLOW COOLING RATE CASTING ... 100
3.4 HEAT TREATMENT ... 101
3.5 MACHINING OF NOTCHES ... 107
3.6 MECHANICAL TESTING ... 111
3.6.2 ELEVATED-TEMPERATURE TENSILE TESTING ... 112
3.6.3 HARDNESS TESTING ... 112
3.6.4 IMPACT TESTING ... 114
3.7 METALLOGRAPHY - MICROSTRUCTURAL CHARACTERIZATION ... 115
3.7.1 DSC ANALYSIS ... 116
3.7.2 OPTICAL METALLOGRAPHY ... 118
3.7.3 SILICON PARTICLE CHARACTERISTICS ... 121
3.7.4 SCANNING ELECTRON MICROSCOPY ... 125
3.7.5 TRANSMISSION ELECTRON MICROSCOPY ... 126
CHAPTER 4 MICROSTRUCTURAL CHARACTERIZATION ... 129
4.1 INTRODUCTION ... 130
4.2 MELTING AND SOLIDIFCATION CHARACTERISTICS ... 132
4.2.1 EFFECT OF ALLOYING ELEMENTS ON ALLOY STRUCTURE ... 144
4.2.1.1 BASE ALLOY M1S (354 + 0.3% Zr) ... 146
4.2.1.2 ALLOY M2S (354 + 0.3% Zr + 2% Ni) ... 148
4.2.1.3 ALLOY M3S (354 + 0.3% Zr + 0.75%Mn) ... 153
4.2.1.4 ALLOY M4S (354 + 0.3% Zr + 4% Ni) ... 155
4.2.1.5 ALLOY M5S (354 + 0.3% Zr + 2% Ni + 0.75% Mn) ... 157
4.3 CHARACTERIZATION OF THE STRENGTHENING PRECIPITATES ... 159
4.3.1 DSC HEATING CURVES OF AS-QUENCHED SAMPLES ... 161
4.3.2 TRANSMISSION ELECTRON MICROSCOPY INVESTIGATIONS ... 167
CHAPTER 5 ROLE OF ADDITIONS, HEAT TREATMENTS, AND GEOMETRICAL DISCONTINUITIES ... 189
5.1 INTRODUCTION ... 190
PART I- MICROSTRUCTURE CHARACTERIZATION OF TEST BARS ... 191
5.2 EFFECT OF SOLUTION TREATMENT ON INTERMETALLIC COMPOUNDS ... 192
PART II- CHARACTERIZATION OF THE MECHANICAL PERFORMANCE ... 204
5.4 TENSILE PROPERTIES ... 205
5.4.1 AMBIENT-TEMPERATURE TENSILE PROPERTIES OF SMOOTH BARS ... 205
5.4.1.1 TENSILE PROPERTIES OF AS-CAST AND AS-QUENCHED CONDITIONS ... 209
5.4.1.2 TENSILE PROPERTIES OF T5- AND T6-TREATED CONDITIONS . 213 5.4.1.3 EFFECT OF HEAT TREATMENT ON YIELD STRENGTH VALUES ... ... 223
5.4.2 AMBIENT-TEMPERATURE TENSILE PROPERTIES OF NOTCHED BARS ... 228
5.4.2.1 SYMMETRIC VERSUS ASYMMETRIC NOTCHES... 229
5.4.2.2 EFFECT OF ASYMMETRIC NOTCHES ON AMBIENT-TEMPERATURE TENSILE PROPERTIES ... 232
5.4.3 ELEVATED-TEMPERATURE TENSILE PROPERTIES OF SMOOTH BARS ... 236
5.4.4 ELEVATED-TEMPERATURE TENSILE PROPERTIES OF NOTCHED BARS ... 245
5.4.5 COMPARISON BETWEEN AMBIENT- AND ELEVATED-TEMPERATURE TENSILE PROPERTIES OF SMOOTH BARS ... 250
5.5 HARDNESS VALUES ... 257
5.6 IMPACT PROPERTIES ... 260
CHAPTER 6 PROLONGED THERMAL EXPOSURE ... 266
6.1 INTRODUCTION ... 267
6.2 STATIC VERSUS DYNAMIC THERMAL EXPOSURE ... 269
6.2.1 AMBIENT-TEMPERATURE TENSILE PROPERTIES ... 270
6.2.1.1 EFFECT OF STABILIZATION ON THE EVOLUTION OF YIELD STRENGTH VALUES ... 279
6.2.2 HARDNESS VALUES ... 296
6.3 INFLUENCE OF THERMAL EXPOSURE ON AMBIENT-TEMPERATURE MECHANICAL PROPERTIES ... 299
6.3.1 AMBIENT-TEMPERATURE TENSILE PROPERTIES ... 299
6.3.2 HARDNESS VALUES ... 307
6.4 INFLUENCE OF THERMAL EXPOSURE ON ELEVATED-TEMPERATURE TENSILE PROPERTIES ... 311
6.4.1 ELEVATED-TEMPERATURE TENSILE PROPERTIES ... 311
6.4.2 FRACTOGRAPHY ... 329
CHAPTER 7 EXTENDED SOLUTION TREATMENT ... 344
7.1 INTRODUCTION ... 345
PART I- EVOLUTION OF EUTECTIC SILICON PARTICLES DURING EXTENDED SOLUTION-HEAT TREATMENT ... 346
7.2 CHARACTERIZATION OF EUTECTIC SILICON PARTICLES ... 348
7.2.1 QUALITATIVE ANALYSIS ... 349
7.2.2 DEEP ETCHED SAMPLES ... 353
7.2.3 ADJUSTING CRITERION FOR SILICON PARTICLE SIZE ... 362
7.2.4 QUANTITATIVE ANALYSIS ... 363
7.2.5 DISTRIBUTION ANALYSIS OF SI PARTICLES ... 365
7.2.6 AVERAGE SI PARTICLE CHARACTERISTICS ... 374
7.3 DISCUSSION ON THE COARSENING BEHAVIOR ... 381
PART II- EFFECT OF MORPHOLOGICAL CHANGES OF EUTECTIC SILICON PARTICLES ON THE TENSILE PROPERTIES ……….386
7.4 ROOM TEMPERATURE TENSILE PROPERTIES ... 386
7.5 ELEVATED TEMPERATURE TENSILE PROPERTIES ... 394
CHAPTER 8 CONCLUSIONS ... 397
8.1 INTRODUCTION ... 398
8.2 CONCLUSIONS ... 399
8.3 RECOMMENDATIONS FOR FUTURE WORK ... 408
LIST OF FIGURES
Chapter 1
Figure 1.1 Development of specific performance and ignition pressure of passenger car.8 ... 4
Figure 1.2 The growing percentage of light alloys use in automotive vehicles.10 ... 4
Chapter 2
Figure 2.1 Aluminum-rich portion of the Al-Si phase diagram.33 ... 15
Figure 2.2 Cast Al-Si alloys (a) Microstructure of hypoeutectic Al-Si alloy 150X. (b) Microstructure of eutectic Al-Si alloy 400X. (c) Microstructure of
hypereutectic Al-Si alloy 150X.27 ... 15
Figure 2.3 Schematic representation of a dendrite.25, 35 ... 16
Figure 2.4 (a) Growth of a lamellar eutectic, and (b) lamellar eutectic schematic
representation.25 ... 17
Figure 2.5 Schematic representation of factors affecting alloy performance. ... 22
Figure 2.6 Ambient temperature tensile properties of Al-9%Si-0.5%Mg cast alloy with different Cu contents and subjected to T6 and T62 tempers.37 ... 25
Figure 2.7 Cu-rich phases in as-cast 319 alloy: (a) Eutectic Al2Cu and (b) blocky
Al2Cu.50... 26
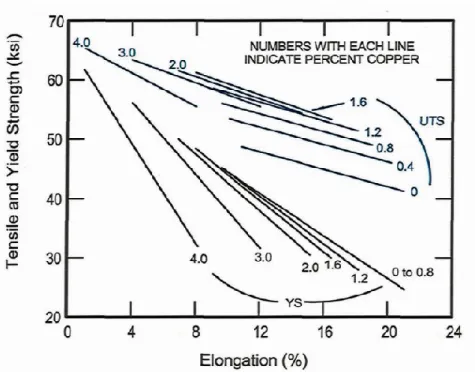
Figure 2.8 Quality chart illustrating the influence of the content of Cu and other elements (Mg, Si, Fe, and Mn) and cooling rate, as indicated by arrows, on the strength and quality index of Al-Si-Cu-Mg alloys. The numbers 1
through 21 located in the chart represent various alloy compositions.58 ... 28
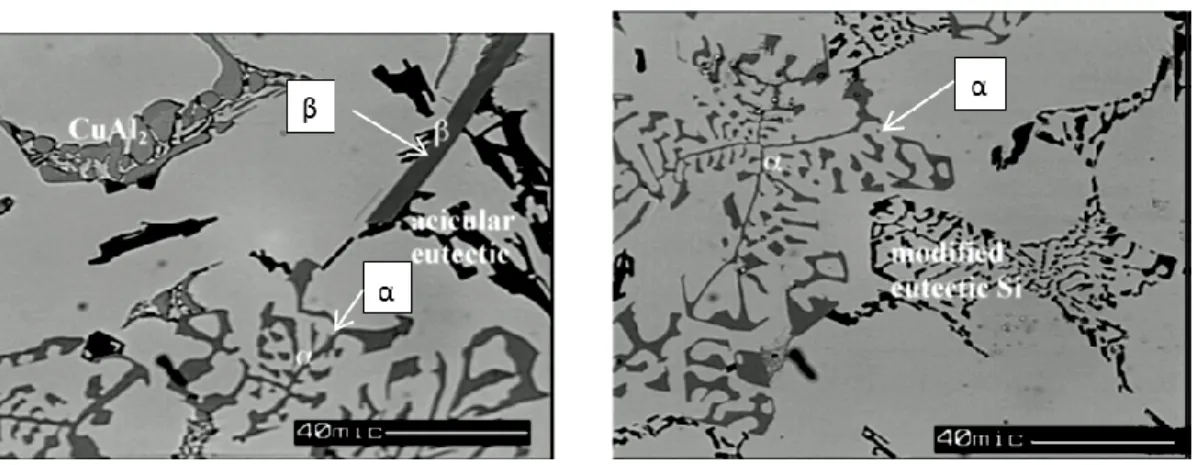
Figure 2.9 Optical micrographs obtained from an as-cast 319 alloy showing the morphology of β-Fe and α-Fe intermetallic phases.59
... 29
Figure 2.10 Influence of Fe-level on the ductility of modified and unmodified 356-T6 alloys.64 ... 29
Figure 2.11 Simplified phase diagrams of the Al-Fe-Si system at constant Mn levels of (a) 0%, (b) 0.1%, (c) 0.2%, and (d) 0.3%.69 ... 31
Figure 2.12 Silicon morphologies in (a) unmodified, (b) Sr-modified (300 ppm Sr) and (c) Sb-modified (2400 ppm Sb) hypoeutectic aluminum–silicon alloys.81 ... 34
Figure 2.13 Schematic representation of the melt degassing process using a rotating impeller.86 ... 36
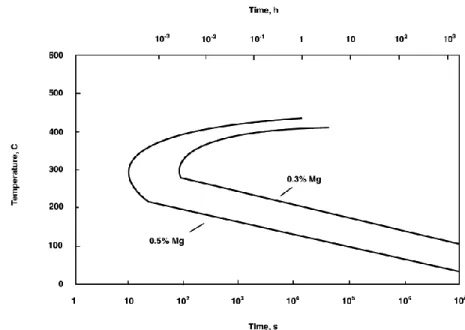
Figure 2.15 Minimum time to avoid precipitation during quenching of Al alloys
depending on the Mg content (in wt.%).38 ... 43
Figure 2.16 Schematic representations for the stages of forming the equilibrium precipitate (θ). (a) Supersaturated α solid solution. (b) Transition θ’’ precipitates. (c) Equilibrium θ phase, within the α-matrix. Actual phase particle sizes are much larger than shown.91 ... 46
Figure 2.17 Schematic diagram showing strength and hardness as a function of the logarithm of aging time at constant temperature during the aging treatment.91 ... 47
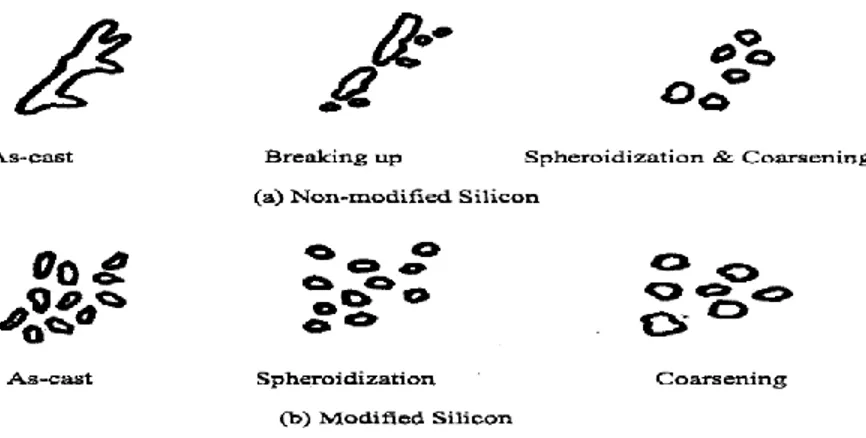
Figure 2.18 Schematic diagram showing change of eutectic Si particles morphology during solution heat treatment: (a) non-modified and (b) modified Al-Si cast alloys.132 ... 51
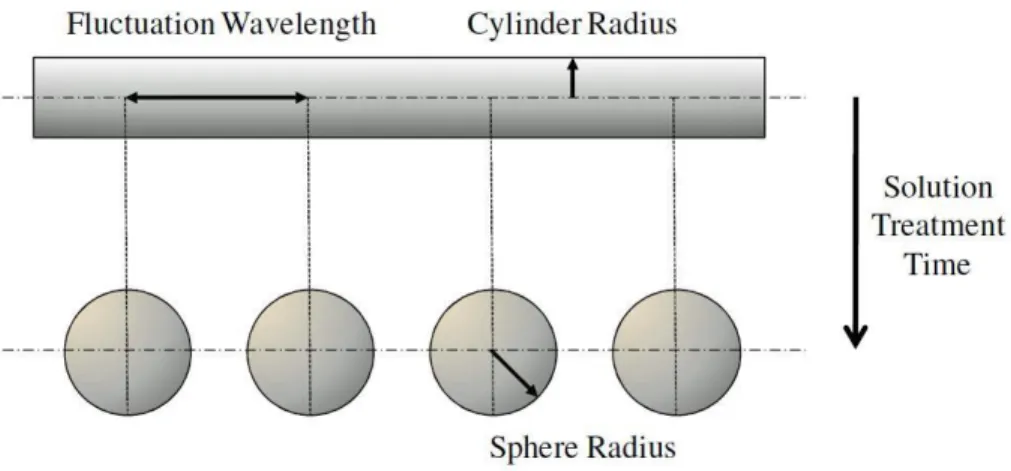
Figure 2.19 Schematic illustrating a rod-shaped eutectic particle that fragments into a series of spherical particles.134 ... 52
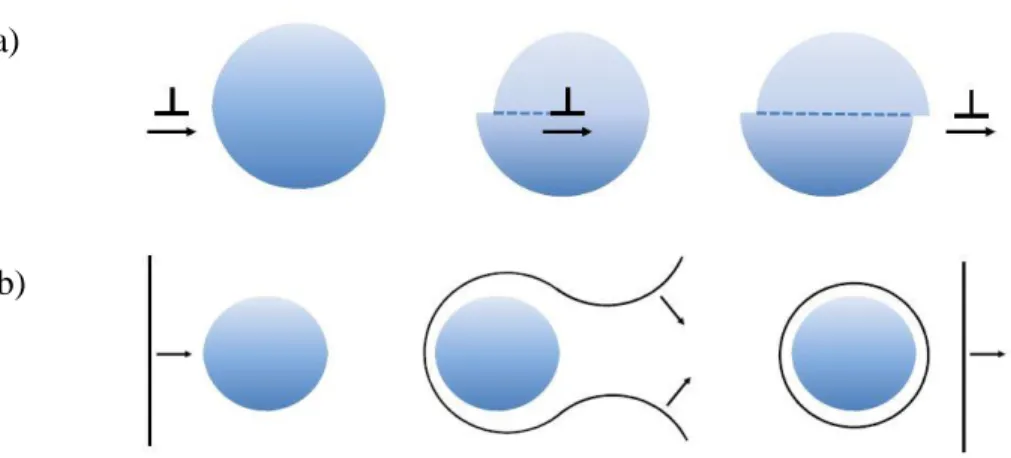
Figure 2.20 Schematic representation of dislocation movement according to: (a) Friedel effect and (b) Orowan-looping mechanism.88, 139 ... 56
Figure 2.21 Relationship between precipitate radius and strength of the particles to resist shearing or bypassing by dislocations.14 ... 57
Figure 2.22 The balance of forces between a moving dislocation and a precipitate
resisting its motion.139, 140 ... 58
Figure 2.23 The possible trialuminide structures (a) L12, (b) D022, and (c) D023.147 ... 64
Figure 2.24 Equilibrium Al-rich Al-Zr binary phase diagram.156 ... 66
Figure 2.25 SEM micrographs of Al3Zr (L12) precipitates in Al-0.2Zr at.% aged at
425°C for 400h, showing an inhomogeneous distribution of Al3Zr
precipitates within the dendrites.157 ... 67
Figure 2.26 Binary Al-Ni phase diagram.31 ... 70
Figure 2.27 Example of the quality chart proposed by Drouzy et al.60 with Q and iso-YS lines generated using Equations 2.9 and 2.10. ... 78
Figure 2.28 Effects of overaging in tensile properties of a 201 alloy.180 ... 79
Figure 2.29 A log-log plot of true stress versus true strain for calculating n and K values in Equation 2.11.185, 186 ... 81
Figure 2.30 Determining the beginning of necking based on the true-stress/true-strain curve during tensile testing.185, 186 ... 82
Figure 2.31 Example of the quality chart proposed by Cáceres illustrating iso-flow and iso-q lines generated using Equations 2.15 and 2.16, respectively, with K= 511 MPa.173 ... 84
Figure 2.32 Two models of quality charts for the A356 alloy; the dashed lines are iso-Q and iso-YS lines calculated from Equations 2.9 and 2.10, respectively. The solid lines are iso-flow lines and iso-q lines calculated using Equations 2.15 and 2.16, respectively, with K = 430 MPa.62, 178, 183, 184, 188 ... 86
Figure 2.33 Cylindrical Notched bar.206 ... 90
Chapter 3
Figure 3.1 (a) Electrical resistance furnace, and (b) Graphite impeller used in degassing process. ... 97
Figure 3.2 ASTM B-108 permanent mold and casting. ... 98
Figure 3.3 Geometry of the standard tensile test bar obtained from ASTM B-108 permanent mold. ... 98
Figure 3.4 (a) Star-like mold, (b) Geometry of the star-like mold casting, and (c) Impact test bars. ... 99
Figure 3.5 L-Shape castings: (a) L-shape mold, (b) Geometry of the L-shape casting, (c) Cutting sequence of L-shaped casting to produce smaller rectangular bars, and (d) Hardness test bars. ... 100
Figure 3.6 Slow cooling rate casting set-up: (a) Electrical resistance furnace, and (b) Cylindrical graphite mold used for casting. ... 101
Figure 3.7 Schematic illustration describing the activity of thermal exposure: (a) Static stabilization and (b) Dynamic stabilization. ... 104
Figure 3.8 Lindberg Blue M electric furnace used for heat treatment. ... 106
Figure 3.9 Schematic diagram showing details of notches machined in tensile test bars: (a) specimen with symmetric V-notch, (b) details of the symmetric V-notch, (c) specimen with asymmetric notch, (d) details of the asymmetric V-notch, (e) specimen and details of the symmetric hole, (f) specimen and details of the asymmetric hole. ... 110
Figure 3.10 (a) MTS Mechanical Testing machine used for room temperature tensile testing, and (b) the attachable extensometer. ... 111
Figure 3.11 Instron Universal mechanical testing machine with a chamber for high temperature testing. ... 113
Figure 3.12 Rockwell hardness tester. ... 113
Figure 3.13 A computer-aided instrumented SATEC SI-1 Universal impact testing machine, with a Dynatup IPM/PC impact testing system for data acquisition. ... 115
Figure 3.14 Perkin Elmer DSC 8000 apparatus. ... 117
Figure 3.15 DSC curve: (a) Corrective curve, (b) Sample curve, and (c) true DSC curve. . ... 118
Figure 3.16 Schematic representation of the sectioned area of a tensile-tested bar
prepared for metallographic analysis. ... 119
Figure 3.17 Struers LaboPress-3 (left), and TegraForce-5 (right) machines, for mounting and polishing samples for metallography. ... 120
Figure 3.18 Optical microscope and Clemex Vision PE image-analysis system used in the current study. ... 120
Figure 3.19 Preparing to quantify the characteristics of eutectic Si particles by
thresholding (coloring) the Si particles. ... 121
Figure 3.20 Schematic representation showing the projection of the Si particle at a plane, the equivalent circle with the same area (A), and the equivalent circular diameter (d). ... 123
Figure 3.21 Schematic representation showing the best fit ellipse to the projection of the Si particle at a plane. ... 124
Figure 3.22 Schematic representation showing the projection of the Si particle at a plane and parameters to measure the sphericity. ... 124
Figure 3.23 JEOL JSM.6480LV scanning electron microscope used in this study. ... 125
Figure 3.24 Hitachi-SU-8000 field emission scanning electron microscope used in the current study. ... 126
Figure 3.25 FEI Tecnai G2 F20 Electron Microscope. ... 127
Figure 3.26 The UniMill IV7 fully automated ion beam thinning system. ... 128
Chapter 4
Figure 4.1 DSC heating and cooling (solidification) curves of: (a) M1S, (b) M2S, (c) M3S, (d) M4S, and (e) M5S alloys. The numbers on the curves refer to the phase transformation (Table 4.1). ... 141
Figure 4.2 Portion of the DSC heating curves of as-cast and as-quenched samples of: (a) M1S, (b) M2S, (c) M3S, (d) M4S, and (e) M5S alloys. ... 144
Figure 4.3 (a) Optical micrograph at 200X magnification, and (b) backscattered
electron image of M1S (354+ 0.3wt.% Zr) alloy, obtained at low cooling rate of 0.35 °C/s, showing the different phases present in the alloy; (c-f) EDS spectra corresponding to Al2Cu, (Al,Si)3(Ti,Zr), Q-Al5Mg8Cu2Si6,
(Al,Si)3Zr, and β-Al5FeSi phases observed in (b). ... 148
Figure 4.4 (a) Optical micrograph at 200X magnification, and (b) backscattered electron image of M2S (354+ 0.3 wt.% Zr+ 2 wt.% Ni) alloy, obtained at low cooling rate of 0.35 °C/s, showing the different phases present in the alloy; (c-g) EDS spectra corresponding to Al9FeNi, Al3Ni,
Figure 4.5 (a) Backscattered electron image of alloy M2S (M1S+ 2 wt.% Ni) alloy, and (b) through (g) corresponding X-ray maps showing distribution of elements in (a). ... 153
Figure 4.6 (a) Optical micrograph at 200X magnification, and (b and c) backscattered electron image of M3S (354+ 0.3 wt.% Zr+ 0.75 wt.% Mn) alloy, obtained at low cooling rate of 0.35 °C/s, showing the different phases present in the alloy; (d and e) EDS spectra corresponding to script-like and sludge forms, respectively, of α-Al15(Fe,Mn)3Si2 phase observed in (b) and (c),
respectively. ... 155
Figure 4.7 (a) Optical micrograph at 200X magnification, and (b) backscattered electron image of M4S (354+ 0.3 wt.% Zr+ 4 wt.% Ni) alloy, obtained at low cooling rate of 0.35 °C/s, showing the different phases present in the alloy; (c-e) EDS spectra corresponding to Al9FeNi, Al3Ni, and
Al9FeSi3Ni4Zr phases observed in (b). ... 157
Figure 4.8 (a) Optical micrograph at 200X magnification, and (b) backscattered electron image of M5S (354+ 0.3 wt.% Zr+ 2 wt.% Ni+ 0.75 wt.% Mn) alloy, obtained at low cooling rate of 0.35 °C/s, showing the different phases present in the alloy; (c-e) EDS spectra corresponding to Q-Al5Mg8Cu2Si6,
Al3Ni, and sludge (α-Al15(Fe,Mn)3Si2 phases observed in (b). ... 159
Figure 4.9 Isothermal section of the ternary Al-Cu-Mg phase diagram at 200°C.228 .. 161
Figure 4.10 DSC heating curves of the as-quenched alloys M1S through M5S obtained at 10 °C/min. ... 163
Figure 4.11 Separation of the overlapped peaks B, C, and D exist in Figure 4.10 into three Gaussian peaks for alloys: (a) M1S, (b) M2S, (c) M3S, (d) M4S, and (e) M5S. ... 166
Figure 4.12 (a) Bright-field TEM image of alloy M1S in T6-treated condition, and (b) the selected area electron diffraction (SAED) pattern. ... 169
Figure 4.13 (a) Bright-field TEM image for alloy M1S in T6-treated condition, and (b) EDS spectrum corresponding to point B in (a). ... 170
Figure 4.14 High angle annular dark field (HAADF) image obtained for the base alloy (M1S) in the T6-treated condition. ... 171
Figure 4.15 (a) High resolution bright field TEM image for the T6-treated base alloy M1S, (b) Inverse fast Fourier transition (IFFT) image for the area enclosed by the red square in (a), and (c) The enclosed area by the white rectangle in (b) at increased magnification. ... 172
Figure 4.16 Bright-field TEM image for alloy M4S in T6-treated condition, and (b) the selected area electron diffraction (SAED) pattern. ... 173
Figure 4.17 (a) Bright-field TEM image for alloy M4S in T6-treated condition, (b and c) EDS spectra corresponding to points A and B in (a), respectively. ... 175
Figure 4.18 Bright-field TEM image for the T6-treated alloy M1S after stabilization at 250°C for 200 hours, and (b) the selected area electron diffraction (SAED) pattern. ... 176
Figure 4.19 (a) High angle annular dark field (HAADF) image for the T6-treated alloy M1S after stabilization at 250°C for 200 hours, and (b through g)
corresponding X-ray maps showing distribution of elements in (a). ... 178
Figure 4.20 (a) Bright-field TEM image for the T6-treated alloy M1S after stabilization at 250°C for 200 hours, (b) Corresponding high angle annular dark field (HAADF) image for BF image in (a), and (c through h) corresponding X-ray maps showing distribution of elements in (b). ... 180
Figure 4.21 (a) Bright-field TEM image for the T6-treated alloy M1S after stabilization at 250°C for 200 hours, (b) Corresponding high angle annular dark field (HAADF) image for BF image in (a), and (c through h) corresponding X-ray maps showing distribution of elements in (b). ... 182
Figure 4.22 (a) Bright-field TEM image for the T6-treated base alloy M1S following stabilization at 250°C for 200 hours showing coarsened Al2Cu particle, and (b) High resolution bright field TEM image for the circled area A in (a), the insert is the fast Fourier transition (FFT) pattern obtained for this image. . 183
Figure 4.23 High resolution bright-field TEM image for the T6-treated base alloy M1S after stabilization at 250°C for 200 hours, the insert is the fast Fourier transition (FFT) pattern obtained for this image. ... 184
Figure 4.24 Bright field TEM image for the T6-treated alloy M4S after stabilization at 250°C for 200 hours, and (b) the selected area electron diffraction (SAED) pattern. ... 185
Figure 4.25 (a) High angle annular dark field (HAADF) image for the T6-treated alloy M4S after stabilization at 250°C for 200 hours, and (b through h)
corresponding X-ray maps showing distribution of elements in the area enclosed by the red rectangle (a). ... 186
Figure 4.26 (a) High angle annular dark field (HAADF) image for the T6-treated alloy M4S after stabilization at 250°C for 200 hours, and (b through h)
corresponding X-ray maps showing distribution of elements in the area enclosed by the red rectangle (a). ... 188
Chapter 5
Figure 5.1 Backscattered electron images for as-cast (left) and solution-heat treated (right) conditions of the alloys studied: (a, b) M1S (base alloy), (c, d) M2S (2 wt.% Ni), (e, f) M3S (0.75 wt.% Mn), (g, h) M4S (4 wt.% Ni), and (i, j) M5S (2 wt.% Ni + 0.75 wt.% Mn). ... 196
Figure 5.2 Optical micrographs at 500X showing the morphology of the eutectic silicon in alloy M1S (354+0.3wt%Zr): (a) As-cast and (b) after SHT @495°C/5h. ... 199
Figure 5.3 Optical micrographs at 500X showing the morphology of the eutectic silicon in alloy M2S (M1S+ 2wt% Ni): (a) As-cast and (b) after SHT @495°C/5h. ... 200
Figure 5.4 Optical micrographs at 500X showing the morphology of the eutectic silicon in alloy M3S (M1S+ 0.75wt% Mn): (a) As-cast and (b) after SHT
@495°C/5h. ... 200
Figure 5.5 Optical micrographs at 500X showing the morphology of the eutectic silicon in alloy M4S (M1S+ 4wt% Ni): (a) As-cast and (b) after SHT @495°C/5h. ... 200
Figure 5.6 Optical micrographs at 500X showing the morphology of the eutectic silicon in alloy M5S (M1+ 2wt% Ni + 0.75wt% Mn): (a) As-cast and (b) after SHT @495°C/5h. ... 201
Figure 5.7 Average eutectic silicon particle areas in as-cast and SHT conditions of the alloys studied. ... 203
Figure 5.8 Average roundness and sphericity percentage values of eutectic silicon particles in as-cast and SHT conditions of the alloys studied. ... 203
Figure 5.9 Variation in average (a) UTS, YS, and (b) %El values of the alloys studied in as-cast, solution heat-treated (SHT), T5- and T6-treated conditions
obtained at ambient temperature for smooth bars. ... 208
Figure 5.10 Tensile properties: (a) UTS, (b) YS, and (c) ductility, of the studied alloys in as-cast and SHT conditions tested at ambient temperature using smooth bars. 213
Figure 5.11 Tensile properties: (a) UTS, (b) YS, and (c) ductility, of the studied alloys in T5- and T6-treated conditions tested at ambient temperature using smooth bars. ... 217
Figure 5.12 Cáceres quality chart representing the relation between the UTS and the percent plastic deformation values of the alloys studied in the as-cast, SHT, T5- and T6-treated conditions obtained at ambient temperature for smooth bars. ... 222
Figure 5.13 Notch tensile strength (NTS) and ductility values of the alloys studied: (a) M1S, (b) M2S, (c) M3S, (d) M4S, and (e) M5S, in T5- and T6-treated conditions obtained at ambient temperature for notched bars. ... 231
Figure 5.14 Variation in: (a) notch tensile strength (NTS) and (b) ductility values of the alloys studied in the as-cast, T5- and T6-treated conditions obtained at ambient temperature for notched bars. ... 235
Figure 5.15 Notch strength ratio (NSR) values of the alloys studied in the as-cast, T5- and T6-treated conditions obtained at ambient temperature for notched bars: (a) Asymmetric hole, and (b) Asymmetric V-notch. ... 236
Figure 5.16 Variation in average (a) UTS, YS, and (b) %El values of the alloys studied in the as-cast, solution heat-treated (SHT), T5- and T6-treated conditions obtained at 250°C for smooth bars. ... 241
Figure 5.17 Drouzy quality chart representing the relation between the UTS and the percent elongation to fracture values of the alloys studied in the as-cast, T5- and T6-treated conditions obtained at 250°C for smooth bars. ... 244
Figure 5.18 Variation in: (a) notch tensile strength (NTS) and (b) ductility values of the alloys studied in T5- and T6-treated conditions obtained at 250°C for
notched bars. ... 247
Figure 5.19 Notch strength ratio (NSR) values of the alloys studied in T5- and T6-treated conditions obtained at 250°C for notched bars: (a) Asymmetric hole, and (b) Asymmetric V-notch. ... 249
Figure 5.20 Variation in (a) strength values and (b) ductility values of the alloys studied in as-cast, T5-, and T6-treated conditions obtained at ambient temperature and 250°C for smooth bars. ... 255
Figure 5.21 Drouzy quality charts representing the variation in the alloy quality of the alloys studied in: (a) as-cast, (b) T5-treated, and (c) T6-treated conditions obtained at ambient temperature and 250°C for smooth bars. ... 257
Figure 5.22 Variation in Rockwell hardness value (HRF) as a function of heat-treatment conditions for the alloys studied. ... 260
Figure 5.23 Variation in total impact energy value as a function of heat-treatment
conditions for the alloys studied. ... 265
Figure 5.24 Correlation between impact energy and ductility values of the alloys studied in the solution-heat treated condition. ... 265
Chapter 6
Figure 6.1 Variation in average UTS, YS, and %El values for alloys M1S through M3S in the T6-treated condition, and after static and dynamic stabilization at 250°C for 5h, 10h, 25h, 50h, 100h, and 200h (testing at ambient
temperature). ... 275
Figure 6.2 Cáceres quality chart representing the relation between the UTS and the percent plastic deformation of alloys M1S through M3S in the T6 condition, and after static and dynamic stabilization at 250°C for 5h, 10h, 25h, 50h, 100h, and 200h (testing at ambient temperature). ... 278
Figure 6.3 Percentage contributions of microstructural constituents to the overall yield strength of alloy M1S in (a) the T6 condition, and after static stabilization at 250°C for (b) 5h, (c) 10h, (d) 25h, (e) 50h, (f) 100h, and (g)200h (testing at ambient temperature). ... 281
Figure 6.4 Percentage contributions of microstructural constituents to the overall yield strength of alloy M2S in (a) the T6 condition, and after static stabilization at 250°C for (b) 5h, (c) 10h, (d) 25h, (e) 50h, (f) 100h, and (g)200h (testing at ambient temperature). ... 282
Figure 6.5 Percentage contributions of microstructural constituents to the overall yield strength of alloy M3S in (a) the T6 condition, and after static stabilization at 250°C for (b) 5h, (c) 10h, (d) 25h, (e) 50h, (f) 100h, and (g)200h (testing at ambient temperature). ... 283
Figure 6.6 Precipitate strengthening contribution versus the stabilization time for alloys M1S through M3S. ... 284
Figure 6.7 Secondary electron images showing the distribution of fine dispersoids in treated conditions of alloys: (a) M1S, and (b) M2S alloys in the T6-treated condition. ... 287
Figure 6.8 Secondary electron images showing the distribution of strengthening
precipitates in T6-treated conditions after stabilization at 250°C for 50 hours for alloys: (a, and c) M1S, and (b, and d) M2S. ... 288
Figure 6.9 Secondary electron images showing the distribution of strengthening
precipitates in T6-treated alloys after stabilization at 250°C for 100 hours for alloys: (a, and c) M1S alloy, and (b, and d) M2S alloy. ... 290
Figure 6.10 Secondary electron images showing the distribution of strengthening
precipitates in T6-treated alloys after stabilization at 250°C for 200 hours for alloys: (a, and c) M1S alloy, and (b, and d) M2S alloy. ... 291
Figure 6.11 Backscattered electron images showing the density of precipitates in the T6-treated condition after stabilization at 250°C for 200 hours for alloys: (a) M1S and (b) M2S; (c) EDS spectrum corresponding to the location
identified in (b) by the + sign. ... 292
Figure 6.12 (a) Secondary electron image of T6-treated M2S alloy after stabilization at 250°C for 200 hours, (b) elements overlay, and (c) through (h)
corresponding X-ray maps showing distribution of the different elements in the micrograph shown in (a). ... 295
Figure 6.13 Backscattered electron images showing the distribution of precipitates in the T6-treated M3S alloy after stabilization at 250°C for 200 hours: (a) low magnification image, and (b) high magnification image. ... 296
Figure 6.14 Variation in Rockwell hardness values of alloys M1S through M3S in the T6-treated condition, and after static and dynamic stabilization at 250°C for 5h, 10h, 25h, 50h, 100h, and 200h (testing at ambient temperature). ... 298
Figure 6.15 Variation in average UTS, YS, and %El values for alloys M1S through M5S in the T5, T6, and after static stabilization at 250°C for 100h, and 200h (testing at ambient temperature). ... 303
Figure 6.16 Cáceres quality chart representing the relation between UTS and percent plastic deformation of alloys M1S through M5S in the T5 condition before and after stabilization at 250°C for 100, and 200 hours (testing at ambient temperature). ... 304
Figure 6.17 Cáceres quality chart representing the relation between UTS and percent plastic deformation of alloys M1S through M5S in the T6 condition before and after stabilization at 250°C for 100, and 200 hours (testing at ambient temperature). ... 305
Figure 6.18 Experimental and calculated data for the precipitate contribution to the overall yield strength of alloys M4S and M5S as a function of the
stabilization time. ... 306
Figure 6.19 Variation in average Rockwell hardness values for alloys M1S through M5S in the T5 and T6 conditions, and after static stabilization at 250°C for 100h, and 200h (testing at ambient temperature). ... 310
Figure 6.20 Variation in average UTS, YS, and %El values for alloys M1S through M5S in the T5 and T6, and after static stabilization at 250°C for 100h, and 200h (testing at 250°C). ... 313
Figure 6.21 Drouzy quality chart representing the relation between the UTS and the percent elongation to fracture of alloys M1S through M5S in the T5-treated condition, before and after stabilization at 250°C for 100, and 200 hours (testing at 250°C). ... 316
Figure 6.22 Drouzy quality chart representing the relation between the UTS and the percent elongation to fracture of alloys M1S through M5S in the T6-treated condition, before and after stabilization at 250°C for 100, and 200 hours (testing at 250°C). ... 317
Figure 6.23 Backscattered electron images showing the size and distribution of
precipitates in T6-treated alloys after stabilization at 250°C for 1 hour: (a) M1S, (b) M2S, (c) M3S alloys (testing at 250°C). ... 319
Figure 6.24 Backscattered electron images showing (a) shiny coarse and fine dispersoids in the T6-treated M2S alloy after stabilization at 250°C for 1 hour and testing at the same temperature, (b) EDS spectrum corresponding to the shiny particles in (a). ... 321
Figure 6.25 (a) Backscattered electron image of T6-treated M3S alloy after stabilization at 250°C for 1 hour, (b) higher magnification of the inset in (a), and (c) through (g) X-ray maps showing the distribution of elements in (b). ... 323
Figure 6.26 (a, b, and c) Backscattered electron images at different magnifications showing the size and distribution of precipitates in the T6-treated M1S alloy after stabilization at 250°C for 200 hours; (d) EDS spectrum corresponding to the rod-like particles in (c). ... 324
Figure 6.27 Backscattered electron image showing (a) shiny coarse and fine dispersoids in T6-treated M2S alloy after stabilization at 250°C for 200 hours and testing at the same temperature; (b) EDS spectrum of bright particles in (a). ... 325
Figure 6.28 Backscattered electron images showing the density and distribution of the strengthening precipitates in T6-treated alloys after stabilization at 250°C for 200 hours: (a) M2S, and (b) M3S alloy (tested at 250°C). ... 326
Figure 6.29 Backscattered electron images showing PFZs in T6-treated M2S alloy after stabilization at 250°C for 200 hours. ... 327
Figure 6.30 (a) Backscattered electron image of T6-treated M3S alloy after stabilization at 250°C for 200 hours, and (c-h) corresponding X-ray maps showing distribution of elements in (a). ... 329
Figure 6.31 SEM images of T6-treated M1S alloy after stabilization at 250°C for 1 hour: (a) BSE image showing a uniform dimple structure and cracked particles (arrowed), (b) EDS spectrum corresponding to the point of interest in (a), and (c) high magnification BSE image shown a cracked Al-Si-Ti-Zr particle. ... 331
Figure 6.32 (a) BSE image of T6-treated M1S alloy after stabilization at 250°C for 1 hour showing Fe-bearing phases, and (b, c) EDS spectra corresponding to the points of interest in (a), confirming the presence of π-Al-Si-Mg-Fe, and β-Al-Si-Fe phases, respectively. ... 332
Figure 6.33 (a, b) BSE images of T6-treated M1S alloy after stabilization at 250°C for 200 hours showing a coarse dimpled structure, coarsened precipitates and Alx(Zr,Ti)Si particles involved in the crack initiation process, and (c)
corresponding EDS spectrum of the phase of interest shown in (b). ... 334
Figure 6.34 SEM images of T6-treated M2S alloy after stabilization at 250°C for 1 hour: (a) BSE image showing micro-cracks associated with Ni-rich phases, and (b) EDS spectrum corresponding to the point of interest in (a). ... 335
Figure 6.35 (a) High magnification of the circled area shown in Figure 6.34(a), (b, c, and d) EDS spectra showing the chemical composition of the cracked phases in (a). ... 337
Figure 6.36 (a) BSE image of T6-treated M2S alloy after stabilization at 250°C for 200 hours showing the dimple structure, coarsened precipitates and phases involved in the crack initiation process, and (b, c) EDS spectra identifying the Ni-rich phases shown in (a). ... 338
Figure 6.37 SEM images of T6-treated M3S alloy after stabilization at 250°C for 1 hour: (a) BSE image showing a branched crack in a Q-phase particle and sludge particles preventing crack propagation, (b, c) EDS spectra corresponding to the Q-phase and the sludge particle observed in (a), and (d) BSE image showing various cracked intermetallic phases and crack-free sludge particles. ... 340
Figure 6.38 (a) BSE image of T6-treated M3S alloy after stabilization at 250°C for 200 hours showing the dimple structure (upper right corner), coarsened
precipitates and a cracked star-like Al-Si-Ti-Zr and sludge particles; and (b, c) EDS spectra corresponding to the Al-Si-Ti-Zr and sludge particles shown in (a). ... 342
Figure 6.39 (a) BSE image of T6-treated M3S alloy after stabilization at 250°C for 200 hours showing the distribution of coarsened precipitates and Al-Si-Ti-Zr thin plates, and (b) EDS spectrum corresponding to the Al-Si-Ti-Zr plates
observed in (a). ... 343
Chapter 7
Figure 7.1 Optical micrographs (500X) of non-modified base alloy (M1) after solution treatment at 510°C for: (a) as-cast, (b) 8h, (c) 25h, (d) 50h, (e) 100h, and (f) 200h. ... 351
Figure 7.2 Optical micrographs (500X) of Sr-modified base alloy (M1S) after solution treatment at 510°C for: (a) as-cast, (b) 8h, (c) 25h, (d) 50h, (e) 100h, and (f) 200h. ... 351
Figure 7.3 Optical micrographs (500X) of non-modified 356 alloy (M6) after solution treatment at 550°C for: (a) as-cast, (b) 8h, (c) 50h, (d) 100h, (e) 200h, and (f) 400h. ... 352
Figure 7.4 Optical micrographs (500X) of Sr-modified 356 alloy (M6S) after solution treatment at 550°C for: (a) as-cast, (b) 8h, (c) 50h, (d) 100h, (e) 200h, and (f) 400h. ... 352
Figure 7.5 Morphological changes of eutectic silicon as a function of heat treatment: (a) and (b) non-modified 354 alloy (M1) in as-cast and after 200 h at 510°C, respectively; and (c) and (d) Sr-modified 354 alloy (M1S) in as-cast and after 200 h at 510°C, respectively. ... 355
Figure 7.6 Optical micrographs (500X) of Sr-modified 354 alloys (M1S) after solution treatment at 510°C for: (a) as-cast, (b) 5 minutes, (c) 15 minutes, (d) 30 minutes, and (e) 60 minutes. ... 356
Figure 7.7 Size and distribution of eutectic silicon particles in deep etched non-modified 356-type alloy (alloy M6) as a function of solution treatment: (a) As-cast, (b) 8h at 550°C, (c) 50h at 550°C, (d) 200h at 550°C, and (e) 400h at 550°C. ... 360
Figure 7.8 Size and distribution of eutectic silicon particles in deep etched Sr-modified 356-type alloy (alloy M6S) as a function of solution treatment: (a) As-cast, (b) 8h at 550°C, (c) and (d) 50h at 550°C, (e) and (f) 200h at 550°C, and (g) and (h) 400h at 550°C. ... 362
Figure 7.9 Results of sensitivity analyses performed to determine an appropriate area fraction limit as a criterion for omitting very small Si particles in the
quantitative analysis of: (a) alloy M1, (b) alloy (M1S), (c) alloy M6, and (d) alloy M6S. ... 365
Figure 7.10 The distribution of eutectic Si particles according to the equivalent circular diameter after solution treatment of: (a) alloy M1 at 510°C, (b) alloy M1S at 510°C, (c) alloy M6 at 550°C, and (d) alloy M6S at 550°C. ... 367
Figure 7.11 The distribution of eutectic Si particles according to the aspect ratio after solution treatment of: (a) alloy M1 at 510°C, (b) alloy M1S at 510°C, (c) alloy M6 at 550°C, and (d) alloy M6S at 550°C. ... 368
Figure 7.12 The distribution of eutectic Si particles according to shape characteristics after solution treatment of the non-modified base alloy (M1) at 510°C for 0(as-cast), 8, 25, 50, 100, and 200 hours. ... 370
Figure 7.13 The distribution of eutectic Si particles according to shape characteristics after solution treatment of the Sr-modified base alloy (M1S) at 510°C for 0(as-cast), 8, 25, 50, 100, and 200 hours. ... 371
Figure 7.14 The distribution of eutectic Si particles according to shape characteristics after solution treatment of the non-modified 356-type alloy (M6) at 550°C for 0(as-cast), 8, 50, 100, 200, and 400 hours. ... 372
Figure 7.15 The distribution of eutectic Si particles according to shape characteristics after solution treatment of the Sr-modified 356-type alloy (M6S) at 550°C for 0(as-cast), 8, 50, 100, 200, and 400 hours. ... 373
Figure 7.16 Average Si particle characteristics in M1 and M1S alloys after solution treatment at 510°C for 0(as-cast), 8, 25, 50, 100, and 200 hours: (a) particle area, (b) aspect ratio, (c) sphericity (%), and (d) roundness (%). ... 379
Figure 7.17 Average Si particle characteristics in M6 and M6S alloys after solution treatment at 550°C for 0 (as-cast), 8, 50, 100, 200, and 400 hours: (a)
particle area, (b) aspect ratio, (c) sphericity (%), and (d) roundness (%). .. 380
Figure 7.18 Coarsening of Si particles by agglomeration in M6S alloy after solution treatment at 550°C for 50 hours. ... 380
Figure 7.19 Plots of the cube average particle radius (𝒓𝟑) versus the solution treatment
time for: (a) alloy M1, (b) alloy M1S, (c) alloy M6, and (d) alloy M6S. ... 383
Figure 7.20 LSW coarsening model predictions (lines) compared with experimental data (markers) for solution treated conditions of: (a) alloy M1, (b) alloy M1S, (c) alloy M6, and (d) alloy M6S. ... 385
Figure 7.21 Plots of ambient-temperature tensile properties (T4) of: (a) alloy M1, (b) alloy M1S, (c) alloy M6, and (d) alloy M6S. ... 389
Figure 7.22 Coarsened Si particle in M1S alloy after solution treatment at 510°C for 200 hours showing pinholes (broken arrows) and notch-like edges (angles with solid lines). ... 393
Figure 7.23 Plots of high-temperature tensile properties (T4) of: (a) alloy M1, (b) alloy M1S, (c) alloy M6, and (d) alloy M6S. ... 396
LIST OF TABLES
Chapter 2
Table 2.1 Classification of cast Al-alloys ... 13
Table 2.2 Chemical composition limits of 354 and 356 type alloys19, 20, 39, 40 ... 20
Table 2.3 Room temperature tensile properties of permanent mold cast 354 and 356 alloys in the T6 condition11, 12, 39, 40 ... 20
Table 2.4 Designations and Practices of common Al heat treatment52 ... 37
Table 2.5 Characteristics of Q-phase and its precursors formed during aging treatment of Al-Si-Cu-Mg alloys54, 55, 57 ... 48
Chapter 3
Table 3.1 Chemical composition of the alloys investigated in this study ... 95
Table 3.2 Heat treatment procedures and parameters applied to alloys investigated in Phases I, and II ... 102
Table 3.3: Stabilization parameters applied to alloys used in Phase II ... 105 Table 3.4 Heat treatment parameters used for the alloys investigated in Phase III
(extended solution treatment) ... 106
Chapter 4
Table 4.1 Proposed main reactions occurring during solidification/melting of the investigated alloys (see Figure 4.1) compared to thermal analysis of other studies12, 14, 24, 54, 69, 210, 211 ... 138
Table 4.2 Summary of the existing phases in the alloys studied detected using SEM/EDS analysis ... 145
Table 4.3 Area estimated values of the separated peaks B, C, and D shown in Figure 4.11 ... 166
Chapter 5
Table 5.1 Volume fractions (%) of undissolved intermetallic compounds in the matrix of as-cast and as-quenched alloys ... 194
Table 5.2 Characteristics of eutectic silicon particles in as-cast and solution-heat treated conditions of the alloys studied ... 202
Table 5.3 Variation in average UTS, YS, %El, Qc, and Q values of the alloys studied in
as-cast, SHT, T5-, and T6-treated conditions obtained at ambient temperature for smooth bars ... 221
Table 5.4 Summary of the yield strength contributions from various constituents in the alloys studied in the as-quenched and peak aged (T6) conditions (testing at ambient temperature using smooth bars) ... 228
Table 5.5 Variation in average UTS, YS, %El, and Q values of the alloys studied in as-cast, T5-, and T6-treated conditions obtained at 250°C for smooth bars ... 243
Chapter 6
Table 6.1 Variation in average UTS, YS, and %El values for alloys M1S through M3S in the T6-treated condition, and after static and dynamic stabilization at 250°C for 5h, 10h, 25h, 50h, 100h, and 200h (testing at ambient temperature) ... 276
Table 6.2 Summary of the yield strength contributions from various constituents in M1S, M2S, and M3S alloys in the T6 condition, and after static stabilization at 250°C for 5h, 10h, 25h, 50h, 100h, and 200h (testing at ambient temperature) ... 280
Chapter 7
Table 7.1 Summary of investigated alloys and conditions ... 348
Table 7.2 Characteristics of eutectic Si particles in studied alloys (*Average value, ** standard deviation) ... 378
Table 7.3 Ambient-temperature tensile properties (T4) of M1 and M1S alloys ... 388
Table 7.4 Ambient-temperature tensile properties (T4) of M6 and M6S alloys ... 389
Table 7.5 High-temperature tensile properties (T4) of M1 and M1S alloys ... 395
CHAPTER 1
CHAPTER 1
INTRODUCTION AND OBJECTIVES
1.1 SYNOPSIS AND PROBLEM STATEMENT
The subject of transportation economics has acquired great public awareness as a result of fluctuating oil prices and its politics. The vehicles in both automotive and aerospace industries are main energy consumers in the daily life. Therefore any reduction, even little, in energy consumption in the transportation sector will have a remarkable impact on the world’s total energy expenditure. Alongside the economic aspects, environmental concerns are being raised regarding the harmful emissions created by the transportation sector and their critical effect on climate change and global warming.1-5 Thus, enormous efforts are being implemented towards minimizing these harmful emissions by reducing the fuel consumed by the transportation sector; one approach of doing so is reducing the weight of automotive and aerospace vehicles.
Heat-treatable aluminium alloys play an important role in lowering vehicle weight and promoting fuel economy in the automotive industry because of their lightweight and improved properties such as outstanding response to plastic deformation and casting processes, good corrosion resistance, and high strength/weight ratio. The Ducker Worldwide Company conducted a survey on the amount of aluminum alloys used in North
American automotive vehicles; the results showed that aluminum usage has increased from about 37 kg in 1974 to 155 kg in 2012 and it is projected to reach 250 kg by 2025.6
On the technological side, some concerns regarding the use of aluminum alloys in the automotive sector have been raised regarding the reliability of aluminum engine components when employed in modern engines with higher specific powers which produce increased combustion pressure and temperature as shown in Figure 1.1.7, 8, 9 The replacement of iron-based alloys in engine components by others made of lighter aluminum alloys should not impair the performance of the vehicles; so that all efforts towards enhancing the properties of aluminum alloys to meet service requirements will be beneficial towards reducing emissions and developing greener societies.
Figure 1.2 shows the increasing trend of replacing the commonly used heavy alloys (mainly iron-based alloys) by lighter alloys such as aluminum and magnesium alloys. The expectations reveal that by the year 2035 the share of light alloys will increase to approach 40% while the usage of heavy alloys will be remarkably decreased.10
Figure 1.1 Development of specific performance and ignition pressure of passenger car.8