HAL Id: hal-00935380
https://hal.archives-ouvertes.fr/hal-00935380
Submitted on 30 Jan 2014
HAL is a multi-disciplinary open access
archive for the deposit and dissemination of
sci-entific research documents, whether they are
pub-lished or not. The documents may come from
teaching and research institutions in France or
abroad, or from public or private research centers.
L’archive ouverte pluridisciplinaire HAL, est
destinée au dépôt et à la diffusion de documents
scientifiques de niveau recherche, publiés ou non,
émanant des établissements d’enseignement et de
recherche français ou étrangers, des laboratoires
publics ou privés.
An Optical Pulse Generator from a Sinusoidal Optical
Signal Using Sagnac Loop Self-Sampling
Ricardo Ribeiro, Vinicius Silva, Andres Pablo Barbero, Murilo Carvalho,
Frédéric Lucarz, Bruno Fracasso
To cite this version:
Ricardo Ribeiro, Vinicius Silva, Andres Pablo Barbero, Murilo Carvalho, Frédéric Lucarz, et al.. An
Optical Pulse Generator from a Sinusoidal Optical Signal Using Sagnac Loop Self-Sampling.
LATIN-COM 2013 : 5th IEEE Latin-American Conference on Communications, Nov 2013, Santiago, Chile.
�hal-00935380�
An Optical Pulse Generator from a Sinusoidal Optical
Signal Using Sagnac Loop – Self-Sampling
Ricardo M. Ribeiro, Vinicius N. H. Silva, Andrés P. L.
Barbero and Murilo B. Carvalho
Departamento de Engenharia de Telecomunicações Universidade Federal Fluminense
24.210-240, Niterói, RJ - Brasil
rmr@pq.cnpq.br
Frédéric Lucarz and Bruno Fracasso
Département d’Óptique, Télécom Bretagne Technopôle Brest-Iroise-CS83818-29238, Brest, Francefrederic.lucarz@telecom-bretagne.eu
Abstract—It is experimentally shown an original optical pulse
generator able to produce pulses at MHz rate with few ns timewidth at 1/3 of input period. It is based on the self-switched Semiconductor Laser Amplifier Loop Mirror (SLALOM) configuration. The input is a sinusoidal signal in the C-band and the output is amplified pulses. Numerical simulations are also carried out and shown that GHz & ps pulse generation is possible. Besides their usefulness as an optical pulse generator, application in self-sampling is also discussed.
Keywords—laser; sampling; ultrafast-optics; optical signal processing; Sagnac interferometer; semiconductor optical amplifier
I. INTRODUCTION
Many techniques have been described to generate a solitonic or non-solitonic optical pulses such as electro-optic modulation [1], gain-switching [2], mode-locking [3] and interferometric [4] schemes. In the latter, the light is phase-modulated before it traverses a Mach-Zehnder interferometer.
Short optical pulses are largely used on high-capacity fibre-optic digital communications [5], but they have other applications, e.g. time-response characterization of ultra-fast devices and systems [6], switching of short electrical pulses [7] and optical signal processing [8].
Stable optical pulses as those generated by mode-locked lasers, are crucial to carry out GSa/s rate optical sampling [8]. The authors have shown an optical circuit design and numeric simulations [9] of a real-time optical sampler based on the Sagnac loop using a semiconductor optical amplifier (SOA) as the nonlinear element. The device uses a train of short pulses to sample an analogue optical signal, e.g. a Radio-over-Fibre (RoF) signal. By using polarisation controllers inserted in the loop, the device was firstly adjusted to be 100% reflective. However, it was also shown [9] that the loop length should be carefully adjusted to almost contain an integer number of analogue signal periods. After such settings, the sampling pulses were released and sampled (and compressed) pulses were transmitted [9].
In this paper, we describe for the first time, in the best of our knowledge, experimental results on the use of an SLALOM configuration [10] in the self-switched regime, to generate an 118 MHz pulse train from an incoming sinusoidal optical
signal around 1550 nm wavelength. The latter may be an analogue RoF carrying or not digital modulation on the RF carrier. Computer simulations for GHz & ps pulse generation on VPI Transmission MakerTM software are presented. The time compression of generated pulses and their possible use to perform self-sampling are also discussed.
II. THE EXPERIMENTAL SET-UP
Figure 1 depicts the experimental set-up based on a Sagnac loop using an SOA. The circuit operates on self-switching regime where the self-phase modulation (SPM) occurs inside the SOA. The circuit differs from those presented in [9] as to be an o-Sampler in that no sampling (control) pulses are used here.
A sinusoidal optical signal with PINPUT = 344 µW power is launched into the circuit. It is generated by direct modulation of a distributed feedback laser diode emitting 1550 nm wavelength, driven with 25 mA bias current and + 1 dBm Radio-Frequency (RF) voltage signal from a signal generator.
The loop is assembled by using one fibre-coupler (FC) featuring a measured coupling ratio of ~70/30. A polarisation controller (PC) is inserted in the loop in order to perform the polarisation alignment of the interfering light beams in the coupler junction. An SOA is asymmetrically inserted in the loop. The used SOA features 21-dB maximum gain, +6dBm saturated power and 45-nm bandwidth around 1552.2 nm wavelength. The bias current was set at 200 mA. The length L1 + L2 (L1 < L2) of the fibre loop is kept constant. The input frequency fINPUT of the sinusoidal probe signal is varied around fRES =1/TRES corresponding to an analogue signal period TRES given by (1).
L
1+ L
2= m
c
n
effT
RES (1)In (1), m is an integer number, c = 3x10⁸ m/s and neff is the effective refractive index of the fibre. The output signal, that eventually may be a pulse train, is collected from the transmission arm (PT). A tuneable bandpass filter (BPF) operating in the 1530-1561 nm wavelength range with 1.5 nm
Ricardo M. Ribeiro thanks Foundation Capes/MEC-Brasil for the financial support through a Post-Doctoral fellowship under the grant BEX 9096/11-6.
optical bandwidth centred at λ1 = 1550 nm, was used in the output arm of the circuitto reduce the Amplified Spontaneous Emission (ASE) noise from the SOA. The output optical signal is detected by an 8 GHz bandwidth photodetector. The resulting electrical signal can be displayed on an oscilloscope.
Fig. 1. The experimental fibre-optic circuit of the pulse generator where L1 +
L2 = Sagnac loop length.
III. RESULTS
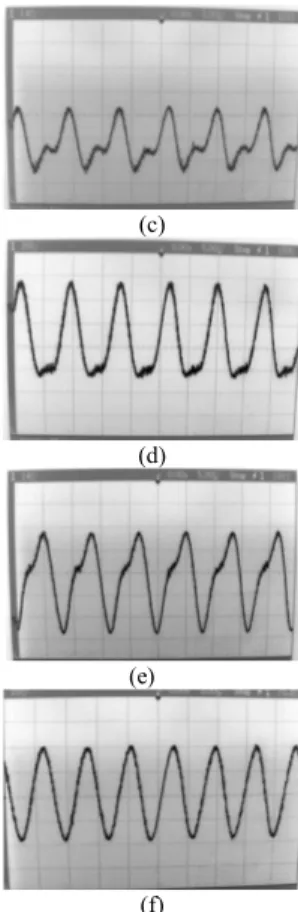
Figures 2a-2f show the time-domain waveforms of the output signals from the circuit of Figure 1 when the fINPUT is varied around the fRES = 103 MHz. The latter is calculated from (1) using L1 = 401.0 cm, L2 = 597.5 cm and neff = 1.46. An integer number of analogue cycles should match with L1 and L2 simultaneously. A simple calculation leads to fRES1 = 103 MHz, fRES2 = 1.03 GHz and so on, remembering that an integer number of analogue cycles automatically should also be fitted along the L1 + L2 loop length.
Figure 2a shows that for fINPUT = 98 MHz, the output signal is always sinusoidal shaped despite the PC adjustment. Only the amplitude varies when the PC is adjusted.
As is shown in Figure 2b, after increasing the input frequency as fINPUT = 107 MHz, the output signal is no longer sinusoidal. It starts to be distorted. Figure 2c shows that for fINPUT = 117 MHz there is a trend to double the frequency of the output signal.
Figure 2d shows that for fINPUT = 118.3 MHz and after a careful adjustment of PC, it turns out possible to generate optical pulses with ~ 8.4 ns period that exactly corresponds to the original 118.3 MHz input frequency. The pulse timewidth is ~ 2.6 ns, i.e. slightly smaller than 1/3 of the
(a) (b) (c) (d) (e) (f)
Fig. 2. Output (PT) for input (PINPUT) sinusoidal signal at fINPUT = (a) 98 MHz,
(b) 107 MHz, (c) 117 MHz, (d) 118.3 MHz, (e) 120 MHz and (f) 141 MHz. The scale of the horizontal axis is 5 ns/div.
analogue signal period. This result may be compared with those similar as obtained in [1] by using a Mach-Zehnder modulator operating in the nonlinear region of the interferometer transfer function, but using an electrical input signal and [3] using a different set-up. It should be observed that 118.3 MHz does not correspond to the fRES. The generation of pulses was also observed to be quite sensitive to the launched frequency fINPUT and to the polarisation setting through the PC adjustment.
Figure 2e shows that from fINPUT = 120 MHz is no longer possible to generate pulses. By increasing further the launched frequency, the output signal goes back to its sinusoidal shape as is shown in Figure 2f for fINPUT = 141 MHz.
Because the fibre-coupler features ~ 70/30 coupling ratio, it was not possible to set the Sagnac loop as to be 100% reflective (or transmissive). Therefore, it was not possible to erase the transmitted signal (PT).
Although the results were reproducible, instabilities were observed mainly when pulses were generated as displayed in Figure 2d. The reason is firstly because the pulses can only be generated for a particular paddles adjustment of the PC. Secondly, the used PC does not present high mechanical stability. Thirdly, connectors were used in the optical circuit. The use of non-mechanical PC [11] and fibre splices instead of connectors may reduce the observed instabilities.
IV. DISCUSSIONS
Originally [9], an optical sampler was designed to operate after adjustments of three optical delay lines. The first delay line denoted Delay #0 is out of the loop and is used to temporally align the sampling pulses with the analogue signal to be sampled. The Delay #0 it is not used here. The second and third delay lines denoted Delay #1 and Delay #2, respectively, are included in the circuit design of Figure 3 used for numerical simulations. By setting the PC, the device is also phase biased to be 100% reflective when there are no sampling pulses [9].
Now, the Delay #1 and Delay #2 lines are both inserted in the loop. They allow a fine mismatch of L1 and L2 from the exact fit of an integer number of analogue signal periods TINPUT, i.e. L1 = n(c/neff)TINPUT
±
ΔL1 and L2 = k(c/neff)TINPUT ΔL2, where n and k are integer numbers, and ΔL1 and ΔL2 are the amount of additional optical delay. In the present model, a symmetric adjustment of delay lines is assumed, i.e. ΔL1 = ΔL2 = ΔL so that the loop length is kept unaltered. Therefore, the symmetric adjustment of the Delay #1 and Delay #2 lines automatically ensures a fine placement deviation “x” of the SOA in reference of the midpoint of the loop (see Figure 3).Fig. 3. The fibre-optic circuit design of the pulse generator as used for numerical simulations using the VPI Transmission MakerTM software, where
L1 + L2 = Sagnac loop length.
The interferometric transfer function of the transmitted (PT) signal of an ideal Sagnac interferometer is given by (2) after assuming all polarisations aligned [12,13].
P T
( )
t = PINPUT( )
t 1 2 1− cosγL SOAPINPUT( )
t(
)
[
]
(2)In (2), Δφ(t) = γLSOAPINPUT(t) represents the SPM-generated differential phase-shift between the clockwise (CW) and counter-clockwise (CCW) analogue signals, respectively. The Δφ(t) depends on the optical nonlinear strength γ and the length LSOA of the SOA inserted in the loop, respectively, and the input power PINPUT(t) of the analogue signal. The SOA inserted in the loop is an active element and the output signal generally will experiment an optical gain, i.e. PT > PINPUT.
When a single cycle of PINPUT(t) starts and ends, the power magnitude is very low (Δφ ≈ 0 rad) and the SLALOM acts as an almost perfect mirror since the modelled fibre-coupler is of
3 dB ratio coupling. The start and end of the analogue signal cycle is totally reflected back, i.e. PT = 0 mW according (2). When PINPUT(t) is increased, a differential phase-shift increased also due to the SPM effect that takes place into the SOA. The SPM causes spectral enlargement and distortion of input signal and is behind the mechanism of pulse generation. Since the aforementioned
±
ΔL setting of the loop delay lines is carried out, the Δφ phase-shift is imprinted in different parts of the CW and CCW analogue waveforms. By symmetrically adjusting the delay lines, it opens a switching window and the output signal PT may be generated as pulses. When the input power increases (and decreases), the increase (decrease) of PT(t) cycle is not linear thus leading the compression of the cycles thereby generating pulses. It implies that no complete switching is observed, i.e. the high power parts of the cycle switch rather than its wings for pulses [14] and presently for sinusoidal modulation.Another possible explanation may be outlined. It is shown in [3] an experimental set-up where actively mode-locked pulses were generated from a SOA-fibre ring laser excited with 10 GHz modulated optical signal. Therefore, present experimental set-up seems to generate non-dispersion compensated mode-locked pulses since the L1 and L2 lengths are properly adjusted. Both CW and CCW analogue signals modulates the SOA gain.
The VPI Transmission MakerTM software is used here to carry out some numerical simulations. The software solves the nonlinear Schrödinger equation (NLSE) taking into account the SPM effect in the bulk and isotropic SOA with low feedback as an active (amplifier) nonlinear waveguide. It uses the Transmission Line Model (TLM) to compute the differential nonlinear phase-shift induced by a change in carrier density in the semiconductor. As a result, the switching is driven by the own input signals due to the SPM effect occurring into the SOA.
The circuit of Figure 3 was firstly probed with a fINPUT = 2.5 GHz (400 ps period) sinusoidal carrier frequency analogue signal at PINPUT = 344 µW power and 1550 nm wavelength. The loop length was set to be L1 + L2 ∝ 1.6 ns or 4 integer cycles of the analogue signal, where L1 and L2 correspond to 0.4 ns and 1.2 ns, respectively. Because of limited amount of available SOA’s data, it is here assumed LSOA = 500 µm, linewidth enhancement factor = 6.0, null linear recombination, bimolecular recombination = 1.0 x 10⁻¹⁶ m3/s, Auger recombination = 1.3 x 10-41 m6/s and initial carrier density = 1.0 x 1024 1/m3. The bias current was set at IBIAS = 130 mA.
Figure 4a and 4b shows the plot of the calculated PT(t) for fINPUT = 2.5 GHz when 50 ps of delay (detuning) is symmetrically adjusted in both delay lines for 65/35 and 50/50 (3 dB fibre-coupler) coupling ratio, respectively. The relative optical phase-bias between the CW and CCW signals must be carefully adjusted through PC to optimise the output from the circuit thus shaping the pulses. It is clearly the generation of ~ 130 ps timewidth pulses, i.e. around 1/3 of the period. Figure 4a shows that the calculated pulse shape after assuming 65/35 coupling ratio reasonable fits the experimental measurement shown by Figure 1d. However, when the coupling ratio is
assumed to be 50/50, more sharply pulses are calculated as is shown by Figure 4b. Therefore, the interferometer visibility contributes to increase the extinction ratio of the device. Simulations also have shown that it is not possible to generate pulses when the SOA is removed from the loop, but only sinusoidal signals exit.
Simulations at fINPUT = 2.5 GHz shows that when an “optical DC offset” of POFFSET ≤120 µW is superimposed with 400 µW sinusoidal amplitude (≤ 120/400 = 30%), the optical DC component is blocked by the circuit of Figure 3. This means that the pulses remain to be generated. For POFFSET > 120 µW the pulses start to turn out to be sinusoidal in shape. This optical blocking was also observed in the experiments.
When the SOA is placed at the middle of the loop (x = 0), it is not possible to generate pulses. However, after slightly detuning of delay lines (x ≠ 0), the optical pulses can again be generated.
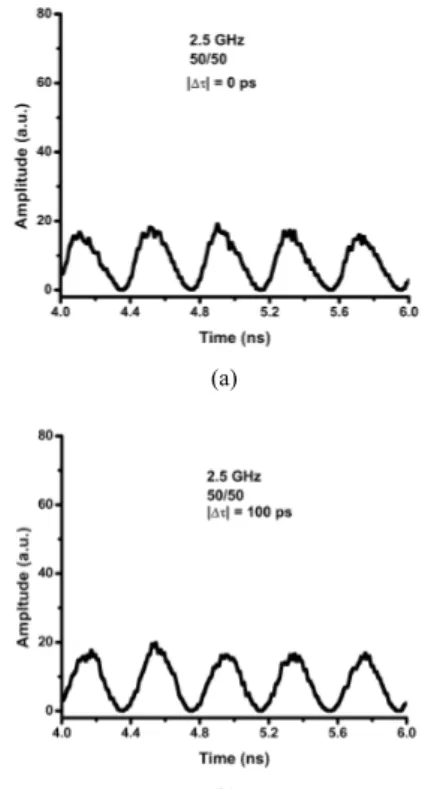
Figure 5a and 5b show the plot of the calculated PT(t) at fINPUT = 2.5 GHz when 0 ps and 100 ps delay (detuning) is symmetrically adjusted in both delay lines for 50/50 coupling ratio, respectively. Sinusoidal-like outputs are calculated for 0 ps and 100 ps delays despite the PC adjustment. A clearly distorted sinusoidal signal is shown in Figure 5b for 0 ps delay.
Now, the 0 ps symmetrical delays are kept unaltered and the input frequency fINPUT is varied. Figures 6a-6c show plots for fINPUT = 1.8, 2.3 and 2.7 GHz, respectively, after setting 50/50 coupling ratio.
From the simulation results displayed by the plots of Figures 4-6, it becomes possible to conclude that the optical delay |Δτ| adjustment has analogous effect of variation of input frequency fINPUT. The experiments were carried out by varying the fINPUT merely due to the convenience, i.e. the optical delay lines were not available.
(a)
(b)
Fig. 4. The calculated PT(t) for 50 ps symmetrical delay (350/1250 ps) at
fINPUT = 2.5 GHz for (a) 65/35 and (b) 50/50 coupling ratio.
(a)
(b)
Fig. 5. The calculated PT(t) for (a) 0 ps (400/1200 ps) and (b) 100 ps
(300/1300 ps) symmetrical delay at fINPUT = 2.5 GHz and 50/50 coupling ratio.
(b)
(c)
Fig. 6. The calculated PT(t) at 0 ps symmetrical delays (400/1200 ps) and
50/50 coupling ratio for fINPUT = (a) 1.8 GHz, (b) 2.3 GHz and (c) 2.7 GHz. In
the latter, a 122.6 ps pulse timewidth was calculated.
V. SELF-SAMPLING
Analogue-to-digital converters (ADCs) require the sampling of the signal to be digitised. Even an electronic ADC-quantizer may take the advantages of a real time optical sampling [8,15] because of their high stability. Most of optical sampling circuits use very short pulses generated from a mode-locked laser that usually features few femtoseconds of time-jitter [8,12,16].
Simulations from the circuit of Figure 3 were carried out for fINPUT = 2.5 GHz, 50/50 coupling-ratio and 50 ps symmetrical delays leading to generation of ~130 ps timewidth pulses as shown in Figure 4b. Numerical simulations also show the possibility of pulse compression. Figure 7 shows a temporal compression at -3.1 ps/km rate by using a Dispersion Compensating Fibre (DCF) featuring D = -160 ps/nm.km and 0.25 dB/km dispersion and attenuation coefficients, respectively. It is assumed that the DCF coil is placed outside the loop, i.e. the transmitted pulses traverse the DCF length before photo-detection. The shape of the compressed pulses were calculated to be quite similar of those presented in Figure 4b.
Figure 7 shows a slightly compression from ~130 ps to ~100 ps by using 10 km length of DCF coil. The spectral bandwidth of the BPF was set to be ΔfFILTER = 100 GHz. After repeating the calculation with ΔfFILTER = 400 GHz and LFIBRE = 1 km, the output pulses remain their timewidth around 117 ps. Both experiments and simulations used a DFB laser diode that may be assumed to present a null linewidth spectrum for practical purposes.
Fig. 7. The calculated timewidth of the compressed pulses after propagation along a DCF coil with PINPUT = 344 µW.
By increasing the PINPUT it turn out possible to obtain further temporal compression. Figure 8 shows the calculated time-shape of the compressed pulses by setting PINPUT = 1376 µW using the same 10 km length DCF coil now leading pulses with ~ 75 ps timewidth, but presenting pedestals (background).
Other more suited to compact systems are available to obtain pulse compression, e.g. chirped Fibre Bragg Grating (FBG) [17] or a Nonlinear Optical Loop Mirror (NOLM) [14]. The latter may be also useful to suppress the pulse pedestals [18].
The compression generates a pulse train with a reduced duty-cycle. By using one or more serially connected split-and-delay optical circuits [12,19], it turns out possible to produce temporally interleaved pulses thus increasing the rate of the output pulse train by NfINPUT, where N is an integer number. Since N ≥ 2, the train may be used to sample the original analogue waveform under the Nyquist theorem. Present calculations for 2.5 GHz (400 ps period) show that at least N ~ 5 are possible once the derived compressed pulses at ~75 ps (without pedestals) are used to sample the analogue signal.
The scheme described in [9] may be used for real-time self-sampling, but the wavelength should be converted or the polarisation between the signal to be sampled and the sampling pulses should be set at 90o angle each other. Therefore, (amplified) sampling pulses may be derived from the analogue signal to be sampled. Since an analogue RoF (optical) periodic signal is already available, two advantages in the use of self-sampling for digitising RoF or an optical-ADC are pointed out here:
i) It does not require the use of a local mode-locked laser. ii) Similarly to digital signals, analogue signals also presents jitter. Considering the pulse generation mechanism, we are lead to believe that the time-jitter present in the input signal should be transferred to the derived sampling pulses. In that case, the sampling pulses would be naturally synchronized to the input. It should be noted however, that further investigations are required to validate this assumption. Additional measurements are also needed to assess the input to output amplitude relationship of the self-sampling process. This is essential to quantify the linearity, an important parameter of ADCs.
Fig. 8. The calculated time-shape of the compressed pulses after propagation along 10 km length of DCF coil with PINPUT = 1376 µW.
VI. CONCLUSIONS
In this paper, it is described a SLALOM-based device able to generate optical pulses with timewidth ~1/3 of the period of an analogue sinusoidal input optical signal. Neither microwave circuit nor input electrical signal is required. The pulses are generated when the period of the input sinusoidal signal is slightly detuned from the fundamental period that can be adjusted in the loop length and when the optical phase is carefully biased by using the polarisation controller. In this paper, the experiments were constrained to only ~100 MHz input analogue signal mainly to demonstrate the
proof-of-principle of the proposed optical generator.
Numerical simulations in the (1.8-2.7) GHz frequency range have shown that it is equally possible to generate pulses by:
i) Keeping unchanged the input period (or fINPUT) matched to be an integer fraction of the loop length, and slightly adjusting the symmetrical delays (detuning) of the SOA relative to the fibre-junction.
ii) Keeping unchanged the L1 and L2 and varying the fINPUT around fRES.
In both cases, one should also carefully to adjust the optical phase-bias by using the controller PC.
Although much work remains to be done, the possibility of time compression of the generated pulses and their use to implement a scheme for self-sampling is proposed and discussed. The sampling pulses may be extracted from the analogue signal to be sampled and the time-jitter of both might be automatically synchronized. This opens the possibility to eliminate the use of local mode-locked laser in an optical-sampler and the availability of sampling pulses free of relative jitter with the analogue signal to be sampled. Since the mode-locking may be the mechanism behind pulse generation, the stability issue should also be addressed.
The proposed and tested device is potentially optically integrable, requires ~mW optical power amplitude for the input analogue signal and outputs amplified pulses.
ACKNOWLEDGMENT
Ricardo M. Ribeiro thanks the team at Département d’Optique of Telecom Bretagne and the CapilRTM platform for hosting
his Post-Doctoral study during which the present work was carried out. The authors also thank Profs. Ammar Sharaiha and Tierry Rampone of ENIB (Plouzané, France) and INCT-Fotonicom/CNPq (Brasil).
REFERENCES
[1] J. J. Veselka and S. K. Korotky, Pulse Generation for Soliton Systems
Using Lithium Niobate Modulators, IEEE Journal of Selected Topics in
Quantum Electronics, vol. 2, No 2, 1996, pp. 300-310.
[2] H. Sayinc et al, Gain switched laser diode based all-fiber laser source
emitting simultaneously at 8 different wavelengths in the NIR region,
Advanced Solid-State Photonics (OSA/ASSP 2011), Istanbul, Turkey, February 13-16, paper ATuB7, 2011.
[3] J. W. D. Chi, A. Fernandez and C. Lu, Properties of Mode-Locked
Optical Pulses in a Dispersion-Managed Fiber-Ring Laser Using Semiconductor Optical Amplifier as Active Device, IEEE Journal of
Quantum Electronics, Vol. 49, No. 1, 2013, pp. 80-88.
[4] X. Wei, J. Leuthold and L. Zhang, Delay-interferometer-based optical
pulse generator, Optical Fiber Communication (OFC), February 22,
WL6, Los Angeles, CA, USA, 2004.
[5] G. P. Agrawal, Fiber-Optic Communication Systems, 4th edition, Wiley,
2010.
[6] A. J. Zilkie et al, Characterization of the ultrafast carrier dynamics of
an InAs/InGaAsP quantum dot semiconductor optical amplifier operating at 1.55 µm, Proceeding of SPIE, Vol. 5971, 2005, 59710G.
[7] T. Motet, J. Nees, S. Williamson and G. Mourou, 1.4 ps rise-time
high-voltage photoconductive switching, Applied Physics Letters, Vol. 59,
No.12, 1991, pp. 1455-1457.
[8] A. Khilo et al, Photonic ADC: overcoming the bottleneck of electronic
jitter, Optics Express, Vol. 20, No. 4, 2012, pp. 4454-4469.
[9] R. M. Ribeiro, F. Lucarz and B. Fracasso, An All-Optical Sampler for
Digitising Radio-over-Fibre Transceivers, 18th European Conference on
Network & Optical Communications (NOC 2013), July 10-12, Graz, Austria, 2013, pp. 27-34.
[10] M. Eiselt, Optical Loop Mirror with Semiconductor Laser Amplifier, Electronics Letters, Vol. 28, No. 16, 1992, pp. 1505-1507.
[11] Y. Zhang et al, Complete polarization controller based on
magneto-optic crystals and fixed quarter wave plates, Optics Express, Vol. 14,
No.8, 2006, pp. 3484-3490.
[12] Y. Miyoshi et al, All-Optical Analog-to-Digital Conversion Using
Split-and-Delay Technique, IEEE Journal of Lightwave Technology, Vol. 25,
No. 6, 2007, pp. 1339-1347.
[13] G. P. Agrawal, Applications in Nonlinear Fiber Optics, Academic Press, USA, 2001, pp. 125.
[14] N. J. Doran, D. S. Forrester and B. K. Nayar, Experimental investigation
of all-optical switching in fibre loop mirror device, Electronics Letters,
Vol. 25, No. 4, 1989, pp. 267-269.
[15] G. C. Valley, Photonic analog-to-digital converters, Optics Express, Vol. 15, No. 5, 2007, pp. 1955-1982.
[16] W. Ng, R. Stephens, D. Persechini and K. V. Reddy, Ultra-Low Jitter
Mode-Locking of Er-Fiber Laser at 10 GHz and its Application in Photonic Analog-to-Digital Conversion, International Topical Meeting
on Microwave Photonics (MWP2000), Oxford, UK, September 11-13, WE4.4, 2000, pp. 251-254.
[17] A. Taketomi et al, Compression of picosecond pulses with a chirped
volume Bragg grating, Photonic Global Conference (PGC21012),
Singapore, December 13-16, 2012, pp. 1-3.
[18] M. D. Pelusi, Y. Matsui and A. Suzuki, Pedestal Suppression from
Compressed Femtosecond Pulses Using a Nonlinear Fiber Loop Mirror,
IEEE Journal of Quantum Electronics, Vol. 35, No. 6, 1999, pp. 867-874.
[19] R. M. Ribeiro, F. Lucarz and B. Fracasso, Proposal and Design of an
All-Optical Encoder for Digitising Radio-over-Fibre Transceivers, 18th
European Conference on Network & Optical Communications (NOC 2013), July 10-12, Graz, Austria, 2013, 35-42.