HAL Id: hal-01780132
https://hal.archives-ouvertes.fr/hal-01780132
Submitted on 26 Sep 2018HAL is a multi-disciplinary open access
archive for the deposit and dissemination of sci-entific research documents, whether they are pub-lished or not. The documents may come from
L’archive ouverte pluridisciplinaire HAL, est destinée au dépôt et à la diffusion de documents scientifiques de niveau recherche, publiés ou non, émanant des établissements d’enseignement et de
Particle generation by sas process : effect of the
operating conditions on the specific surface area of the
powder
Élisabeth Rodier, Hubert Lochard, Martial Sauceau, Jean-jacques
Letourneau, Jacques Fages
To cite this version:
Élisabeth Rodier, Hubert Lochard, Martial Sauceau, Jean-jacques Letourneau, Jacques Fages. Particle generation by sas process : effect of the operating conditions on the specific surface area of the powder. 8th meeting on supercritical fluids, Apr 2002, Bordeaux, France. p.109-114. �hal-01780132�
P
ARTICLE GENERATION BY
SAS
PROCESS
:
EFFECT OF THE
OPERATING CONDITIONS ON THE SPECIFIC SURFACE AREA
OF THE POWDER
.
Rodier E, Lochard H, Sauceau M, Letourneau J-J, and Fages J. Ecole des Mines d’Albi, LGPSD-UMR CNRS 2392, 81013 Albi, France
e-mail: lochard@enstimac.fr, Fax: 33 (0)5 63 49 30 25
I-INTRODUCTION
Most of the new molecules in the pharmaceutical industry are almost water-insoluble. As water is the basis of any biological fluid, a challenge is to produce these molecules in such a way that their dissolution rate is increased thus improving their bioavailability for living organisms. This dissolution rate may depend on particle size and morphology and crystalline structure.
We present here a study performed on an active substance (A) obtained by a SAS process using dimethyl-sulfoxide (DMSO) as the solvent and supercritical CO2 as the
anti-solvent. The main varying parameters are CO2 density, relative ratio of CO2 to DMSO flow
rates, and A concentration in the injected solution. We measured the specific surface area of the particles obtained.
In the discussion we will examine our experiments according to mass transfer, hydrodynamics and supersaturation points of view.
II-MATERIALS AND METHODS
1 – Experimental set-up
The experiments have been carried out in a polyvalent pilot plant (Separex, France) designed to perform extraction, RESS (with and without co-solvent) and SAS. A schematic diagram of the apparatus is shown in figure 1. Carbon dioxide is cooled and stored in a liquid CO2 storage tank (2). It is circulated by a membrane pump (Lewa, Germany) (3).Compressed
CO2 passes then through a heater (4) and becomes supercritical.
In SAS configuration, the solution containing the solvent and a solute A (9) is co-injected with the CO2 stream and reach the nozzle (Spraying system model, France) by an
HPLC pump (8) (GILSON, 307 piston pump) and sprayed. The powder formed is collected in a porous bag inside the extraction vessel (7). CO2-solvent mixture is depressurised (10) and
separated in cyclonic separators (11). After purification through an active carbon bed (12) and cooling (14), the condensed CO2 runs back to the liquid CO2 storage tank.
The nozzle is a twin-fluid nozzle co-introducing CO2 and the solution and equipped with a
mixing zone just before the outlet. The diameter of the outlet is 1.1 mm.
2 – Materials and characterisation methods
CO2 (purity 99.995%) was supplied by Air liquide S.A., dimethylsulfoxide (DMSO)
The specific surface area of the solute particles was measured using the BET method (ASAP, 2010 Micromeritics) with nitrogen. The samples were all degassed before N2
adsorption during one night at 50°C .
T F CO2 6 7 10 11 12 9 8 5 4 13 3 2 14 1 P P P P P 11 11 1 : Co-solvent
2 : Liquid CO2 storage tank 3 : Membrane pump 4 : Heater
5 : Extractor (RESS) 6 : Nozzle
7 : Particle formation vessel 8 : Liquid pump (SAS) 9 : Solution (SAS)
10 : Back pressure regulator 11 : Cyclonic separators 12 : Adsorption bed
13 : Liquid CO2 pump (RESS) 14 : Condenser
F : Flowmeter P : Manometer T : Thermometer Figure 1. Schematic diagram of the supercritical set-up III-EXPERIMENTAL CONDITIONS
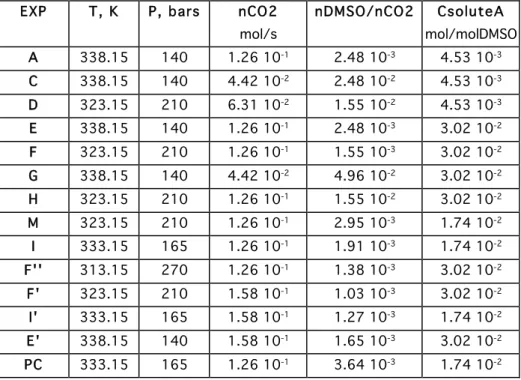
The different experiments performed are gathered in table 1. The main parameters are : - the solute concentration in the solvent DMSO,
- the relative ratio DMSO to CO2 flow,
- the CO2 density, calculated by Peng-Robinson EOS using the operating pressure and the
temperature :
140 bars, 338 K 165 bars, 333K 210 bars, 323 K 270 bars, 313 K dCO2 = 0.47 dCO2 = 0.61 dCO2 = 0.78 dCO2 = 0.90
IV-RESULTS
Microscopic photographs show that the particles of solute A obtained are rod or fibre-like and Differential Scanning Calorimetry show that they have the same polymorphic structure for all the experiments performed. As their shape make them difficult to measure by a granulometer, specific surface area is an adequate parameter to take into account particle size and morphology. The specific surface results obtained are presented in table2.
In a first step we checked that the dissolution rate was correlated with the specific surface area. So the solubilised mass of A after 2 hours was determined. These dissolution rates were all measured in the same medium with the same experimental procedure, at 37 °C.
We find that the dissolution rate is roughly linearly correlated to the specific surface area according to the following relation: Dissolution (µg/ml) = 1.207. Ss(m2/g)+1.2107 with a
correlation coefficient r2=0.831. This linear relation was established with 15 points.
EXP T, K P, bars nCO2 nDMSO/nCO2 CsoluteA
mol/s mol/molDMSO A 338.15 140 1.26 10-1 2.48 10-3 4.53 10-3 C 338.15 140 4.42 10-2 2.48 10-2 4.53 10-3 D 323.15 210 6.31 10-2 1.55 10-2 4.53 10-3 E 338.15 140 1.26 10-1 2.48 10-3 3.02 10-2 F 323.15 210 1.26 10-1 1.55 10-3 3.02 10-2 G 338.15 140 4.42 10-2 4.96 10-2 3.02 10-2 H 323.15 210 1.26 10-1 1.55 10-2 3.02 10-2 M 323.15 210 1.26 10-1 2.95 10-3 1.74 10-2 I 333.15 165 1.26 10-1 1.91 10-3 1.74 10-2 F'' 313.15 270 1.26 10-1 1.38 10-3 3.02 10-2 F' 323.15 210 1.58 10-1 1.03 10-3 3.02 10-2 I' 333.15 165 1.58 10-1 1.27 10-3 1.74 10-2 E' 338.15 140 1.58 10-1 1.65 10-3 3.02 10-2 PC 333.15 165 1.26 10-1 3.64 10-3 1.74 10-2
Table 1 : Experimental conditions
EXP A C D E F G H M I F’’ F’ I’ E’ PC
Ss,
m2/g 16.7 11.3 12.3 16.5 21.7 6.7 18.5 15.1 29 27 18.3 14.3 14.6 13.3
Table 2: Specific surface results
The point PC was done three times and the deviation on the specific surface was evaluated to ± 2.5 m2/g. This relatively important error includes several ones such as experimental, sampling and analysing errors. The most important uncertainties may arise from the sampling and from the quantity of DMSO present in the extractor which is not totally under control because of a residual content coming back with the recycled CO2.
V-DISCUSSION
We will try to discuss our experiments according to mass transfer, jet hydrodynamics and supersaturation points of view.
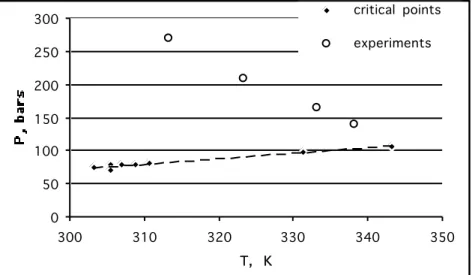
First, we have situated our experimental conditions in a diagram (cf. figure 2) pressure versus temperature as described by Werling et al. in [1]. On this figure, we have represented the experimental conditions and the locus of the critical points of our mixtures CO2-DMSO
calculated using the Aspen plus software as in [2] with the Peng-Robinson equation of state. We can see that all experiments are performed in the supercritical regime, far from the critical mixture conditions. In this zone, no physical interface exists between CO2-rich and
DMSO-rich regions and transfers are influenced by differences between density and diffusivity of these two regions. In the region of experimental points, density of pure DMSO is higher
(around 1.06) than density of pure CO2. According to Werling and Debenedetti [1], we are in
swelling « droplet » or « DMSO-rich region » conditions suggesting that net mass transfer would be from CO2-rich towards DMSO-rich region. But a knowledge of pure components
diffusion coefficients is needed to go further on the mass transfers.
Second, Bristow et al. [3] confirm that mixing processes are very important and they are linked to hydrodynamic conditions. We have calculated Reynolds numbers as defined in [4] for a free jet by: Re = u.d/ν with u flow speed determined by the total flow rate Qt divided by the area of the nozzle outlet and ν the cinematic viscosity of the fluid calculated using Aspen plus software.
0 50 100 150 200 250 300 300 310 320 330 340 350 T, K critical points experiments Linéaire (critical points)
Figure 2: Operating temperatures and pressures and CO2-DMSO critical locus
We obtained Reynolds numbers going from 5.4 x10⁴ for experiment C to 21.5 x 10⁵ for experiment E’. We are always in a case where Re>104 corresponding to turbulent
conditions with fast mixing. Here Bristow et al. said that the inertial-convective mechanism of mixing dominates and the molecular diffusivity and viscosity of mixing fluids become negligible. They gave in this case an order of the nucleation time constants for antisolvent precipitation of 10-5-10-4 s and say that in general, these values are of the same order or smaller than the mass transfer constants.
Hence, in our experimental conditions we may attain high supersaturations for the solute. Let us try to evaluate them. The definition of supersaturation is given in [3] and [5] and it is based on the difference of chemical potential of the solute between the real or operating conditions and the equilibrium values, as in equation (1):
µsolute−µsolute,eq = RT ln S = RT ln fsolute
fsolute,eq ⎛ ⎝ ⎜ ⎜ ⎞ ⎠ ⎟ ⎟ (1)
S being the supersaturation and fi the fugacities of the solute or fi =γ fiyiP , γfi is the
fugacity coefficient, yi the mole fraction of the solute i and P the pressure of the system.
In a first approach, we will over-simplify the problem as is done in [3], that is to say that we will neglect fugacity coefficient variations in our experimental conditions. Bristow et al. said that this approximation may be valid in the case of non-volatil solute at very low concentrations (typically below 10-4 mole fraction). In our case, mole fraction of the solute in
the mixture DMSO-CO2-soluteA is always below 10-4 except in the experiment G (ysolute = 1.4
10-3) and H (ysolute = 4.6 10-4).
For the equilibrium values, we evaluate y eq with a correlation established by Sauceau in [6]
taking into account the effect of the mixture density, temperature and solvent mole fraction. Sauceau determined the coefficients of this correlation performing experiments with the ternary mixture CO2-DMSO-solute at 318K for different pressures and different solvent mole
fractions. The experimental mole fractions ysolute were calculated assuming the feed mixture is
completely mixed, and: ysolute =
nsolute
nsolute+ nCO2+ nDMSO
, with ni being the mole flow of i.
Figure 3 shows results obtained for supersaturation, given by lnS, plotted as a function of the relative rate of solvent to CO2 mole flow, for various experimental conditions (molar
fraction of solute, pressure, temperature). When DMSO to CO2 relative rate increases,
supersaturation firstly increase because of an linear increase of ysolute , yeq remaining roughly
constant. Then, supersaturation decreases, the cosolvent effect as described in [6] becomes preponderant: as DMSO relative quantity increases, solubility (yeq) increases.
B I F' I'A F PC E' E D C G H 0 1 2 3 4 5 6 0.0% 0.5% 1.0% 1.5% 2.0% 2.5% 3.0% nDMSO/nCO2 P=165 bars; T=333.15K; C=0.0174 P= 140 bars; T=338.15K; C=0.0302 P=140 bars; T=338.15K; C=0.00453 P=210 bars; T=323.15K; C=0.0302 P=210 bars; T=323.15K; C=0.00453 Experiments
Figure 3: Supersaturation as a function of relative rate of solvent to CO2 mole flow for
different experimental parameters : P, T, Csolute in injected DMSO (mol/mol DMSO).
If we consider now both supersaturation and nucleation rate, the classic theory of nucleation claims that the nucleation rate increases with supersaturation, as reminded in [3]. This may explain results presented in figure 4 giving specific surface area of particles obtained in all the experiments performed in function of supersaturation.
We see that specific surface seems to increase with supersaturation. When supersaturation increases, nucleation rate increases favouring high particles numbers to the detriment of the growth of these particles, which can explain higher specific surface areas. VI–CONCLUSION AND PERSPECTIVES
In conclusion, we have checked that all experiments were conducted above the critical conditions of the mixture DMSO-CO2. Calculations of the Reynolds numbers at the nozzle
importance of nucleation kinetics on the specific surface area of the particles obtained. We have now to go further in this way calculating supersaturation in a more rigorous way taking into account the fugacity coefficient. Then we have to determine the nucleation rate, estimating the particle number. Besides, we have to develop our mass transfer knowledge, estimating for example diffusivities. For a better understanding of our process it would be interesting to give an estimation of the different time constants playing a part in our process, mixing time, nucleation time, growth time.
Figure 4: Specific surface of solute particles versus supersaturation VII-BIBLIOGRAPHY
[1] J.O. WERLING, P.O. DEBENEDETTI, Numerical modeling of mass transfer in the supercritical antisolvent process: miscible conditions, Journal of Supercritical Fluids, 18 (2000) 11-24
[2] J.J. LETOURNEAU, E.RODIER, H.LOCHARD, M.SAUCEAU, J. FAGES, High pressure phase equilibrium behaviour of naphtalene in supercritical-CO2: experimental results
and calculation with the Peng-Robinson equation of state, 8th meeting on supercritical fluids, Bordeaux, April 2002.
[3] S. BRISTOW, T. SHEKUNOV, B. Y. SHEKUNOV, P. YORK, Analysis of the supersaturation and precipitation process with supercritical CO2, Journal of Supercritical
Fluids, 21(2001) 257-271.
[4] N. MIDOUX, Mécanique et rhéologie de fluides en génie chimique, Tec&Doc Lavoisier, Paris, 1985.
[5] M.T. LIANG, The application of nucleation theories to the supercritical solutions, 3rd International Symposium on Supercritical Fluids, Strasbourg, France, October, 1994, Tome 3, 247-252.
[6] M. SAUCEAU, Mesure et modélisation de la solubilité de composés solides dans des fluides supercritiques : application à la génération de poudres. Doctorat de l’Ecole des Mines de Paris, spécialité Génie des Procédés, septembre 2001.
0 5 10 15 20 25 30 35 0 1 2 3 4 5 6 l n ( S ) Ss, m2 /g