C
ANAI
R
EPLACE THEFTC?
Giovanna Massarotto* & Ashwin Ittoo**ABSTRACT: The application of AI and Machine Learning (ML) techniques is becoming a primary issue of investigation in the legal and regulatory domain. Antitrust agencies are into the spotlight because antitrust is the first arm of government regulation by tackling forms of monopoly and collusive practices in any markets, including new digital-data-driven markets. A question the antitrust community is asking is whether antitrust agencies are equipped with the appropriate tools and powers to face today’s increasingly dynamic markets. Our study aims to tackle this question by building and testing an ML antitrust algorithm (AML) based on an unsupervised approach, devoid of any human intervention. It shows how a relatively simple algorithm can, in an autonomous manner, discover underlying patterns from past antitrust cases classified by commuting similarity. Thus, we recognize that teaching antitrust to an algorithm is possible, although we admit that AI cannot replace antitrust agencies, such as the FTC. Today, having an increasingly fast and uniform way to enforce antitrust principles is fundamental as we move into a new digital economic transformation. Our contribution aims to pave the way for future AI applications in markets’ regulation starting from antitrust regulation. Government’s adoption of emerging technologies, such as AI, appears to be the key for ensuring consumer welfare and market efficiency in the age of AI and big data.
JEL: K20; K21; K23; K42; L40; L43;L51; O30
I.
I
NTRODUCTIONBig data has become a game-changer and Artificial Intelligence (AI) models the best way to fully exploit such large amount of data. This paper builds on the growing interest in the application of Machine Learning (ML) techniques to the legal and regulatory domain. The main innovation of our research is that it lies at the intersection of Artificial Intelligence (AI) and antitrust discipline by exploring the application of AI in the antitrust enforcement.
Up to the writing of this paper, antitrust scholars have deeply investigated the ability of AI to generate anticompetitive behavior, such as the phenomenon of algorithmic collusion and price discrimination1. In contrast to these earlier studies of AI & antitrust, we adopt a different perspective. In particular, we are concerned with whether AI can assist antitrust enforcers addressing the critical need for both accelerating and harmonizing globally the enforcement of antitrust principles.2
The main question our paper aims to answer is: Can AI be exploited by antitrust agencies to enforce antitrust principles? This overarching question can be decomposed into a number of sub-questions:
* Adjunct Professor University of Iowa, Research Associate UCL CBT. ** Associate Professor, University of Liege.
1 See, e.g. Axel Gautier, Ashwin Ittoo & Pieter Cleynenbreugel, AI algorithms, price discrimination and collusion: a technological, economic and legal perspective, EUROPEAN J.L.ECON. (2020); Schwalbe, Ulrich, Algorithms, Machine
Learning, and Collusion, 14 J.COMPETITION L.&ECON. 568 (2019); Ariel Ezrachi & Maurice E. Stucke, Sustainable and Unchallenged Algorithmic Tacit Collusion, 17 NW. J.TECH. & INTELL. PROP. 217 (2020); Emilio Calvano,
Giacomo Calzolari, Vincenzo Denicolo’ & Sergio Pastorello, Algorithmic Pricing: What Implications for Competition
Policy?, 55 REV.INDUSTRIAL ORG. 155 (2019).
2 See, e.g. Eleanor M. Fox, The End of Antitrust Isolationism: The Vision of One World, 1 U
NIVERSITY OF CHICAGO
LEGAL FORUM 221 (1992); Douglas H. Ginsburg, International Antitrust: 2000 and Beyond, 68 ANTITRUST L.J. 571, 576 (2000).
i ) are pertinent characteristics that can be extracted from past antitrust cases; ii) are there underlying patterns characterizing antitrust cases;
iii) are the issues surrounding the adoption of AI in other branches of law, such as bias in criminal law, relevant to antitrust? In other words, is antitrust a better testing ground in the adoption of AI in the legal domain.
To the best of our knowledge, our study is the first to address these questions, which go to the heart of the recent Speech of the Assistant Attorney General, in which it was emphasized the need of understanding the potential of these cutting edge technologies, such as AI and ML, in the field of antitrust.3
To address our research questions, we first created a database of seventy-two past antitrust cases, spanning from 2005 to 2019. Because antitrust law is jurisdiction based, we focused on the U.S. antitrust jurisdiction, which includes two antitrust agencies: the Department of Justice (DOJ) Antitrust Division and the Federal Trade Commission (the FTC). These two agencies show very different powers and structure; in a first analysis no relevant pattern was detected by combining the decisions of both agencies. This is why we focused only on the FTC enforcement action in the selection of cases in our dataset. Each case is described along thirteen variables (features) such as the Industry, Type of Conduct and Behavioral Remedies.
Then, we developed a machine learning pipeline to automatically analyze these cases, compute the similarity between them, and cluster similar cases together, into well-formed, coherent groups. An important characteristic of our machine learning pipeline is that it relies on unsupervised learning (UL) algorithms, namely clustering methods, including K-Means, Bisecting K-Means and K-Modes (see Part 2.B.). Unlike their more popular supervised counterparts, unsupervised approaches operate with minimal human supervision. In addition, we performed extensive analysis of each cluster (group of similar cases) to determine which variables best characterized the various antitrust cases. This was achieved with two supervised learning algorithms, namely Random Forest and Support Vector Machines (see Part 3.B).
We proceeded our investigation by interpreting the algorithms results from an antitrust point of view. For example, we noted that cases from the data/computer industry were generally clustered with those in the healthcare industry, suggesting that these industries raise the similar antitrust concerns. The algorithm also clustered cases whereby conspiracy, the most detected conduct, is strictly related to exchange of information, and as a consequence the “limitation in the exchange of information” is recommend as one of the most common remedy (see Part 4).
In summary, as our results suggest, AI can serve as a useful tool to assist competition agencies in enforcing antitrust law in the age of big data and AI. More specifically, our study investigates how ML techniques can be used to automatically discover insights in past antitrust decisions, and extract underlying recurrent patterns from these decisions. These patterns can then be exploited for automatic the process of enforcing antitrust principles or, at least, provide to the agency the algorithm results based on its previous practice in real time and provide insightful results, as revealed in Part IV.
The idea of the paper stems from Giovanna Massarotto’s book “Antitrust Settlements-How a Simple Agreement Can Drive the Economy”, which analysed a relatively large volume of antitrust cases in the primary antitrust jurisdictions (the US and EU). The book put forward the idea of an ML algorithm, trained on previous antitrust cases, and used for assisting antitrust enforcers in regulating markets. In this paper, we go one step further by implementing and evaluating the algorithm trained with FTC’s cases and practices from 2005 to 2019.
3 Assistant Attorney General Makan Delrahim Delivers Remarks at the Thirteenth Annual Conference on Innovation Economics (Aug. 27, 2020), available at https://www.justice.gov/opa/speech/assistant-attorney-general-makan-delrahim-delivers-remarks-thirteenth-annual-conference.
This paper is structured into five Parts. Having introduced the project and aim of our paper, Part II serves as a background of: (i) the FTC role and powers within the U.S. Antitrust law enforcement framework; (ii) AI and AI methods; (iii) AI & Antitrust.
Part III investigates the methodology used in the development of our AI model in the context of antitrust. Part III also describes how the AI model and data to train the model have been selected. Both the results and variables of our AML have been here tested from a technical point of view.
Part IV analyses the results of our AML by assessing the adopted variables and their importance from an antitrust perspective. More specifically, we evaluate whether the variables detected by our algorithm as statistically relevant make antitrust sense. A similar analysis was conducted with respect to the clusters detected by our UL algorithm.
Part V ends this paper with some final remarks. Our main argument is that AI cannot replace antitrust agencies, such as the FTC, but it can represent a valuable tool to make the work of antitrust agencies more efficient and effective.
II.
G
RASPING THEM
EANING OFA
NTITRUST&
AI
In 2020, the new trend is investing in AI and jumping into the data industry. Data is the food to feed ML algorithms, which learn from large amount of data and represent today’s AI most successful application.4 Data is creating a variety of new opportunities for businesses along with new challenges for government agencies, as data-driven markets run on increasingly faster and sophisticated technologies, including ML algorithms. Traditionally, technologies run faster than the government, which often lacks technical knowledge of how technologies work and can evolve.5
Antitrust agencies are into the spotlight because antitrust is the first arm of government regulation by tackling forms of monopoly and collusive practices, which might occur at scale though algorithms (e.g. algorithmic collusion).6 A question the antitrust community is asking is whether antitrust agencies are equipped with the right tools and powers to tackle the present challenges in such a fast moving technological environment.7 Our study aims to tackle this question by building and testing an ML antitrust algorithm.
Before diving into the explanation of our ML antitrust algorithm developed in Part III, it is helpful to clarify why we focused on the FTC enforcement action, and why antitrust can be a good testing ground for future AI applications in the regulatory domain. This evaluation requires having a brief background on the role of antitrust economic regulation and the main AI techniques available, which are also provided in Part II.
A. Antitrust
As outlined in Part I, we have built a ML algorithms based on the FTC proceedings under Section 5 of the FTC act. In particular, we used the FTC’s proceedings settled by means of consent
4 T
HOMAS HARDJONO,DAVID L.SHRIER &ALEX PENTHLAND,TRUSTED DATA,ANEW FRAMEWORK FOR IDENTITY AND
DATA SHARING (MIT Press, 2019).
5 Bruce Schneier, “Click Here to Kill Everybody” Talks at Google [Video file] (2019). Retrevied from
https://www.youtube.com/watch?v=GkJCI3_jbtg.
6 Giovanna Massarotto, From Standard Oil to Google: How the Role of Antitrust Law Has Changed, 41 W
ORLD
COMPETITION 395 (2018); GIOVANNA MASSAROTTO,ANTITRUST SETTLEMENTS:HOW A SIMPLE AGREEMENT CAN DRIVE THE ECONOMY 145 (Wolters Kluwer, 2019).
7 See, e.g., Ariel Ezrachi & Maurice E. Stucke, Artificial Intelligence and Collusion: When Computers Inhibit Competition, 5 U. Ill. L. Rev. 1775 (2017).
decrees. Section A explains why we made this decision by reviewing the main characteristics of the U.S. antitrust enforcement mechanism with a concentration on the FTC (no merger) enforcement action.
1. Antitrust Economic Regulation
Antitrust law originated in the U.S.A. at the end of the 19th century as a tool of economic democracy to regulate new booming markets, including oil and the telecommunication industry, subject to forms of private monopolization and collusion.8 Since its origin, antitrust law has changed by adapting to the market conditions; especially in the U.S.A. economics and economic analysis is dominating the U.S. antitrust enforcement action. The open-ended competition provisions gave economists the powers to shape antitrust policy.9 Prof. Barry Hawk defined antitrust as “an economic law,” because “economics must play a predominant (if not exclusive) role”10 in assessing anticompetitive practices and set the appropriate relief.11 In other words, antitrust is completely grounded on economic concepts and principles, such as consumer welfare and market efficiency.
In addition, we have to consider that in the U.S.A. (which is the jurisdiction at hand), antitrust litigations play a marginal role as “over the last three decade the Agencies [DOJ and FTC] have resolved nearly their entire civil enforcement docket by consent decrees.”12 This antitrust consent solution puts in place remedies agreed with the company under investigation before or during a trial.
The wide adoption of consent decrees sacrifices the benefit of having courts creating case law, 13 leaving the same antitrust agencies and companies to regulate markets through agreed remedies enshrined in a consent decision.14 Differently from the DOJ, the FTC can settle proceedings without the need of adjudication by a court.
Consent decrees determine behavioral or structural remedies grounded on economic analysis, which de facto impose a kind of regulatory regime.15 Because antitrust agencies have the power to enforce competition principles in any markets, antitrust can be defined as the first arm of government regulation.16 More specifically, in contrast to the Federal Communication Commission (FCC), which in the U.S.A. regulates the telecommunication industry,17 Section 5 of
8 Giovanna Massarotto, Grasping the Meaning of Big-Tech Antitrust Consent, CPI (Feb. 24, 2020), available at
https://www.competitionpolicyinternational.com/grasping-the-meaning-of-big-tech-antitrust-consent/; Massarotto,
From Standard Oil to Google: How the Role of Antitrust Law Has Changed, supra note6.
9 William E. Kovacic & Carl Shapiro, Antitrust Policy: A Century of Economic and Legal Thinking 43, 14 J. Econ. Perspective (2000).
10 Barry E. Hawk, System Failure: Vertical Restraints and EC Competition Law, 32 COMMON MARKET L. Rev. 973, 986 (1995).
11 MASSAROTTO, supra note6.
12 Joshua D. Wright & Douglas H. Ginsburg, The Economic Analysis of Antitrust Consents, 3 E
UR. J. OF L. AND
ECONOMICS, Forthcoming (Mar. 14, 2018). Available at SSRN: https://ssrn.com/abstract=3140736. 13 See, e.g., Harry First, Is Antitrust “Law”?, 10 A
NTITRUST 9 (1995); Douglas A. Melamed, Antitrust: The New Regulation, 10 ANTITRUST 13 (1995), MASSAROTTO, supra note6at 209-213.
14 Consent decrees enable antitrust agencies to save time and reduce the costs of an expensive trial. Similarly, companies avoid the risk of expensive and uncertain trials, fines and reputation damages as no finding of liability is made.MASSAROTTO, supra note6at 7.
15 Giovanna Massarotto, The Deterrent and Enunciating Effects of Consent Decrees, 11 J.C
OMP.L.&ECON. 493, 497
(2015).
16 Herbert Hovenkamp, Progressive Antitrust (2018). Faculty Scholarship. 1764. https://scholarship.law.upenn.edu/cgi/viewcontent.cgi?article=2766&context=faculty_scholarship. (“[A]ntitrust policy is an extended arm of regulation.”) Id.
17 Ronald Coase, The Federal Communications Commission, 56 J. L. & ECON. 879, 883, 884 (2013). (“The Commission was […] provided with massive powers to regulate the radio industry…In 1934 the powers exercised by the Federal Radio Commission were transferred to the Federal Communications Commission, which was also made responsible for the regulation of the telephone and telegraph industries.”) Id.
the FTC Act18 gave the FTC a wide range of discretion in regulating potentially any markets and industries.
In summary, if we consider the FTC antitrust enforcement action in exam, antitrust enforcement mechanism resembles to an economic regulation rather than a law. Economic concepts drive the decisions on what the FTC considers as anticompetitive conduct, as well as the types of antitrust remedies to adopt.
2. The FTC and Section 5 of the FTC Act
As mentioned, in the jurisdiction at hand (the U.S.A. jurisdiction) there are two antitrust agencies: the FTC and the DOJ. While the FTC is an administrative agency with regulatory powers, the DOJ Antitrust Division represents the USA in criminal antitrust cases and traditionally exerts the role of prosecutor.19 The FTC and DOJ complement each other, although sometime their authorities overlap.20
Our study specifically focuses on the FTC antitrust enforcement action under Section 5 of the FTC Act. Because the Supreme Court recognized that “all violations of the Sherman Act also violate the FTC Act,”21 the FTC can bring charges that concern activities banned by the FTC Act along with the Sherman Act. However, the FTC is not technically in charge of enforcing the Sherman Act and is the only agency that can open an investigation under the FTC Act.22
According to Section 5 of the FTC Act, the FTC has exclusive authority to regulate “unfair methods of competition…. and unfair or deceptive acts or practices,”23 which prevents persons, partnerships or corporations from engaging in unfair practicing of competition.24 In other words, Section 5 gave the FTC a wide range of discretion in controlling and regulating any markets.25 Again, Section 5 of the FTC Act is mainly enforced through consent decrees defined between the Commission and the company subject to the antitrust scrutiny. Prof. Joshua Wright and Jan M. Rybnicek observed that “Section 5 enforcement has resulted in no litigated cases,” 26 but on regulatory settlements—consent decrees—which are the subject of our study used to train our ML algorithm. Therefore, as explained in Part III, we used data related to Section 5 of the FTC Act proceedings settled by means of consent decrees, being different proceedings statistically irrelevant, thus meaningless in our investigation of detecting patterns.
To sum up, the FTC is the administrative agency in the U.S.A. in charge of enforcing competition principles under Section 5 of the FTC, which gave broad authority to the
18 Under Section 5 of the FTC Act, the FTC regulates “unfair methods of competition…and unfair or deceptive acts or practices.” 15 U.S.C. §45(a).
19 The FTC “was meant to practice preventive law through administrative and regulatory activities as well as by the initiation and conduct of adversary proceedings … Both agencies were to work in the same field, but with different tools.” Hon. Edward F. Howrey, The Federal Trade Commission and the Administrative Process (Section of Antitrust law of NY ABA, Jan. 28, 1954) at 1.
20 Federal Trade Commission, The Enforcers,
https://www.ftc.gov/tips-advice/competition-guidance/guide-antitrust-laws/enforcers (last visited Sep. 30, 2020). 21 Id.
22 Id.
23 15 U.S.C. § 45(a).
24 William E. Kovacic & Winerman Marc, Competition Policy and the Application of Section 5 of the Federal Trade Commission Act, 76 ANTITRUST L.J. 929, 930 (2010).
25 Richard Posner, Federal Trade Commission, 72 A
NTITRUST L.J. 761, 765-66.
26 Jan M. Rybnicek & Joshua Wright observed that “Section 5 enforcement has resulted in no litigated cases” focusing on regulatory settlements defined by the Commission. Jan M. Rybnicek & Joshua D. Wright, Defining Section 5 of the
FTC Act: the Failure of the Common Law Method and the Case for Formal Agency Guidelines, 21 GEO.MASON L.
REV. 1287, 1305 (2014). See also William E. Kovacic & Winerman Marc, Competition Policy and the Application of
Commission to regulate U.S. markets. Rather than limiting the FTC to prosecute specific unfair forms of competition in specific industries, Section 5 is framed in very general terms.27
The structure and powers of the FTC resembles to those of many antitrust agencies all over the world. EU National Antitrust agencies are mostly administrative agencies with powers similar, although generally more precise (less open-ended) that the US antitrust regulator. Therefore, the same or similar AI techniques that have been applied in building the ML algorithm at hand are likely to be implemented for many other agencies.
B. AI primary concepts
In this section, we provide a brief overview on the AI primary concepts relevant for our antitrust ML algorithm. In particular, we provide an overview of ML and the main approaches/techniques available in the learning process. The following discussion is limited to the main concepts and terminology relevant to the build our ML and follow our reasoning.
1. AGI v. Weak AI
AI is generally referred to as the design and development of machines endowed cognitive abilities, akin to humans. Scholars and practitioners alike distinguish between two types of AI: Artificial General Intelligence (AGI), commonly known as strong AI, and weak AI.
While AGI aims to enable machines to perform any task within the realm of human abilities; weak AI, which is today the predominant form of AI, enables machines to do very well one task. Symbolic examples of weak AI applications are: automatic translation, detection of objects/persons on photos, and speech recognition in personal digital assistants. Weak AI includes feats publicized in mainstream media, such as outperforming human champions in the games of GO28 and Starcraft,29 as well as AI in specific domains, such as in medicine for detecting cancer cells from x-images.30. In common parlance, the term “AI” is generally understood to refer to weak AI and ML techniques represent the main weak AI applications.
Next, we present an overview of common “AI” methods and techniques applied to develop today’s most popular AI applications/products. For space considerations and to avoid going out of scope, we focus only on the main characteristics of these methods. We provide a more detailed description of the techniques employed in our study in Part III.B.
2. Machine Learning (ML)
Today, ML is the main AI method used to run from speech recognition, such as Alexa or Siri, to self-driving cars. ML algorithms enable machines to learn how to perform a task, such as playing chess and translating texts (e.g. Google translator), though experience. In other words, engineers or data analysts are now collecting a large amount of data to train algorithms that detect patterns
27 See, Jan M. Rybnicek & Joshua D. Wright, supra note 26 at 1287; Kovacic & Winerman Marc, supra note 26, at 929-30.
28 The AlphaStar team, AlphaStar:Granmaster level in StarCraft II using multi-agent reinforcement learning (Oct. 20, 2019), available at https://tinyurl.com/y3x822y5.
29 Nick Statt, DeepMind’s StarCraft 2 AI is now better than 99.8 percent of all human players (Oct. 30, 2019), available at https://www.theverge.com/2019/10/30/20939147/deepmind-google-alphastar-starcraft-2-research-grandmaster-level.
30 Ivan Mehta, Google’s New AI Detects Breast Cancer Just by Scanning X-ray (2020), available at
https://thenextweb.com/artificial-intelligence/2020/01/02/googles-new-ai-detects-breast-cancer-just-by-scanning-x-ray/.
and build models to make predictions.31It is worth mentioning that Deep Learning (DL) is a specific form of machine learning, relying solely on complex neural network architectures. 32
There are three main ML approaches that machines can adopt to learn: (i) supervised learning (SL); (ii) unsupervised learning (UL) and (iii) reinforcement learning (RL). Below, we describe only the SL and UL paradigms as they adopt completely opposite learning procedures, and our proposed method is based on UL. The comparison between SL and UL would better enable the reader to understand our motivation in opting for the method described in Part III.B.33
3. Supervised Leaning (SL)
In SL, an algorithm is presented with huge volumes of example data, collected from the past. These data will consist of a number of variables (e.g. age, education level, salary) as well as a label, which corresponds to the information of interest (e.g. credit risk level).
The algorithm will then identify relationships between the variables (known as independent variables) and the information of interest (known as the dependent variable or target). For example, the algorithm may learn that customers of a certain age and salary tend to have a high/low credit risk level. Those relationships are usually established using methods originating from mathematics and/or statistics. This phase of learning from past annotated data is known as training. Once the algorithm has been trained, it can be applied to make predictions on new unseen cases.
The peculiarity of SL is that its requirement for large volumes of training data, annotated with the label of interest. Several SL algorithms exist such as random forests, neural networks and support vector machines. They differ in the way in which they learn the relationships between variables.
.
4. Unsupervised Leaning (UL)
Unlike SL and RL methods, Unsupervised Learning (UL) algorithms are generally not concerned with learning how to perform specific tasks. As such, there is neither a training phase in which the algorithms learns from past annotated data nor an exploration phase in which they explore their environments to determine an optimal action sequence to maximize specific rewards. In other words, UL algorithms operate without any type of supervision or external (reward) signal. The main aim in UL is to discover latent structures or extract rules or associations from data, without any prior training or exploration phases. That is, the algorithms operate completely on their own (in an “unsupervised” manner).
The approach we have adopted in our ML is known as clustering, which identifies latent structures within a dataset and involves estimating the similarity between various data points, and grouping similar data points into clusters. For instance, clustering is widely adopted in marketing as it enables to identify clusters of similar consumers that can be charged similar prices or recommended similar products. The similarity between data points is often estimated by first projecting these data points as vectors in a multi-dimensional space, and then, computing the distance between them using measures such as the Euclidean distance. Subsequently, data points that are found to be close to each other (based on the computed distance) are grouped into clusters.
31 Accordingly to the seminal definition of Mitchell (1997): “A computer program is said to learn from experience E with respect to some class of tasks T and performance measure P if its performance at tasks in T, as measured by P, improves with experience”.
32 We refer the reader to the work of Yann LeCun, Yoshua Bengio & Geoffrey Hinton, Deep Learning, 521 N
ATURE
436 ( 2015).
33 Francois-Lavet et al. An Introduction to Deep Reinforcement Learning (2018). For more information on RL, we refer the reader to the work of Vincent Francois-Lavet, Peter Henderson, Riashat Islam & Marc G. Bellemare, An
Literature distinguishes between two types of clustering approaches, namely, partitional and hierarchical. Partitional clustering methods partition the data points into clusters based on the estimated similarity. In hierarchical clustering, the data points are organized in a hierarchical fashion based on their similarity. The resulting hierarchies are nested sequence of clusters, known as dendograms. As can be expected, partitional and hierarchical methods rely on different distance (similarity) measures.
Several clustering algorithms exist, including K-means and bisecting K-Means (partitional) and divisive and agglomerative methods (hierarchical), which we have applied to our ML and we’ll be further developed in Part III.B.
C. Why Antitrust and AI?
Now that we have clarified the FTC role and powers within the U.S. antitrust law enforcement framework under Section 5 of the FTC Act and the main AI techniques relevant for our project, lets explain why we considered interesting the investigation of AI techniques in the enforcement of antitrust law.
As mentioned, today there is a growing interest in the application of ML techniques to the legal domain. However, some previous applications of AI algorithms in the law enforcement did not meet the expected results questioning its validity in the law enforcement. Compas is only a symbolic example of algorithm employed in the U.S. legal system with the aim to make the judicial mechanism more efficient. Compas was trained to assist judges in Florida in defining whether a defendant was likely to re-offend34 and should remain in jail or release while the trial was pending.35
Yet, the algorithm clearly showed bias in the system. According to the study conducted by the independent online newsroom Propublica, “defendants predicted to re-offend who actually did not were disproportionately black.”36 This algorithm exhibits the risks related to the adoption of AI techniques, which can lead to bias at scale if the algorithm is not correctly built and trained. A natural question to ask is whether it is worth to devise algorithm to enforce law, including antitrust law.
Despite an initial skepticism, as previously observed, the FTC antitrust enforcement resembles to a tool of economic regulation. Therefore, antitrust might serve as testing ground for the exploitation of AI techniques in future regulatory interventions based on economic reasoning. In this way government agencies could gain in efficiency and companies have a better understanding of what can consist of an anticompetitive practice.
III.
A
NTITRUST&
AI
T
ECHNIQUESHaving described the reasons why we chose the FTC enforcement action under Section 5 of the FTC Act to train our ML and the AI primary concepts relevant for our project, Part III describes all steps we took to build our antitrust ML (AML) dataset. Section A explains in details how we collected data included in our dataset. Section B describes the ML methods applied to analyze the dataset, including for computing similarities between antitrust cases, for identifying pertinent
34 M
ARK COECKELBERGH,AIETHICS 127 (MIT Press Essensial Knoledge Series, 2020).
35 Karen Hao & Jonathan Stray, Can you Make AI Fairer than a Judge? Play our Courtroom Algorithm Game, MIT Technology Review (Oct. 17, 2019), available at https://www.technologyreview.com/2019/10/17/75285/ai-fairer-than-judge-criminal-risk-assessment-algorithm/.
36 C
characteristics of these cases and assessing the results’ quality.
A. AML Dataset
1. Data Collection
Data collection and analysis is the first step we took for building our AML. Specifically, we had to identify what were the appropriate data to collect, as well as significant variables to consider for training our AML. A readily-available source of data for the proposed ML algorithm was the collection of cases analyzed in Massarotto (2019).37 These cases covered both the U.S. and European jurisdiction, with a concentration from 2013 to the end of 2018 and the U.S. cases included both the FTC and DOJ proceedings.
However, as outlined in Part II, a closer inspection revealed significant heterogeneity among the various jurisdictions and antitrust agencies (e.g. FTC and DOJ). Thus, as explained in Section B, our final data set was narrowed to the FTC cases opened under Section 5 of the FTC Act and settled through consent decrees over a wider range of time: from 2005 to Nov. 2019. We included a total of seventy-two proceedings. We collected data directly from the FTC official website, which was the same source used in the book (Massarotto, 2019) in the analysis of the FTC’s (no merger) proceedings.38
In the following, it is explained how we selected variables and related data from the FTC’s “Cases and Proceedings” database. 39
2. AML variables
From each analyzed FTC’s proceeding, we extracted data regarding: a) the year; b) the name of the proceeding (which usually identifies the parties involved); c) the affected industry; d) the investigated anticompetitive conduct; e) the adopted remedies.
Initially, we also considered data concerning the affected markets, the market shares of the entities subject to investigation, and if the market at hand was a natural monopoly, as well as a two-sided market. However, the fact that the market was “two-sided” resulted no significant from a statistical point of you as there were a very few cases related to such markets. Similarly, it did not make sense to consider the variable related to the “affected markets” as markets were often too different among each other and narrowly defined, while “market shares” and the fact that there was a “natural monopoly” were rarely identified in the proceeding, thus also useless for our AML.
We initially considered whether the FTC imposed a monetary sanction or disgorgement. However, due to fact that the monetary sanction/disgorgement was present in a very few cases, we consider this dimension/data also statistically irrelevant for training our ML algorithm.
In summary, we excluded these dimensions and related data keeping in our data set only those referred to the year, the name of the proceeding, the industry affected, as well as the specific investigated anticompetitive conduct and adopted remedies.
Because a ML algorithm is able to read only numeric or categorical variables, we needed to codify the collected data for each variable as described in the following paragraph.
3. Data Classification
37 MASSAROTTO, supra note6.
38 G
IOVANNA MASSAROTTO,ANTITRUST SETTLEMENTS:HOW A SIMPLE AGREEMENT CAN DRIVE THE ECONOMY (Wolters
Kluwer, 2019).
With respect to the variable “Year”, we defined 5 years or ranges of time: - 2019 - 2018 - 2017 - 2016 to 2014 - 2013
The Industry was categorized in: Data industry; Computer industry; Healthcare/Pharmaceutical; Professional/Trade associations; Gas&Oil; Barcode; Sport industry; Telecommunications; Transportation industry; Real estate; Funeral service industry.
As far as anticompetitive conduct, we identified the following categories: - exclusionary conduct (A)
- predatory conduct (B); - refusal to deal (C); - tying conduct (D); - price fixing (E); - rebates (F);
- discriminatory practice (G); - customer allocation agreement (H); - pay for delay (I);
- disruption in the bidding process (J); - agreement orchestration (K);
- invitation to Collude (L); - agreement not to compete (M);
- unlawful exchange of information (N); - concerted practices (O);
- conspiracy (P); - no Poach (Q);
- no anti-competition (NOCOND)
Because in all analyzed cases there were maximum four investigated conduct per case, we considered from a minimum of one to a maximum of four conduct per case.
With respect to the antitrust remedies defined in each consent order, we distinguished between structural and behavioral remedies and we specified for each case the type of remedies adopted in the FTC order. We identified a maximum of five remedies imposed per proceeding, and we classified the “type of remedy” imposed in the following categories:
- R1: amendments to contract provisions - R2: amendments of the code of ethics - R3: obligation to disclose information - R4: limitation to enter into specific markets - R5: refrained from the investigated conduct - R6: compliance obligations
- R7: implementation of an antitrust compliance program - R8 contract limitations
- R9 divestiture
- R10 impose specific contract requirements - R11 limitation in the exchange of information - R12 permanent injunction
- R13 other performance obligations (e.g. equipment interoperability in Intel case) - NOREM (no remedies)
However, in our dataset we have excluded the first remedy (namely “remedy 1”), as in all cases the FTC required the entity subject to investigation to refrain from the investigated conduct, hence “R5”. Therefore, we started from considering the second remedy (hence the “remedy 2” variable) in each proceeding in exam.
4. Final dataset
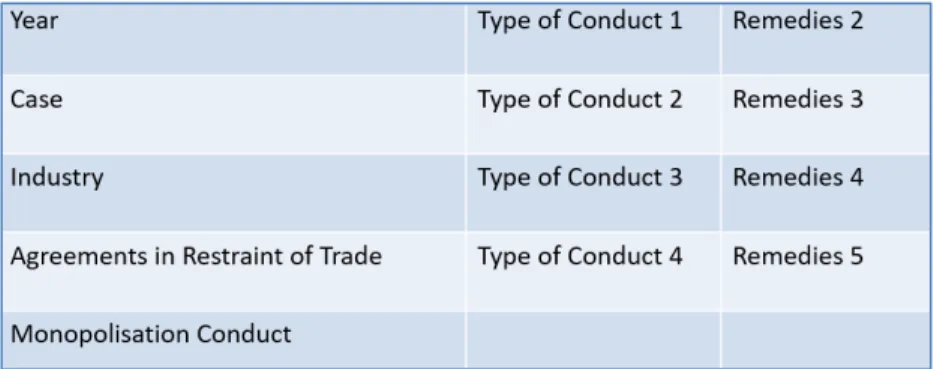
To sum up, the final dataset we used to train our ML includes seventy-two proceedings under Section 5 of the FTC Act from 2005 to November 2019, settled by means of consent decrees. The final variables that we included in the ML learning process are: 1) the industry; 2) type of conduct
1; 3) type of conduct 2; 4) type of conduct 3; 5) type of conduct 4; 6) structural remedies; 7)
behavioral remedies; 8) remedy 2; 9) remedy 3; 10) remedy 4; 11) remedy 5.
B.
Methodology
After gathering, classifying data and defining the variables of our dataset, we studied a variety of UL techniques (clustering methods: K-Means, Bisecting K-Means, K-Modes), which attempted to automatically identify similar cases in our dataset. Section B explains in details such a study and what clusters our ML generated, as well as the most significant dimensions (variables) detected through the adoption of Random Forests and Support Vector Machines algorithms.
1. EDA & preprocessing
Before processing data, we engaged in the so-called pre-processing activity by means of the Exploratory Data Analysis (EDA), which enables to examine a dataset and detect any peculiarities or incoherencies exhibited by the data points. Note that each data point corresponds to an antitrust case in our dataset.
In other words, EDA permits to correct any errors that might have been introduced during data collection and is fundamental in machine learning (data science) endeavors, because EDA determines how to preprocess data to make them more amenable to the application of specific machine learning algorithms. In summary, EDA enables to clean data in a dataset to improve the performance of a ML—namely its learning process by ensuring that the data fed to the algorithms are correct and of good quality to not compromise the algorithms’ accuracy and results .
The EDA here determined that two columns (variables) “Structural Remedies” and “Behavioral Remedies” appeared to be irrelevant and would not provide any meaningful information for the subsequent steps of our analysis. With respect to “Structural Remedies” variable, all the cases recorded in our database had a value 0 implying that there were no structural remedies adopted in the analyzed cases. Thus, it was dropped from our database.
Similarly, the second variable “Behavioral Remedies” contained values, which were distributed in an imbalanced manner, i.e. unequally. Specifically, we noted that only two cases in the databases had a value of 0 for Behavioral Remedies, while all the remaining cases had a value of 1 for that same variable. Thus, this variable was also dropped for our dataset, because such an uneven distribution of values either causes the performance of machine learning algorithms to deteriorate or might lead to the algorithms learning incorrect relationships. For instance, in our given situation (2 cases with value 0 and the rest with value of 1), algorithms might be biased into giving more weights to the cases with a value 1 (since they constitute the majority). Techniques dealing with data imbalance exist. For example, with undersampling, we could remove cases with the majority value (i.e. Behavioral Remedies=1) from our dataset so as to balance the distribution.
However, this would have resulted into a dataset so small that any further analyses would not yield any meaningful information.
In particular, the application of undersampling would have resulted in a database containing 2 cases with Behavioral Remedies=0 and 2 cases with Behavioral Remedies=1 (total of 4 cases). Another solution to address data imbalance is the SMOTE (Synthetic Minority Oversampling Technique).40 However, the basic premise of SMOTE is the creation of synthetic data points based on their similarity with other data points. Such an approach would be unsuitable for our study as we are concerned with real (antitrust) cases. The data points (cases) generated by SMOTE to balance our database would therefore be of very limited (if at all, any) value.
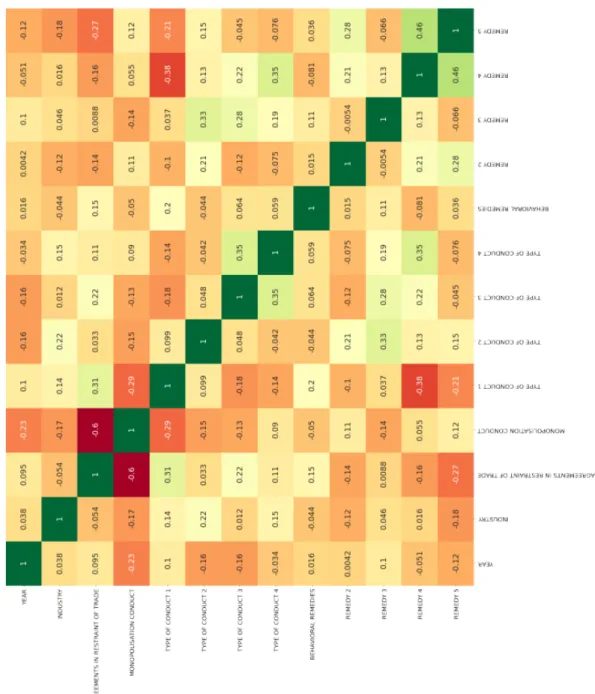
In addition, as part of the EDA, we determined whether the variables were correlated to each other. In statistics (and machine learning), correlated variables tend to have a significant impact of the final predictions (or clusterings). If two variables are correlated, then, they could have a significantly higher (joint) influence on the final prediction (clustering). Thus, they could bias the algorithm’s learning procedure. To address this issue, we visualized the variables’ correlations according to a heat map, displayed in Figure 1 (variables are displayed on the x and y axes). The greener the cell the higher is the correlation. As can be expected, each variable is highly correlated to itself, which is natural. Furthermore, the heat map revealed no apparent correlation among variables, which do not warrant further multi-collinearity tests.
40 Alberto Fernandez, Salvador Garcia, Francisco Herrera & Nitesh V. Chawla, SMOTE for Learning from Imbalanced Data: Progress and Challenges, Marking the 15-year Anniversary, 61 J.ARTIFICIAL INTELLIGENCE RESEARCH 863 (2018).
2. Methods for Computing Similarity between Antitrust Cases
After preprocessing, we focused on analyzing the data using machine learning in order to address our research questions and achieve our objectives.
In particular, we worked on:
• discovering underlying patterns characterizing antitrust cases and using these patterns to generate clusters of similar cases;
• identifying the most pertinent variables, characterizing antitrust cases in our dataset. These variables will tend to have the highest impact or importance when computing the similarity between cases. Also, these variables, if properly identified, could enable antitrust enforcers and legislators to better comprehend antitrust cases and even predict their outcomes.
• Automating the entire process to minimize human intervention for two main reasons. First, we are interesting in investigating whether machine learning algorithms are capable of (automatically) inferring similarity between antitrust cases, i.e. how far can these algorithms go? Second, automation facilitates scaling up, i.e. the same process can be used to examine additional cases or larger datasets when more cases become available. A manual analysis could prove to be unwieldly in such situations.If our findings prove to be conclusive and meaningful, then we would have strong reasons to believe that our entire framework (of discovering case similarity and highlighting most pertinent variables) could be useful as a decision support tools for antitrust judges and policy makers. It could also enable corporations to determine upfront whether any of their actions is likely to breach antitrust regulations.
3.Unsupervised Learning - Clustering
Our aforementioned aims motivated the adoption of an unsupervised learning paradigm. We are interested in algorithms that discover underlying patterns from cases and cluster similar cases together without (or with very minimal) human intervention. Specifically, we adopted clustering algorithms, which were briefly discussed in Part II. Among the two families of clustering algorithms, viz. partitional and hierarchical (see Section B.II: Unsupervised Learning), the former lent itself more naturally to our tasks. Furthermore, hierarchical approaches are generally more computationally expensive and have higher run-time complexity than their partitional counterparts.
Several partitional clustering algorithms exist. Because it is extremely difficult determining which algorithms will give the best performance, it is common to experiment several algorithms and then choosing the best one. Consequently, we decided to investigate three partitional clustering algorithms: K-Means, Bisecting K-Means and K-Modes.
a. K-Means & K-Modes
K-Means is considered as one of the most popular clustering algorithms. It aims at identifying K groups (clusters/partitions) from a dataset, such that two constrains are satisfied. First, data points that are grouped within one cluster should be maximally similar to each other. Second, data points in a given cluster should be maximally dissimilar to data points in other clusters. In essence, the fundamental premise of K-Means is that of maximizing intra-cluster similarity and of minimizing inter-cluster similarity. Broadly speaking, it splits a dataset into K groups (clusters) such that each group contain instances that are very similar to each other. For e.g., in the context of market segmentation, each group could consist of individual with the same age, education level and annual income (variables).
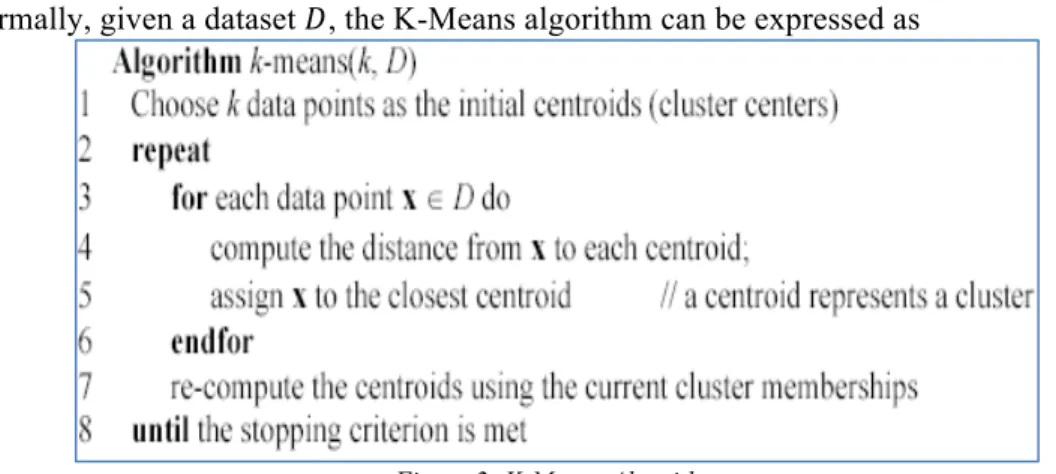
Formally, given a dataset 𝐷, the K-Means algorithm can be expressed as
Figure 2: K-Means Algorithm
The value of K, denoting the number of desired clusters, is best determined via experimentation. Specifically, one would investigate the clustering obtained from different values of K (e.g. K = 3, 4, 5, …) and then choose that value of K that gives the best performance, estimated according to a given metric, such as the silhouette score (to be discussed later).
Several methods (and measures) are used to compute the distance (similarity) between data points (which are expressed as vectors of variables). In most K-Means application, the de-facto measure is the Euclidean distance, illustrated in the equation below. In this equation, 𝑥 is a data point from the database 𝐷 of dimension 𝑟 (i.e. the database 𝐷 contains 𝑟 columns/variables), while 𝑚 represent the centroid (mean value) of a given cluster 𝑗.
(𝑥!!− 𝑚!! )!+ (𝑥
!!− 𝑚!!)!+ … (𝑥!"− 𝑚!")!
The centroid of a cluster 𝐶 is calculated by summing up all the vectors (data points) within 𝐶, and dividing by the total number of points in that cluster, |𝐶|.
A data point 𝑥 will then be assigned to that cluster 𝐶! (among the possible K clusters) whose
centroid 𝑚! is nearest to 𝑥.
K-Modes is an extension of K-means specifically targeted at categorical data (K-means is best suited for numerical data). Categorical data are data which can take on a fixed set of values (vs. numerical values which can vary from positive infinity to negative infinity). Examples include Industry Sector= { Telecom, Healthcare, …} or Type of Conduct = {Predatory Conduct, Refusal to Deal, …}. However, it is important to note that even though K-Means is designed for numerical data, it can also be applied to categorical data. In the latter case, each the categorical variables in the data are “factorized” via the introduction of dummy variables. This is the approach we adopted in our experiments.
b. Bisecting K-Means
Bisecting K-Means is a hybrid algorithm, combining both the divisive (hierarchical clustering) and the K-means (partitional approach). In general, it tends to perform better than K-Means (and K-Modes), and is more efficient particularly when K is large (i.e. large number of clusters is desired). Specifically, while K-Means requires the computation of the distance between each data point and the clusters’ centroids, in Bisecting K-Means only the data points in one cluster and two centroids are considered. Thus, it is less computationally expensive and has lower run time than K-Means. Furthermore, compared to K-Means, Bisecting K-Means tends to generate equally-sized clusters.
The value of K, specifying the desired number of clusters, is application dependent and chosen by the user after experimentation with different values of K, as is the case with K-Means (or K-Modes), i.e. based on the silhouette score (to be discussed later). The Bisecting K-Means algorithm operates as follows. First, all data points in the database are assigned to a single cluster. Then, K-Means is applied to split (bisect) the database into two clusters, i.e. K is set to two. Next, the sum of square distance for the data points within each cluster (intra-cluster distance) is estimated as
In the above equation, 𝑋! is a vector representing a data point (and comprised of individual
variables 𝑥!) and 𝑋 is the mean value. The value 𝑛 denotes all clusters.
The cluster with the largest intra-distance is selected and is bisected as before. At each split, the resulting (two) clusters are added in a hierarchical/tree structure. These steps are repeated until K clusters are obtained at the tree leaves (end/bottom of the tree).
c)Evaluating Cluster Quality (Silhouette Score)
Evaluating cluster quality is considered as a challenging task in managing. This difficulty can be attributed to the unsupervised nature of clustering algorithms and the absence of labeled (ground-truth) data, conversely to supervised learning methods (which learn from labeled data, as described in Section 2).
The most reliable approach for cluster evaluation is therefore by relying on domain experts, who then determine whether the points assigned to each cluster are indeed similar to each other, i.e. whether the clusters constitute a coherent group. However, a manual evaluation by domain experts is usually not viable as it tends to be time-consuming and expensive. Furthermore, as mentioned before, we aim at developing an automated approach for analyzing and classifying antitrust cases.
Consequently, we relied on the silhouette score to gauge the clusters’ quality. The silhouette score estimates the average similarity of the points within a cluster (intra-cluster similarity) and their distance to points in other clusters (inter-cluster similarity). Recall that the aim of clustering algorithms is to produce clusters that do not overlap, i.e. with high intra-cluster similarity and low inter-cluster similarity.
For each data point 𝑖, we define
The value of 𝑎(𝑖) represents the average distance of the point 𝑖 to all the other points that belong to the same cluster 𝐶!. Large 𝑎(𝑖) implies that the data point 𝑖 is dissimilar to its cluster.
Then, we define the mean dissimilarity of point 𝑖 to some cluster 𝐶! as the mean of the distance
from 𝑖 to all points in 𝐶!. That is,
Note that the 𝑚𝑖𝑛 operator indicates the (cluster with the) smallest mean distance to 𝑖. This closest cluster is known as the “neighboring” cluster.
From these values, the silhouette score can be computed as
The global silhouette score is then
4. Clustering Results
In our experiments, we evaluated the performance of the three aforementioned clustering algorithms, viz. K-Means, bisecting K-Means and K-Modes. That is, the best algorithm and the best set of parameters were determined empirically by learning them from our dataset characteristics. Performance, in terms of the quality of the various clustering produced, was assessed according to the elbow method coupled with the silhouette scores, described earlier. a. Selecting the best Model
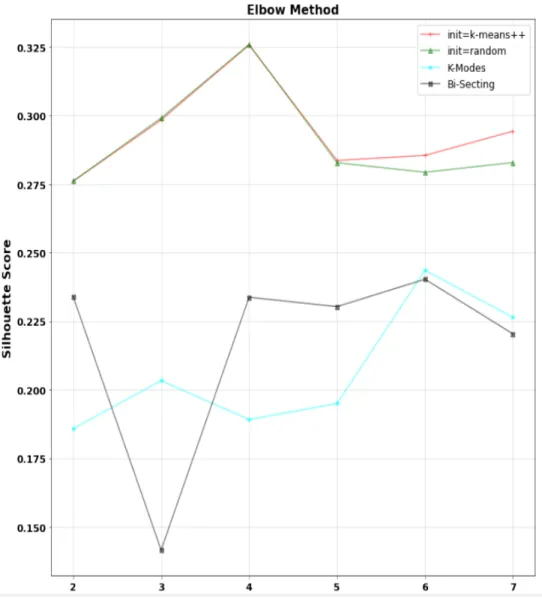
Figure 3
depicts the silhouette scores achieved by the Means, Bisecting Means and K-Modes algorithms by varying the number of clusters. Note that such plots are referred to as “elbow plots” (or “elbow methods”).Figure 3: Elbow Plots & Silhouette Scores (K-Means, K-Mode, Bisecting K-Means)
As can be seen, the best performing algorithm (in terms of silhouette scores) is the K-Means, with four clusters (red and green plots – each indicating different ways by which the K-Means algorithm was initialized). It can also be observed that the best silhouette scores for both K-Modes and Bisecting K-Means (cyan and black plots respectively), were achieved with six clusters. These scores were significantly lower than that of the K-Means.
b. Confirming K-Means’ Superiority
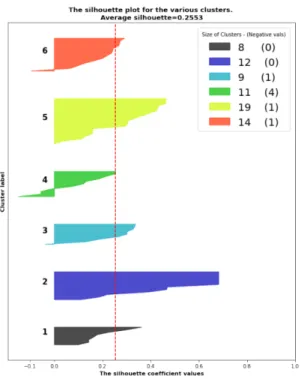
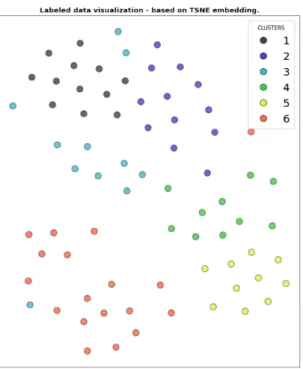
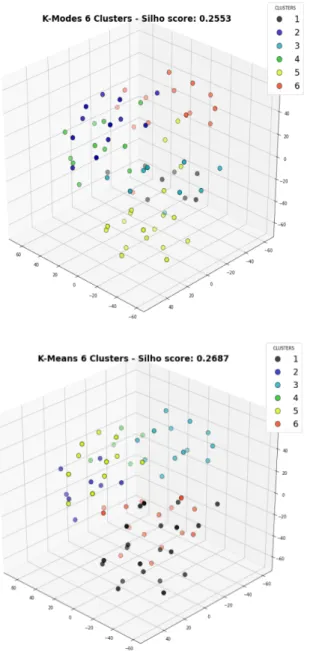
In our next set of experiments, our aim was confirm that K-Means was actually best performing. We adopted an intuitive approach (to confirm our empirical findings), and relied on the distribution of data points achieved by each clustering algorithm (K-Means, Bisecting K-Means, K-Modes). Specifically, for each of these algorithms, we considered only their optimal number of clusters, i.e. that number of clusters, which yielded the best silhouette scores. Recall that for K-Means, the optimal score was achieved with K=4 clusters, while the optimal K-Modes and Bisecting K-Means was achieved with K=6 (see
Figure 3
). Then, for each of these configurations, we plotted the i) silhouette scores, ii) a 2D plot showing how the various datapoints and clusters were distributed, iii) a corresponding 3-D plots. These plots are presented below.
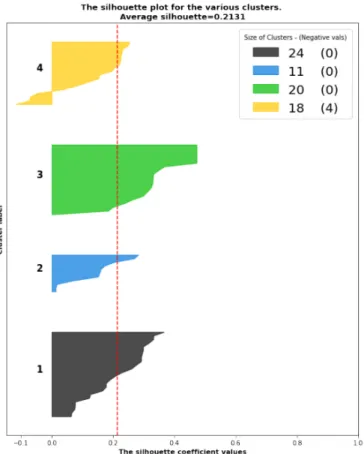
K-Means (4 clusters)
Figure 4: Silhouette Scores, 4 clusters K-Means
Figure 5: Silhouette Scores, 6 clusters K-Mode
Bisecting K-Means (6 clusters)
These figures reveal that the best performing algorithm is the K-Means with four clusters. Besides the higher silhouette scores, it can also be seen from the 2-D and 3-D plots that the clusters generated by K-Means are more coherent. Specifically, the data points are more uniformly distributed within each cluster. This can be visually observed by the arrangement of the colored dots in the plots. It can also be observed that there is much less overlap between clusters.
This can be conceptualized as the algorithm having more certainty that a certain data point. Therefore, when presented with a new case, the algorithm has a higher certainty in predicting the cluster to which it could potentially belong. Conversely, we note that the clusters produced by the K-Mode and Bisecting K-Means are very near to each other, with lots of data points overlapping between clusters. This reveals that the K-Mode and Bisecting K-Means both have difficulties in precisely determining the best cluster in which a given data point could be classified, i.e. they have a lower confidence in clustering cases.
5. Identifying Pertinent Characteristics of Antitrust Cases
a. Why Variables care?As discussed earlier, in our dataset, we defined each antitrust case according to a number of columns (also known as variables or features). We subsequently discarded two variables, namely Behavioral Remedies and Structural Remedies as they did not appear to be of any information value, i.e. they carried very limited information to enable us precisely distinguish between (clusters of) antitrust cases. The final dataset, used in our experiments, comprised of the following variables (with Structural Remedies and Behavioral Remedies being crossed off). Also, the dataset comprised of 74 antitrust cases.
Figure 9: Variables/Features of Antitrust Dataset
A pertinent question, both from a legal and a machine learning perspective, is that of determining which of these variables have a higher information content. The aim is therefore to find a reduced subset of variables that best characterize the cases. In other words, we (or antitrust enforcers and legislators) should be able to draw conclusions or make predictions from our antitrust cases only by looking at a subset of variables. This question is relevant as it could reveal certain underlying patterns that antitrust bodies and legislators implicitly (or even unconsciously) consider when looking at antitrust cases. Leaving the antitrust evaluation to Part IV, from a machine learning perspective, the identification of a small subset of highly informative variables is crucial to enable the algorithms in making more precise and definite decisions. In other words, the presence of a large number of variables, some of which might be irrelevant or just noise, is likely to confuse the algorithms, compromising its performance.
b. ML Variables (Testing)
Here, we describe our feature selection experiments. After applying our algorithms (Means, K-Modes, Bisecting K-Means) to our dataset, each point (i.e. antitrust case) will be assigned to a
unique cluster (see
Figure 7
). We treat each cluster as a category, resulting in four categories (labeled 1-4) for Means and in six categories (labeled 1-6) for both Mode and Bisecting K-Means.Then, we determine which variables of the data points in a given category (cluster) was more predictive of that cluster. In other words, we measured the degree to which a given variable (e.g. Industry) influenced the cluster to which a data point would be eventually assigned to. For e.g., do data points with {Industry = Telecom, Type_of_Conduct=”- exclusionary conduct”} have a higher probability of being assigned a given cluster (e.g. cluster 3). To this aim, we relied on a Random Forest algorithm, which attempts to transform the data points (and variables) into a collection of tree-like structures, and in doing so, estimates how much each variable is predictive of a given cluster. Specifically, it relies on the measure of entropy, derived from Shannon’s Information Theory, and which, broadly speaking, estimates the order or disorder in the data if a given variable is removed.41
The same procedure (using Random Forests) to determine the most influential variables in assigning data points to clusters was repeated for the clusters (labels) generated by Means, K-Mode and Bisecting K-Means. However, we will focus our discussion on the K-means (with four clusters) configuration, which was the best performing compared to the others according to the silhouette scores (see Figure 3).
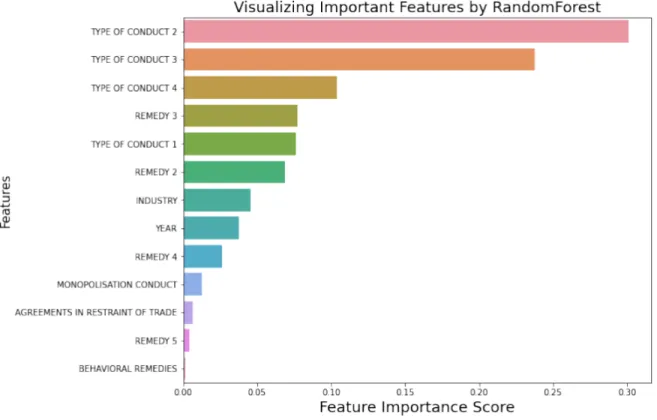
The top-5 variables thus identified were namely Type of Conduct 2, Type of Conduct 3, Type of Conduct 4, Remedy and Type of Conduct 1. Variables (features) and their relative weights (importance) as computed by the Random Forest algorithm are presented in
Figure 10
. For the sake of illustration, we also included the variable Behavioral Remedies in the plot. It can be seen that it is among the least important variables, therefore warranting its removal, as was described earlier.41 For an overview of the Random Forest algorithm, we refer the reader to: Gerard Biau & Erwan Scornet, A Random Forest Guided Tour, 25 TEST 197 (2016). https://doi.org/10.1007/s11749-016-0481-7.
Figure 10: Variable/Feature Importance
We went a step further and investigated variable importance per cluster (i.e. for each of the four clusters for the K-Means). Results are depicted in Figure 11.
Figure 11: Variable Importance per Cluster (only for K-means, 4 clusters shown)
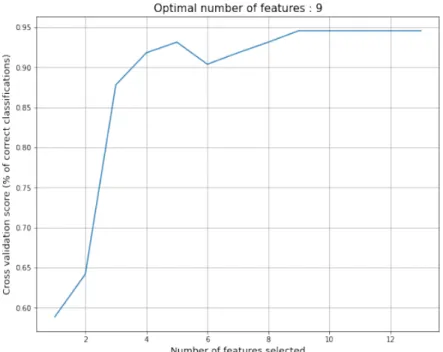
To validate these results, we employed another method, namely a Support Vector Machine (SVM) for estimating the degree to which a variable influences the cluster to which a data point is assigned. Broadly speaking, an SVM is a machine learning approach that attempts to find the best hyperplanes separating points that belong to different categories (clusters). The SVM was trained using Recursive Feature Elimination. Given the limited size of our dataset, training was achieved using 5-fold cross validation. Specifically, given the clusterings produced earlier (K-Means with 4 clusters, K-Modes and Bisecting K-Modes with 6 clusters each), the SVM was trained to predict the cluster (category) based on data points that had been assigned (by K-Means, K-Mode, Bisecting K-Means) to each category. The same experiment was repeated by varying the number of features and the accuracy (of predicting the cluster/category) was assessed. Results are shown in Figure 12. They indicate that the best accuracy is achieved with nine features. A closer inspection revealed that these nine features were: Year, Industry, Type of Conduct 1, Type of Conduct 2, Type of Conduct 3, Type of Conduct 4, Remedy 2, Remedy 3, Remedy 4.
Figure 12: SVM Accuracy vs. Number of variables
Finally, we compared the set of pertinent variables identified by both methods (Random Forest, SVM). We kept only those features identified by both. They were namely: Remedy 3, Type of Conduct 1, Type of Conduct 2, Type of Conduct 3, and Type of Conduct 4, as described in Section 3.1. It is important to note that the order or magnitude of the importance of these variables differed. For example, according to the Random Forest algorithm, the most pertinent variable was Type of Conduct 2. However, according to the SVM algorithm, this variable was the third most important. Such phenomenon is common in machine learning due to noise and some degree of randomness inherent in the learning procedure.
IV.
A
NTITRUSTI
NTERPRETATION OFR
ESULTSIn Part IV, we analyze the outcomes of our ML algorithms and the different techniques applied from an antitrust point of view. In particular, Part IV is divided into the following three subsections, which include an evaluation of: A. Clusters; B. Variables; C. UL & Limitations.
In Section A we assess whether the four clusters resulted from our ML algorithm make antitrust sense. In Section B we made the same evaluation with respect to the detected variables to determine if their importance from a technical point of view reflects their validity from an antitrust perspective. In other words, we examined whether the variable importance identified in general and per cluster in Section B.III is meaningful for antitrust.
Finally, we discuss limitations revealed in our ML and related outcomes. In other words, we evaluate our approach critically by considering rooms for improvement.
A. Clusters
machine learning process was the K-Means, which generated four clusters. Here, we analyze the four clusters from an antitrust perspective to assess their validity.
1. Cluster 1
The most interesting result in cluster 1 is related to the industry. All cases concerning computer industry and data have been detected in cluster 1. The cases were only three in those industries, but it is curious to notice that all of them appear in the same cluster. Fourteen cases out of twenty concern the healthcare/pharmaceutical industry and the remaining three cases involve professional/trade associations.
The conduct that is more frequent is conduct “E”, price fixing, which appears in eight cases and conduct “A” related to exclusionary conduct that is present in seven cases. The remedy that appears the most frequently in Cluster 1 is “R8” referred to contract limitation, which occurs eight times and “R6”, namely “compliance obligations,” identified in seven cases.
In summary, cluster 1 seems to suggest that the algorithm looks at price fixing and exclusionary conduct in the healthcare/pharmaceutical industry by adopting contract limitations and compliance obligations as remedy. Cases in the computer/data industry seem to raise antitrust concerns similar to those present in the healthcare industry.
2. Cluster 2
All twenty cases identified in cluster 2 occurred in the same time frame, from 2005 to 2013. Nine out of the ten cases concerning the real estate industry appear in cluster 2, meaning that all cases related to the real estate industry, with one exception, have been detected in this cluster.
This cluster is characterized by the number of conduct investigated as in the majority of cases (thirteen out of twenty cases) the FTC looked at three or more anticompetitive practices (namely more than 2 antitrust conduct). In seventeen out of twenty cases appears type of conduct “P”, namely “conspiracy.” As we will see, this is relevant for the identification of the employed remedies.
In nineteen out of twenty cases, the FTC adopted “R6” hence “compliance obligations.” In seven cases out of twenty appears remedy “R11” referred to “limitation in the exchange of information.” Although the detected practices are still quite different from each other to be able to determine a specific logic/rule behind the investigated antitrust practices and the remedies imposed, this result still looks interesting from an antitrust point of view. Conspiracy, the most detected conduct, is strictly related to exchange of information, and as a consequence the “limitation in the exchange of information” recommend as one of the most common remedy revealed in Cluster 2.
To sum up, the ML algorithm suggests that the FTC, in cases in which are investigated more than two anticompetitive practices, adopts “compliance obligations” as remedy by default. Because seventy percent of cases concern “conspiracy” as one of the conduct, the ML recommends imposing also “limitation in the exchange of information” as remedy. The results revealed in this cluster appear to be particularly valuable for cases concerning the real estate industry, given that they were almost entirely included in this cluster.
3. Cluster 3
In the third cluster the machine identified eighteen cases. In seventeen out of eighteen the FTC investigated merely one or two anticompetitive practices. More precisely, fifteen out of eighteen cases concern proceedings in which was investigated only one anticompetitive conduct. In seven