HAL Id: hal-01677122
https://hal.inria.fr/hal-01677122
Submitted on 8 Jan 2018
HAL is a multi-disciplinary open access
archive for the deposit and dissemination of
sci-entific research documents, whether they are
pub-lished or not. The documents may come from
teaching and research institutions in France or
abroad, or from public or private research centers.
L’archive ouverte pluridisciplinaire HAL, est
destinée au dépôt et à la diffusion de documents
scientifiques de niveau recherche, publiés ou non,
émanant des établissements d’enseignement et de
recherche français ou étrangers, des laboratoires
publics ou privés.
BIGnav: Bayesian Information Gain for Guiding
Multiscale Navigation
Wanyu Liu, Rafael Lucas d’Oliveira, Michel Beaudouin-Lafon, Olivier Rioul
To cite this version:
Wanyu Liu, Rafael Lucas d’Oliveira, Michel Beaudouin-Lafon, Olivier Rioul. BIGnav: Bayesian
Infor-mation Gain for Guiding Multiscale Navigation. ACM CHI 2017 - International conference of
Human-Computer Interaction, May 2017, Denver, United States. pp.5869-5880, �10.1145/3025453.3025524�.
�hal-01677122�
BIGnav: Bayesian Information Gain
for Guiding Multiscale Navigation
Wanyu Liu
1,2Rafael Lucas D’Oliveira
3,1Michel Beaudouin-Lafon
2Olivier Rioul
1 1LTCI, CNRS, Telecom ParisTech
Université Paris-Saclay
F-75013, Paris, France
2
LRI, Univ. Paris-Sud, CNRS,
Inria, Université Paris-Saclay
F-91400, Orsay, France
3
Applied Mathematics
University of Campinas
Campinas, Sao Paulo, Brazil
{wanyu.liu,olivier.rioul}@telecom-paristech.fr, [email protected], [email protected]
ABSTRACT
This paper introduces BIGnav, a new multiscale navigation technique based on Bayesian Experimental Design where the criterion is to maximize the information-theoretic concept of mutual information, also known as information gain. Rather than simply executing user navigation commands, BIGnav terprets user input to update its knowledge about the user’s in-tended target. Then it navigates to a new view that maximizes the information gain provided by the user’s expected subse-quent input. We conducted a controlled experiment demon-strating that BIGnav is significantly faster than conventional pan and zoom and requires fewer commands for distant tar-gets, especially in non-uniform information spaces. We also applied BIGnav to a realistic application and showed that users can navigate to highly probable points of interest on a map with only a few steps. We then discuss the tradeoffs of BIG-nav—including efficiency vs. increased cognitive load—and its application to other interaction tasks.
ACM Classification Keywords
H.5.2. [Information Interfaces and Presentation]: User Interfaces-Interaction styles; I.3.6 [Computer Graphics]: Methodology and Techniques-Interaction techniques
Author Keywords
Multiscale navigation; Guided navigation; Bayesian experimental design; Mutual information
INTRODUCTION
Multiscale interfaces are a powerful way to represent large datasets such as maps and deep hierarchies. However, navigating these spaces can be frustrating and inefficient. Most applications, such as Google Maps, only support pan-and-zoom [22]. Others, such as the DragMag [32], use focus+context techniques. In both cases they leave the user in complete control of navigation, leading to frustrating situa-tions such as getting “lost in desert fog” [17].
Permission to make digital or hard copies of all or part of this work for personal or classroom use is granted without fee provided that copies are not made or distributed for profit or commercial advantage and that copies bear this notice and the full citation on the first page. Copyrights for components of this work owned by others than ACM must be honored. Abstracting with credit is permitted. To copy otherwise, or republish, to post on servers or to redistribute to lists, requires prior specific permission and/or a fee. Request permissions from [email protected].
CHI 2017,May 06-11, 2017, Denver, CO, USA © 2018 ACM. ISBN .
DOI:Author’s_version
A few techniques assist navigation by taking advantage of the system’s knowledge of the information space: topology-aware navigation [21], visual saliency mediated navigation [16], ob-ject pointing [11] and semantic pointing [3] “steer” users to-wards potential targets, therefore reducing the risk of getting lost. Other techniques interpret users’ intentions to guide navigation: SDAZ [14], for example, adjusts the zoom level according to the user-controlled velocity. While these ap-proaches have proven effective, we believe we can do better by combining them into a more general framework.
We introduce BIGnav, a guided navigation technique that uses both the a priori knowledge of the information space and the progressively acquired knowledge of the user’s intention. BIGnavguides navigation through a three-step process: 1. The system interprets user input as an intention revealing
what the user is and is not interested in;
2. The system then updates a probabilistic model of the infor-mation space to take into account this intention;
3. Finally the system navigates to a new view such that the sub-sequent user input will maximize the expected information gain of the system.
BIGnavuses Bayesian Experimental Design [19], an approach where the system “runs experiments” on the user to maximize an expected utility. This utility is information gain, a concept from information theory [28, 29] that represents the amount of information obtained about a variable, here the intended target, from another variable, here the user’s input. In other words, BIGnavis a form of human-computer partnership where user and system cooperate to achieve a common objective. The rest of the paper is organized as follows. After a review of related work and a short introduction to Bayesian Experimen-tal Design, we introduce BIGnav in detail. We describe a 1D simulation to show how the system can guide navigation to a target using only a few commands. We then report on a con-trolled experiment with 16 participants comparing standard pan-and-zoom navigation with BIGnav. Finally, we describe a real-world application for navigating maps and conclude with directions for future work.
RELATED WORK
BIGnavuses a human-computer partnership to guide naviga-tion. We therefore discuss related work in assisted multiscale navigation and human-computer collaboration and adaptation.
Assisted Multiscale Navigation
Pan and zoom are the canonical navigation commands in mul-tiscale interfaces. Panning lets users change the position of the view while zooming lets them modify the magnification of the viewport [8, 22]. Navigation tasks consist in acquiring or pointing a specific target, characterized by a position and size. It generally involves view navigation, whereby the user must first bring the target into view, at a scale where it can be selected. Despite being quite different from traditional pointing, Guiard & Beaudouin-Lafon [10] have shown that Fitts’ law [6] applies to multiscale pointing. Therefore we adopt Fitts’ paradigm and use the index of difficulty (ID) in our controlled experiment to assess pointing performance. Much work has explored effective pan-and-zoom navigation. Furnas & Bederson [7, 8] introduced space-scale diagrams to better understand navigation trajectories in multiscale inter-faces. Igarashi & Hinckley [14] proposed Speed-Dependent Automatic Zooming (SDAZ), where the zooming factor de-pends on the user-controlled velocity so that users do not need to directly control zooming. By contrast, Appert & Fekete [1] created Orthozoom, a 1D scroller where users control zooming by moving along the scroller’s orthogonal dimension, improv-ing navigation in very large documents. BIGnav uses a dif-ferent approach: it assists navigation by interpreting classical pan-and-zoom commands to calculate a new view according to an information gain criterion.
Other approaches assist navigation by exploiting features of the information space. GravNav [16] uses visual saliency to combine standard pan and zoom with an attention vec-tor. Topology-aware navigation [21] guides panning move-ments along the links of a node-link structure. Content-aware scrolling [15] uses the content of the document to control the direction, speed and zooming factor. In a similar vein, Galyean [9] assists 3D navigation by pulling users along a pre-computed path, while still letting them deviate slightly from it. Similar to these approaches, BIGnav takes advantage of the structure of the information space to guide navigation, but uses a probabilistic model to represent its knowledge.
Collaboration and Adaptation
While the notion of cooperative interaction between humans and computers is quite ancient [18], the concept of human-computer collaboration has emerged in HCI more recently [31]. In human-computer collaboration, two agents, a human and a computer, work together to achieve shared goals. A key aspect of collaboration is communication, for example to de-fine goals, negotiate how to proceed and determine who will do what. Similar ideas can be found in mixed-initiative de-sign[12], human-computer partnership [27] and continuous uncertain interaction[33]. All these approaches suggest that great opportunities lie between systems that provide automatic services [13] and systems where users are in direct control [30]. BIGnavapplies this general framework to multiscale naviga-tion, which to our knowledge has not been done before. Several approaches have used the notion of information to guide navigation and pointing. Pirolli & Card [25, 26] have introduced the concept of information foraging, whereby peo-ple adapt their navigation strategies to increase information
in an information seeking task. An important difference with our work is that in information foraging, users do not know where the information is located. In addition, information foraging is based on Optimal Foraging Theory while BIGnav is based on Bayesian Experimental Design [19]. Williamson & Murray-Smith [34] use control theory and an entropy-based method where agents “run ‘experiments’ on the user” to let the user select a target without pointing. This work is closest to ours, however the proposed system used randomized stimuli while BIGnav maximizes the expected information gain. Finally, Mackay [20] has proposed the concept of co-adaptationbetween people and technology to describe how users adapt to technology but also adapt technology to their needs. However, as with information foraging, co-adaptation comes from the users, not the system. In BIGnav, the system adapts to user’s input and navigates to the view such that the user’s subsequent input will provide maximum information. In other words, the system both adapts to the user and seeks valuable information from the user.
BACKGROUND: BAYESIAN EXPERIMENTAL DESIGN
This section provides background on Bayesian Experimental Design and Information Theory. Readers familiar with these two concepts can skip this section. Only formulas (1) and (4) are used in the rest of the paper.
Consider a scientist who wants to determine some parameter θ of nature. He can choose to perform an experiment x that will provide an observation y. A probabilistic model is used where Θ, X and Y are the random variables corresponding to θ , x and y, respectively. Bayesian Experimental Design [19] provides a framework to optimize the choice of the experi-ment x by maximizing an expected utility, commonly defined in terms of the information gained about the parameter θ by the experiment x. The utility may also involve factors such as the financial (or other) cost of performing the experiment. To optimize the choice of the experiment, the scientist needs two pieces of information, or priors:
1. A prior probability distribution P(Θ = θ ) for all values of θ , which expresses the scientist’s knowledge about the random variable Θ before the experiment; and
2. A conditional probability distribution1P(Y = y ∣ Θ = θ , X = x)of the observation Y given the actual value of the param-eter θ and the chosen experiment x.
After an experiment x is performed and an observation y is ob-tained, the scientist updates his knowledge about the parameter θ through Bayes’ theorem:
P(Θ = θ ∣ X = x,Y = y) =P(Y = y ∣ Θ = θ , X = x)P(Θ = θ ) P(Y = y∣X = x) (1) where P(Y = y ∣ X = x) = ∑ θ′ P(Y = y ∣ Θ = θ′ , X = x)P(Θ = θ′).
This new probability distribution serves as the new prior, on which the scientist can perform another experiment.
1
The conditional probability P(A = a ∣ B = b) reads “the probability of A= a given B = b”.
The goal of an experiment is to reduce the uncertainty about Θ. As a measure of this uncertainty we use Shannon’s entropy function2[28, 29]. Initially, the scientist’s uncertainty about Θ is given by H(Θ). After performing an experiment X = x and having observed Y = y, the scientist’s uncertainty about Θ is given by H(Θ∣X = x,Y = y). The information gain is the difference between these two uncertainties:
IG(Θ∣X = x,Y = y) = H(Θ) − H(Θ∣X = x,Y = y). (2) It is generally not possible to know a priori how much infor-mation a specific experiment will give3. However, for each experiment one can calculate the expected information gain4: IG(Θ∣X = x,Y ) = H(Θ) − H(Θ∣X = x,Y ). (3) To calculate the expected information gain, the scientist uses Bayes’ theorem for entropies to convert equation (3) to:
IG(Θ∣X = x,Y ) = H(Y ∣X = x) − H(Y ∣Θ, X = x). (4) where the first term is given by
∑
y
P(Y = y∣X = x)log2P(Y = y∣X = x).
and the second one by ∑
y,θ
P(Θ = θ )P(Y = y∣Θ = θ , X = x) log2P(Y = y∣Θ = θ , X = x).
All the elements in these terms are given by the two priors given to scientist. The scientist can therefore calculate the expected information gain for each possible experiment and choose the experiment that he expects to be most informative.
BIGnav: BAYESIAN INFORMATION GAIN NAVIGATION
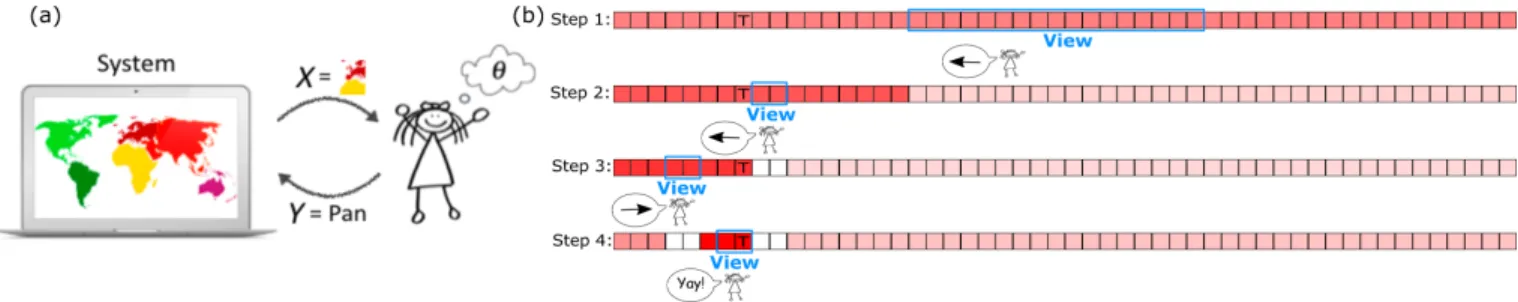
The key idea of our approach is to have the system “run ex-periments” on the user in order to gain information about the user’s goal, i.e., the intended target. BIGnav uses Bayesian Experimental Design as follows (Fig. 1a):
● The system plays the role of the scientist;
● The unknown parameter θ is the intended target (known only to the user);
● The experiment x is the view that the system shows to the user after each input; and
● The observation y is the user input after seeing x.
Scenario
Before describing the process in detail, we illustrate how it works through a brief scenario introducing Lucy.
Lucy is a HCI student exploring howBIGnav works on a 1D map featuring isolated islands. To navigate to a particular island, she issues a series of commands to go left, go right or zoom in. With only two islands on the map, a single input 2
The Shannon entropy of a random variable V that takes n possible values, the i-th value of which has probability pi, is given by H(V) =
−∑n
i=1pilog2pi. Entropy is usually measured in bits and can be
interpreted as the level of uncertainty about a variable. It is maximal when all possible values of the variable have the same probability.
3
Information gain might be negative but is positive on average.
4
Also known as the mutual information I(Θ;Y∣X = x), which in contrast to equation (2), is always positive.
is sufficient forBIGnav to determine the intended target and update its probability distribution of most likely target. With three islands, all to the left of Lucy, the first input will go to the most likely island if BIGnav has some prior knowledge about what Lucy wants. Otherwise, it will show the island in the middle and wait for Lucy’s next input, because in this con-figuration the next input (left, right or zoom in) will uniquely specify the target. If Lucy makes a mistake, her next input will letBIGnav dynamically update its knowledge of Lucy’s interest. With the more difficult task of navigating among 50 islands,BIGnav interprets each command, updates its knowl-edge and shows Lucy a view where her next command is most likely to maximize the reduction of uncertainty (or information gain) about the intended target. Figure 1(b) shows a case whereBIGnav guides Lucy to her target in 4 steps.
Detailed Description
We now describe in detail how BIGnav uses Bayesian Experi-mental Design and information gain to guide navigation. The three key random variables are:
● Θ represents any point of interest, i.e., possible intended target. For each target θ , and the probability that it is the actual intended target is P(Θ = θ ). These probabilities constitute the a priori knowledge that the system has about the user’s interest, and is updated as the user navigates. ● X represents any possible view provided by the system.
X = xis a particular view shown to the user. Note that the number of possible views is potentially very large.
● Y represents any particular command y issued by the user. The possible input commands are: move towards a direction, zoom in or click on the target when it is big enough to be clickable. Note that zooming out is not required in this framework: if the target is out of view, the user should indicate in which direction it is rather than zooming out. We now describe the three-stage navigation process.
(1) Interpreting user input: Given the view x shown to the user and the user’s intended target θ , P(Y = y∣Θ = θ , X = x) is the probability that the user provides an input command Y = y given θ and x. This probability distribution is the system’s in-terpretation of the user’s intention when giving this command. For instance, if island B is to the left of Lucy, what is the probability of Lucy giving the left command when knowing that island B is located to her left? P(go left | island B is the intended target, island B is located to the left of the current view) =1 if Lucy is completely confident about what she is doing. But maybe Lucy is not accurate all the time. Say she is only correct 95% of time, then we need to consider that she makes errors. For instance, P(go left | island B is the intended target, island B is located to the left of the current view) =0.95 and P(go right | island B is the intended target, island B is lo-cated to the left of the current view) =0.05. P(Y ∣Θ = θ , X = x) is a priori knowledge that must be given to the system. In the implementation section, we describe how we define it in 1D and 2D situations respectively.
(2) Updating system’s knowledge: Given the view x shown to the user and the user reaction y to that view, the system can update its estimate P(Θ∣X = x,Y = y) of the user’s interest with equation (1). If the system has no prior knowledge about the
Figure 1. (a) BIGnav: The system is a scientist experimenting on the user (Lucy). θ is the intended target in Lucy’s mind. X is the view provided by the system. Lucy provides an input Y given what she sees in the view (X ) and what she wants (θ ). (b) Lucy navigates to a particular island (T ) among 50 others with BIGnav. The color gradient shows the probability of each island being Lucy’s target. The redder, the higher the probability.
user’s intended target, e.g., at the beginning, each θ has the same probability of being the target and P(Θ) is uniform. As the user issues commands, the system gains knowledge about the likelihood that each point of interest be the target, reflected by the changes to the probability distribution. This is done, for each point of interest, by taking its previous probability, multi-plying by the above user input function P(Y = y∣Θ = θ , X = x), and normalizing it so that the sum of the new probabilities over all the points of interest equals one.
(3) Navigating to a new view: With the new probability dis-tribution after receiving user input, BIGnav then goes over each view x ∈ X , calculates its expected information gain with equation (4) and picks the view for which it is maximal. To maximize equation (4), BIGnav looks for a trade-off between two entropies. To maximize the first term, the view should be such that all user commands given that view are equally probable (for the system). To minimize the second term, the view should provide the user with meaningful information about the points of interest. Maximizing a difference does not necessarily mean to maximize the first term and minimize the second, so the maximum information gain is a trade-off between these two goals. For example, showing only ocean will increase the first term but will also increase the second term. After locating the view with maximal information gain, BIGnavnavigates there and waits for user’s next input.
IMPLEMENTATION
We now describe our implementation of BIGnav. We first go through the 1D case with the last example in scenario (Fig. 1b), then show the implementation of the 2D case.
BIGnav in 1D
The 50 islands are the points of interest, therefore Θ = {1, 2, . . . , 50}. The system does not have prior knowledge about Lucy’s intended target island, so the initial distribution is P(Θ1=i) =501.
The view presented to Lucy at each step is defined by X = {[a, b] ⊆ [1, 50]}. The maximum zoom factor is such that a view cannot be smaller than two blocks (b − a ≤ 2). Since it is a 1D map, Lucy can go to the left, go to the right, zoom in or select the target if the view is at the maximum scale. We note these commands Y = {←, →, + (zoom in), ● (click target i)}. We start by modeling Lucy’s behavior. We consider that Lucy makes some mistakes when panning and zooming, but will
not miss the target when it is shown in the view and clickable:
P(Y =→∣ Θ = θ , X = [a, b]) = ⎧ ⎪ ⎪ ⎪ ⎪ ⎨ ⎪ ⎪ ⎪ ⎪ ⎩ 0.9 b < θ 0.05 a < θ 0.05 a ≤ θ ≤ b and b − a > 2 0 a ≤ θ ≤ b and b − a ≤ 2 P(Y =←∣ Θ = θ , X = [a, b]) = ⎧ ⎪ ⎪ ⎪ ⎪ ⎨ ⎪ ⎪ ⎪ ⎪ ⎩ 0.05 b < θ 0.9 a < θ 0.05 a ≤ θ ≤ b and b − a > 2 0 a ≤ θ ≤ b and b − a ≤ 2 P(Y = + ∣ Θ = θ , X = [a, b]) = ⎧ ⎪ ⎪ ⎪ ⎪ ⎨ ⎪ ⎪ ⎪ ⎪ ⎩ 0.05 b < θ 0.05 a < θ 0.9 a ≤ θ ≤ b and b − a > 2 0 a ≤ θ ≤ b and b − a ≤ 2 P(Y = ● ∣ Θ = θ , X = [a, b]) = {10 a ≤ θ ≤ b and b − a ≤ 2otherwise. In Figure 1b, the islands are represented by square boxes and colored in shades of red indicating the degrees to which the system believes the island is the target, i.e., island i is darker than j if P(Θ = i) > P(Θ = j). Island 8 has a T indicating that it is the target. The blue rectangle is the view that the system shows to Lucy. After seeing the view, Lucy provides an input command y to the system.
We can now show BIGnav in action.
Step 1: Since the initial distribution is uniform, the system’s uncertainty about Lucy’s target is H1=H(Θ1) =log250 = 5.64 bits.
The system then goes over every image [a, b], finds that [18, 34] maximizes the expected information gain and dis-plays the corresponding initial view to Lucy. In this case the expected information gain from Lucy’s next action is IG(Θ1∣X = [18, 34],Y ) = 1.08 bits.
Lucy inputs ← after seeing [18, 34]. The system then updates its knowledge with equation (1) and ends up with a new distri-bution Θ2given by P(Θ2) =P(Θ1∣X = [18, 34],Y =←). Using Bayes’ theorem we have:
P(Θ2=i) = {0.05 i <18 0.002 i ≥18.
The updated uncertainty is H2=H(Θ2) =4.65 bits, resulting in an actual information gain H1−H2=0.99 bits, very close to the expected information gain of 1.08 bits.
Step 2: The system now searches for the best view using the new distribution P(Θ2), finds that it is [9, 10] with an
expected information gain of IG(Θ2∣X = [9, 10],Y ) = 1.24 bits and displays it to Lucy. She then inputs ← after seeing [9, 10]. The system then updates Θ2to Θ3as follows:
P(Θ3=i) = ⎧ ⎪ ⎪ ⎪ ⎪ ⎨ ⎪ ⎪ ⎪ ⎪ ⎩ 0.12 i <9 0 9 ≤ i ≤ 10 0.006 10 < i < 18 0.0003 i ≥18.
The entropy of Θ3 is H3=3.36 bits, so the actual informa-tion gain for this step is H2−H3=1.29 bits, higher than the expected information gain of 1.24 bits.
Step 3: With the same process, the best view is now [4, 5] with an expected information gain of IG(Θ3∣X = [4, 5],Y ) = 1.58 bits. Lucy inputs →, leading to the updated distribution
P(Θ4=i) = ⎧ ⎪ ⎪ ⎪ ⎪ ⎪ ⎪ ⎪ ⎪ ⎪ ⎨ ⎪ ⎪ ⎪ ⎪ ⎪ ⎪ ⎪ ⎪ ⎪ ⎩ 0.01 i <4 0 4 ≤ i ≤ 5 0.28 5 < i < 9 0 9 ≤ i ≤ 10 0.015 10 < i < 18 0.0007 i ≥18.
The entropy of Θ4 is H4=2.70 bits, so the actual informa-tion gain is H3−H4=0.66 bits, compared to the expected information gain of 1.58 bits.
Step 4: The best view is now [7, 8] with an expected informa-tion gain of IG(Θ4∣X = [7, 8],Y ) = 1.84 bits. Lucy sees that the target island is in the view and happily clicks on it. The updated distribution is updated to
P(Θ5=i) = {1 i =8 0 otherwise.
The entropy of Θ5is H5=0 bits since there is no more un-certainty about the target. The actual information gain is H4−H5=2.7 bits, while the expected gain was 1.84 bits. Lucy finds her target island in only 4 steps. At step 1, BIGnav divides the map in 3 so that the three commands (left, right and zoom in) have equal probability. It does not consider a click as the view is still far from being fully zoomed-in to select the target. At step 2, one would expect it to divide the left third of the map in 3 again so that the view would be about 5 boxes wide. However, since it is close to the maximum scale, and it knows that Lucy never misses her target when it is in the view and is clickable, showing a 2-box zoomed-in view will give BIGnavextra information: if this is the target, Lucy will click on it; if it is not and Lucy moves away, the probabilities of these two boxes become 0. Step 3 and step 4 work similarly. We ran 200 simulations with 50 islands and a uniform initial distribution and found that it required 3.3 steps on average.
BIGnav in 2D
We implemented BIGnav in a 2D application using Java 1.8 and the open source ZVTM toolkit [23]. As for the 1D case, we need to define Θ, X and Y :
Θ represents points of interest in the multiscale information spaces. Each point θiis defined by a triplet (xi, yi, pi)where
(xi, yi)is the coordinate of point i and piis the dynamic
prob-ability that point i is the user’s intended target.
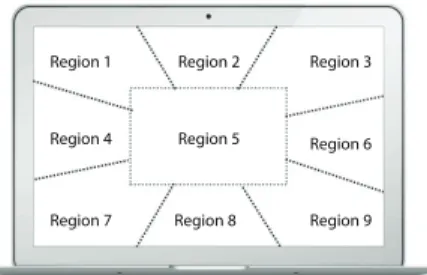
X represents views that the system can show to the user. A view is defined by a triplet (vx, vy, z) where (vx, vy) is the cen-ter of the view and the zoom level z decen-termines the view size. A view is fully zoomed in when z = 1. In traditional multiscale navigation, the system can pan and zoom continuously, lead-ing to a huge number of possible views. With BIGnav, we need to calculate the information gain corresponding to every single view X = x, which would incur an enormous computa-tional cost if views could be centered at any pixel and have any size. We therefore discretize the set of views by using tiles and discrete zoom factors. The tiles are 200 × 150 pixels each, and each tile can contain at most one point of interest. When z =1, the view is composed of 4 × 4 tiles. Each successive value of z increases the number of tiles (5 × 5, 6 × 6, etc.). Y represents input commands that the user can provide. In many pan-and-zoom applications, users can pan in any direc-tion by a range of distances, and zoom in and out by fixed amounts. As for the views, we reduce this set of commands to make computation tractable in our prototype. We slice the view into nine regions representing eight panning directions and a central zooming region (Fig. 2). The eight panning re-gions have a 45○angle, and the zooming region is half the size
of the view. A single movement of the mouse wheel move-ment triggers a zoom while a drag action triggers a pan. The angle between the mouse-down and mouse-up points of the drag determines the panning direction. The last input is a click on the target, available only when zoom level z = 1.
We now describe our implementation of the navigation steps. (1) Interpreting user input: To interpret user input, we need to define P(Y = y ∣ Θ = θ , X = x), i.e., the probability of each command given a target and a view, e.g., P(pan East | target (5, 7), view (4, 4, 2)). If the user were perfectly reliable, we could assign a probability of 1 to the correct command for each target θ and each view x, and 0 to the others. But we know that users make errors. To model the error rate, we collected data during a calibration session. The goal was to determine how confident participants were when issuing commands. The task was to indicate in which direction the target was in a set of views. A set of concentric circles, identical to those used in the experiment below, showed the direction of the target when it was not within the view (Fig. 3a).
We tested all ten input commands Y (8 pan operations, zoom in and click on the target) with 5 repetitions each, resulting in 50 trials per participant (N = 16). The results (Table 1) show that 90% of panning commands are correct and 4% are in one of the adjacent directions (Fig. 2). For zooming commands, 95% of the commands are correct while for clicking on the target, 100% of the commands are correct.
(2) Updating system’s knowledge: We use equation (1) to update the probabilities piof each point of interest being the
target given the current view x:
For all points of interest θi, the new p′i is the previous pi
multiplied by the user expected behavior P(Y = y ∣ Θ = θi, X =
Region 1 Region 2 Region 3
Region 4 Region 5 Region 6
Region 7 Region 8 Region 9
Figure 2. Nine regions representing user input, delimited by dotted lines. Panning regions also include the space outside the current view.
Command Main Region Adjacent Regions Other Regions
Pan 0.90 0.04 0.0033 Zoom 0.95 0.00625 0.00625
Click 1 0 0
Table 1. Calibration results used as prior knowledge about the user be-havior P(Y = y∣Θ = θ , X = x).
(3) Navigating to a new viewwith maximum expected informa-tion gain: For each view x and each user input y, the expected information gain is the difference between two uncertainties: Uncertainty before user input y =
minus the sum of pi×log2piover all points of interest
Uncertainty after user input y = minus the sum of p′
i×log2p′iover all points of interest
We then calculate the new view:
For all possible views x, calculate expected information gain with equation (4). Return the view (vxmax, vymax, zmax) with
maximum information gain and display it.
EXPERIMENT
Our goal is to study the performance of BIGnav in what Javed et al. call micro-level navigation, when the user has decided on a destination and needs to navigate to it [16]. This is different from searching [24] or wayfinding [5] tasks where the user does not know where the target is located.
We conducted a controlled experiment where participants have to navigate towards a known target. Based on the theoretic analysis, we formulate four hypotheses:
H1: BIGnav is faster than STDnav for distant targets; H2: BIGnav performs better in non-uniform information spaces, i.e., when the system has prior knowledge of users’ interest;
H3: BIGnav outperforms STDnav in terms of number of com-mands and rate of decreasing uncertainty;
H4: STDnav is preferred by users, more comfortable and intuitive.
Participants
Sixteen participants (3 female), age 24 to 30 (mean = 25.9, σ = 1.7), were recruited from our institution and received a handful of candies for their participation. All of them were right-handed, had normal or corrected-to-normal vision, and were familiar with WIMP interfaces. Participants were instructed
to navigate to the target as fast as they could but were not informed of the condition they used.
Apparatus
The experiment was conducted on a MacBook Air with a 1.4 GHz processor and 4 GB RAM. The software was imple-mented in Java with the ZVTM toolkit [23]. The window was 800×600 pixels, centered on a 13-inch screen set to 1440×900 resolution. A standard mouse was used with the same sensitiv-ity for all participants.
Procedure
We use a full-factorial within-participants design with a main factor: navigation technique (TECH); and two secondary fac-tors: distribution of targets (DISTR), index of difficulty (ID).
Navigation Technique (TECH)
We compare BIGnav with standard pan-and-zoom:
● BIGnav: our guided navigation technique. The ten user commands (eight pan, zoom in, select target) and error rates are as described in the previous section.
● STDnav: the standard pan and zoom technique, used as baseline. A left mouse drag pans the view in world space proportional to the number of pixels dragged in screen space, and the mouse wheel zooms around the center of the view. In order to compare information gains between the two condi-tions, we make the same computations as for BIGnav in the STDnavcondition, except for the display of the new view.
Distribution (DISTR)
In order to compare different types of information spaces, we compared six distributions of points of interest by combining three spatial distributions (Grid, Random and Cluster) with three probability distributions (Uniform, Random, Cluster) of the a priori likelihood of each target. Since not all combina-tions are meaningful, we selected six of them. The first three have a uniform probability distribution, i.e., all points of in-terest have equal probability of being the target, and different spatial distributions:
● Grid+Uniform: points of interest are arranged in a grid, providing a strong visual pattern.
● Random+Uniform: points of interest are placed randomly. ● Cluster+Uniform: points of interest are organized in
clus-ters, which is typical of geographical maps [4], where a central city is surrounded by smaller towns. We used 5 clusters of 10 targets.
The other three distributions use a non-uniform probability distribution of being the target:
● Grid+Random: points of interest are on a grid with random probabilities of being the target. These probabilities are bounded by Uniform and Cluster.
● Random+Random: points of interest are randomly dis-tributed and have random probabilities.
● Cluster+Cluster: points of interest are clustered and the probability of the center of each cluster is ten times higher than that of the surrounding points of interest.
Figure 3. (a) Calibration: participants were asked to give a direction that indicates where they think the target is located (here: north-west).
(b-c) Experimental condition with the target indicated in red. (d) Last step in the experimental condition: the target becomes green when it is clickable.
The first three configurations are meant to demonstrate that BIGnavworks well even without prior knowledge about poten-tial targets. The other three configurations are meant to assess the added advantage, if any, of using such prior knowledge. In particular, the last distribution is typical of, e.g., maps.
Index of Difficulty (ID)
The ID is related to the distance between the initial position of the view and the target to navigate to. Using Fitts’ definition of the ID [6], the distance D to travel is D = 2ID×W, where W is the (constant) target width. We adopted the same large IDs as in other multiscale navigation studies [1, 16]: 10, 15, 20, 25 and 30 bits.
We used a [2 × 6 × 5] within-subject design: we tested 2 TECH
for 6 DISTRand 5 ID conditions. Each condition was repli-cated 5 times, so that each participant performed 300 trials. We blocked the conditions by TECH. Half the participants started with STDnav and the other half with BIGnav. Within each block, we systematically varied the order of DISTRand ID combinations across participants using a Latin square so as to reduce the influence of learning effects. For each condition, the targets were drawn randomly according to the probability distribution of the DISTRcondition. All participants used the same target in the same DISTR×ID × Replication condition.
Task
The task is a multiscale pointing task: starting from a fully zoomed-out view, the participant must navigate towards the target until it is fully zoomed in and click on it. The target is surrounded by concentric circles so that it is always possible to tell in which direction and how far it is (Fig. 3).
The information space contains 50 points of interest: 49 are distractors and displayed in blue, one is the target and dis-played in red. The ID is used to compute the scale of the initial view so that it contains all the points of interest. The target becomes green and clickable only when the view is fully zoomed in.
Participants first receive general instructions about the session and performed several practice trials with each technique. Af-ter the session, they answer a questionnaire asking them for feedback and comments on the experiment and the techniques. A typical session lasts 60 minutes, including training.
Data Collection
For each trial, the program collects the task completion time (TCT), the commands that the participants issued, the
uncer-tainty and position of the view at each step and the information gain after each command. We collected 2 TECH ×6 DISTR× 5 ID × 5 Replications × 16 Participants = 4800 trials in total.
RESULTS
For our analyses, we first removed 23 missed trials (about 0.5%) and then 54 outliers (about 1.1%) in whichTCTwas 3 standard deviations larger than the mean. We verified that misses and outliers were randomly distributed across partici-pants, techniques and conditions.
Task Completion Time
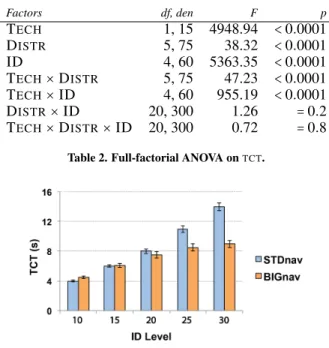
Table 2 shows the results of a repeated-measures full factorial ANOVA onTCT. All main effects are significant, as well as two interaction effects: TECH ×DISTRand TECH ×ID. Figure 4 shows the interaction effect between TECHand ID for task completion time (TCT). On average, BIGnav is 24.1% faster than STDnav across all ID. A post-hoc Tukey HSD test reveals a robust interaction effect: BIGnav is significantly faster than STDnav when ID > 15 (p < 0.0001), significantly slower when ID = 10 (p < 0.0001) and not significantly differ-ent for ID = 15 (p = 0.99). These results support H1: BIGnav is 22.3% faster than STDnav for ID = 25 and 35.8% faster for ID =30.
The ANOVA also reveals an interaction effect between TECH
and DISTR. A post-hoc Tukey analysis shows that for STDnav, DISTRdoes not affectTCT. BIGnav, however, shows a larger advantage in non-uniform information spaces (13.7% faster, p <0.01) than in uniform ones, with Cluster+Cluster being the fastest (Fig. 5), supporting H2. However, there is no sig-nificant difference within probability distribution conditions. For non-uniform distributions: Cluster+Cluster (6.51 ± 1.71s), Random+Random(6.74 ± 1.55s) and Grid+Random (6.62 ± 1.67s). For uniform distributions: Grid+Uniform (7.70 ± 1.60), Random+Uniform (7.83 ± 1.58s), and Cluster+Uniform (7.70 ± 1.62s).
We then further compare BIGnav and STDnav when ID > 15 in all DISTR conditions with a post-hoc Tukey HSD test. The results indicate that BIGnav is significantly faster than STDnavfor distant targets especially in non-uniform infor-mation spaces. Particularly, when ID = 25, BIGnav is 16.9% faster than STDnav in uniform distributions (p < 0.001) and is 27.6% faster in non-uniform (p < 0.0001). When ID = 30, BIGnavis 31.7% faster than STDnav in uniform distributions (p < 0.0001) and is 40.0% faster in non-uniform (p < 0.0001).
Factors df, den F p TECH 1, 15 4948.94 <0.0001 DISTR 5, 75 38.32 <0.0001 ID 4, 60 5363.35 <0.0001 TECH×DISTR 5, 75 47.23 <0.0001 TECH×ID 4, 60 955.19 <0.0001 DISTR×ID 20, 300 1.26 =0.2 TECH×DISTR×ID 20, 300 0.72 =0.8
Table 2. Full-factorial ANOVA onTCT.
Figure 4. Means and confidence intervals ofTCTby ID.
In summary, these results support hypotheses H1 and H2: BIGnav is faster than STDnav for distant targets and espe-cially in non-uniform information spaces. BIGnav is also not significantly different from STDnav for close targets (ID = 15).
Number of Commands
In order to get a sense of the differences in control strategies across conditions, we compare the number of user commands issued by the participants. Because of the continuous control in the STDnav conditions, we aggregate the mouse and wheel events as follows: we count one panning command per se-quence from a mouse down to a mouse up, and one zooming command per series of mouse wheel with less than 300ms between them.
We perform a TECH × DISTR× ID full-factorial ANOVA on the number of commands issued (Table 3) and find that while TECHand ID significantly affect the number of commands used, DISTRhas a non-significant effect. The ANOVA also in-dicates that the TECH ×ID interaction effect is significant. A post-hoc Tukey HSD confirms that while the number of com-mands progressively increases with ID in STDnav, it is barely
0 4 8 12 T C T (s ) STDnav BIGnav Grid Uniform Random Uniform Cluster Uniform Cluster Cluster Random Random Grid Random Uniform Non-uniform
Figure 5. Means and confidence intervals forTCTby DISTR.
Factors df, den F p TECH 1, 15 364818.2 <0.0001 DISTR 5, 75 0.99 =0.4 ID 4, 60 10636.43 <0.0001 TECH×DISTR 5, 75 0.23 =0.9 TECH×ID 4, 60 11783.96 <0.0001 DISTR×ID 20, 300 0.65 =0.9 TECH×DISTR×ID 20, 300 0.71 =0.8
Table 3. Full-factorial ANOVA on the number of commands.
Figure 6. Means and confidence intervals for # of commands by TECH.
affected by ID in BIGnav (Fig. 6). For instance, when ID = 25, STDnavrequires 28.1 commands on average whereas BIGnav requires 4.4 commands. When ID grows to 30, STDnav re-quires 34.5 commands on average whereas BIGnav rere-quires only 5.8 commands.
Interestingly, BIGnav results in more commands for ID = 10 than for larger distances. Although it still outperforms STDnav, it requires significantly more commands for ID = 10 than for the other ID except = 30. The reason may be that the target falls into the view very quickly but BIGnav tends to move it away to gain more information, because it does not know it is the target. Some participants got frustrated by this behavior and started to issue arbitrary commands.
Regarding the ratio between pan and zoom commands, we find that in STDnav, 79.33 ± 2.03% of the commands are zooming commands vs. 20.67 ± 2.51% for pans, but the proportions are reversed for BIGnav: 26.74 ± 4.46% for zooming vs. 73.26 ± 3.87% for panning. This is because with BIGnav, zooming is only needed when the target is within the view, and panning commands most often result in a new view with a different level of zoom.
Uncertainty and Information Gain
Since the essence of BIGnav is to maximize the expected information gain at each command, we compare the actual information gain between STDnav and BIGnav. In both cases, the uncertainty that the system has about the users’ intended target drops to zero gradually.
In STDnav, sometimes a command does not make a differ-ence in uncertainty, i.e., the information gain is null. This is typically the case when the system is certain of what users are going to do. For example, when completely zoomed out, users must zoom in. Similarly, if a view contains 99% of the probability distribution, users will almost certainly zoom in.
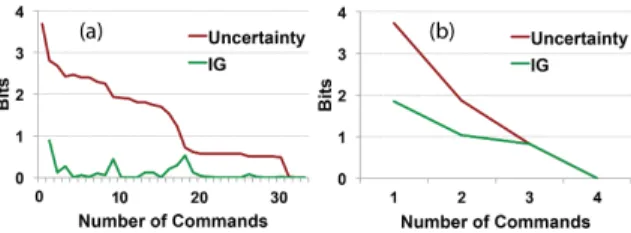
Figure 7. Uncertainty decrease and information gain for each successive command in (a) STDnav and (b) BIGnav.
By contrast, with BIGnav, the system gains information at each step, therefore uncertainty drops to zero much faster and with many fewer commands. In our data, 40.4% of the commands in STDnav do not reduce uncertainty. The rest of the commands reduce uncertainty by 0.26 bits on average. In BIGnav, all commands reduce uncertainty by 0.88 bits on average. Figure 7 shows typical plots of uncertainty reduc-tion for the two techniques and the same other condireduc-tions (Random+Uniform and ID = 30). These results support H3 that BIGnav outperforms STDnav with much lower command usage and much higher rate of decreasing uncertainty.
Trajectory in Multiscale Worlds
Another way to look at the navigation strategies is to plot the reduction in ID over time. As participants pan and zoom, they get closer (most of the time) to the target and therefore the ID progressively decreases from the initial level to 0. Figure 8 shows typical plots for two trials by the same participant in the same condition (Random+Uniform and ID = 30). With STDnav, the reduction of ID is globally steady while with BIGnav we see sudden drops and long plateaus as well as occasional increases of the ID.
ID increases may occur for example when the view is close to the target and there is a cluster of points of interest further away in that direction. To maximize the expected information gain, BIGnav may choose to move towards the cluster and end up further away from the target. Another cause for ID increase is when the user makes a mistake.
The long plateaus represent waiting time and confirm the qual-itative results reported below: that BIGnav incurs a higher cognitive load. This is probably due in part to our implemen-tation of BIGnav, which skips to the new view after each input command rather than transition to it with an animation. But it is also probably the case that the user has to interpret the new location to plan the next move, whereas with STDnav the user can anticipate the system response.
Figure 8. Time plot of the decrease in ID in the STDnav and BIGnav conditions, for two trials with the same other conditions.
Qualitative Results
The post-hoc questionnaire provides self-evaluation of perfor-mance and comfort level as well as subjective preference for the two techniques. Regarding performance and comfort level, assessed on a five-point Likert scale, we find no significant differences.
While we expected participants to dislike BIGnav because of its unusual and possibly counter-intuitive mode of operation despite its efficiency (H4), we were surprised that half the participants liked it better than STDnav: “with one direction, it combines zoom and pan, which was faster than doing it by hand”, “The way it navigates is quite interesting. For most of the cases, only 2,3 actions are needed to find the target”, and “I like the interaction part. Somebody is guessing what I’m doing”. The eight participants who preferred STDnav found it “more comfortable, doesn’t require that much attention”, “more intuitive as I can anticipate what I would see next”and “I’m already used to it”. These results indicate that BIGnav can
be a practical technique for efficient navigation.
APPLICATION:BIGmap
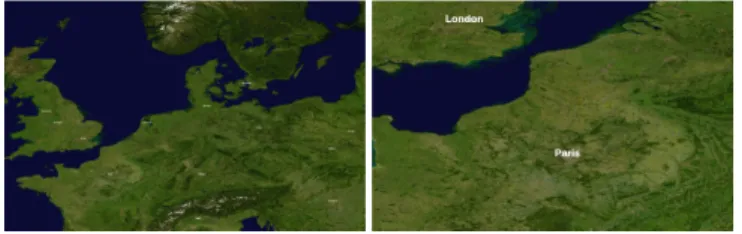
To demonstrate a realistic application of BIGnav, we im-plemented a map application with a 80000 × 60000 high-resolution map of Europe using the ZVTM toolkit [23] (Fig. 9). It features the top 50 largest urban areas5and uses their pop-ulation as probability distribution. This corresponds to the Random+Randomdistribution of the controlled experiment. We conducted several pilot studies where participants had to navigate to specific cities from a completely zoomed-out view down to the maximum scale, where the city labels are readable (ID = 25). Since this task relies on cognitive skills such as the participants’ geographical knowledge, we concentrated on observing users and collecting subjective evaluation feedback. Most participants could navigate to the target city very quickly, in a few steps, especially for cities with large population, hence higher probability, such as London and Paris. One of the participants referred to BIGnav as “3 steps to Paris”. For smaller cities such as Helsinki (rank 50), participants can still navigate efficiently. Most of them feel comfortable with BIGnavas they are familiar with the map of Europe and can reorient themselves rapidly. However, they get frustrated when the target is already in the view but BIGnav moves away from it in order to gain information. One participant mentioned that “it would be nice if we could change between pan and zoom and this one (BIGnav) freely so that it can help us get through all the zooming at the beginning, but once I see the target, maybe I’ll switch back to pan and zoom for the last few steps”. BIGmapillustrates how to derive a probability distribution from external data, here the population of the cities. More generally, the distribution should reflect the targets’ degree of interest, which is typically application-dependent. The distribution can also integrate usage data, such as most popular cities. Finally the results of a search can be turned into a distribution according to the ranking of the results, therefore integrating searching and navigation into a single paradigm. 5
Figure 9. (a) Part of the map of Europe used by BIGmap. (b) Navigating towards Paris from the previous view.
DISCUSSION
We have shown that BIGnav is an effective technique, espe-cially for distant targets and non-uniform information spaces. The most efficient distribution condition in the experiment was Cluster+Cluster, which corresponds to the small-world structures found in many datasets, showing that BIGnav is a promising approach for real-world applications. However, both the experiment and the BIGmap prototype exhibit some shortcomings, especially for small-ID tasks. We now discuss how to make BIGnav more comfortable to use, and then ad-dress the wider notion of human-computer partnership.
Comfort in Navigation
In standard pan-and-zoom interfaces, users can navigate the space in a continuous manner and constantly anticipate the system response. This gives them a sense of control and makes for a smooth user experience. By contrast, BIGnav uses discrete steps and the system’s response can be difficult to anticipate and even frustrating, in particular when getting close to the target. This results in long idle times between commands (Fig. 8) and a higher cognitive load as users reorient themselves and decide on their next move. In a sense, this proves the success of the technique, since it is designed to maximally challenge the user at each step.
Yet there must be a way to improve user experience and make navigation smoother. First, we could use animations to smooth transitions and help users stay oriented. Research has shown that one-second animations are sufficient and do not slow down expert users [2]. Second, we could combine BIGnav with standard pan-and-zoom according to user input: large panning and zooming movements would use BIGnav, smaller ones traditional pan and zoom. Finally we could reduce the size of the grid and increase the number of panning directions to provide finer control, however this requires heuristics or optimizations of the computational cost.
Navigation Partnership
BIGnavis a collaborative approach as system and user work together to achieve a common objective [27, 31]. Whereas current multiscale navigation systems have leveraged either information in the multiscale world [15, 16, 21] or the users’ intentions [14], BIGnav combines these two sources of infor-mation. Like mixed initiative systems [12], BIGnav optimizes decision under uncertainty. However, the use of Bayesian Experimental Design turns these systems on their head: rather than finding the action that best responds to the user, BIGnav challenges the user to give it useful information.
BIGnavalso relates to the notion of adaptation [20, 25]. In Information foraging[25], users adapt their strategy to gain valuable information from the system, whereas in BIGnav, the systems prompts users for valuable information.
Our approach leads to a reverse form of co-adaptation [20]: While co-adaptation is about users adapting to new technology and also adapting it to their own needs, BIGnav adapts to users through its prior knowledge, which could change over time, and adapts users to its needs by prompting them constantly for information. This creates a more balanced partnership than the random changes used by Williamson & Murray-Smith [34], which challenge the user but without the long-term reward of system adaptation to the user.
CONCLUSION AND FUTURE WORK
BIGnav is a new multiscale navigation technique based on Bayesian Experimental Design with the criterion of maximiz-ing the information-theoretic concept of mutual information. At each navigation step, BIGnav interprets user input, updates its estimate of the user’s intention, and navigates to a view that maximizes the expected information that will be gained from the user’s subsequent input.
We ran a controlled experiment comparing BIGnav with stan-dard pan and zoom for different levels of difficulty and differ-ent distributions of the information space. Our main result is that BIGnav is up to 40.0% faster than the baseline for distant targets and non-uniform information spaces.
To the best of our knowledge, BIGnav is the first attempt at introducing an information-theoretic and Bayesian approach to multiscale navigation. Our next goal is to reduce users’ cognitive load while still ensuring BIGnav’s efficiency. We also want to improve the computational cost of the technique in order to support more input commands and a finer grid. Beyond navigation, we are interested in applying this approach to other tasks, such as searching. Indeed, the model can be framed in terms of human-computer interaction as follows: ● Xcan be any system feedback, e.g., visual, auditory, haptic; ● Y can be any human input, e.g., touch input or gaze; ● P(Θ) can model many kinds of prior knowledge about
users’ goals, as well as reflect their interaction history. The paradigm shift from “responding to user input” to “run-ning experiments on the user” is a novel perspective on the notion of human-computer partnerships, and the Bayesian In-formation Gain model opens the door to a wide range of “BIG” applications.
ACKNOWLEDGMENTS
We thank the reviewers, our participants and our colleagues Yves Guiard and Wendy Mackay. This research was par-tially funded by Labex DigiCosme (ANR-11-LABEX-0045-DIGICOSME), operated by the French Agence Nationale de la Recherche (ANR) as part of the program “Investissement d’Avenir” Idex Paris-Saclay (ANR-11-IDEX-0003-02), by European Research Council (ERC) grant n° 695464 ONE: Unified Principles of Interaction, and by CNPq (Brazilian National Research Council) grant n° 201545/2015-2.
REFERENCES
1. Caroline Appert and Jean-Daniel Fekete. 2006. OrthoZoom Scroller: 1D Multi-scale Navigation. In Proceedings of the SIGCHI Conference on Human Factors in Computing Systems (CHI ’06). ACM, New York, NY, USA, 21–30. DOI:
http://dx.doi.org/10.1145/1124772.1124776
2. Benjamin B Bederson and Angela Boltman. 1999. Does animation help users build mental maps of spatial information?. In Information Visualization, 1999.(Info Vis’ 99) Proceedings. 1999 IEEE Symposium on. IEEE, 28–35.
3. Renaud Blanch, Yves Guiard, and Michel
Beaudouin-Lafon. 2004. Semantic Pointing: Improving Target Acquisition with Control-display Ratio Adaptation. In Proceedings of the SIGCHI Conference on Human Factors in Computing Systems (CHI ’04). ACM, New York, NY, USA, 519–526. DOI:
http://dx.doi.org/10.1145/985692.985758
4. Stephen J Carver. 1991. Integrating multi-criteria evaluation with geographical information systems. International Journal of Geographical Information System5, 3 (1991), 321–339.
5. Mark Evers, Mariët Theune, and Joyce Karreman. 2007. Which Way to Turn?: Guide Orientation in Virtual Way Finding. In Proceedings of the Workshop on Embodied Language Processing (EmbodiedNLP ’07). Association for Computational Linguistics, Stroudsburg, PA, USA, 25–32.
http://dl.acm.org/citation.cfm?id=1610065.1610069
6. Paul M Fitts. 1954. The information capacity of the human motor system in controlling the amplitude of movement. Journal of experimental psychology 47, 6 (1954), 381.
7. George W. Furnas. 1997. Effective View Navigation. In Proceedings of the ACM SIGCHI Conference on Human Factors in Computing Systems (CHI ’97). ACM, New York, NY, USA, 367–374. DOI:
http://dx.doi.org/10.1145/258549.258800
8. George W. Furnas and Benjamin B. Bederson. 1995. Space-scale Diagrams: Understanding Multiscale Interfaces. In Proceedings of the SIGCHI Conference on Human Factors in Computing Systems (CHI ’95). ACM Press/Addison-Wesley Publishing Co., New York, NY, USA, 234–241. DOI:
http://dx.doi.org/10.1145/223904.223934
9. Tinsley A. Galyean. 1995. Guided Navigation of Virtual Environments. In Proceedings of the 1995 Symposium on Interactive 3D Graphics (I3D ’95). ACM, New York, NY, USA, 103–ff. DOI:
http://dx.doi.org/10.1145/199404.199421
10. Yves Guiard and Michel Beaudouin-Lafon. 2004. Target Acquisition in Multiscale Electronic Worlds. Int. J.
Hum.-Comput. Stud.61, 6 (Dec. 2004), 875–905. DOI:
http://dx.doi.org/10.1016/j.ijhcs.2004.09.005
11. Yves Guiard, Renaud Blanch, and Michel
Beaudouin-Lafon. 2004. Object Pointing: A Complement to Bitmap Pointing in GUIs. In Proceedings of Graphics Interface 2004 (GI ’04). Canadian Human-Computer Communications Society, School of Computer Science, University of Waterloo, Waterloo, Ontario, Canada, 9–16.
http://dl.acm.org/citation.cfm?id=1006058.1006060
12. Eric Horvitz. 1999. Principles of Mixed-initiative User Interfaces. In Proceedings of the SIGCHI Conference on Human Factors in Computing Systems (CHI ’99). ACM, New York, NY, USA, 159–166. DOI:
http://dx.doi.org/10.1145/302979.303030
13. Eric Horvitz, Jack Breese, David Heckerman, David Hovel, and Koos Rommelse. 1998. The Lumiere project: Bayesian user modeling for inferring the goals and needs of software users. In Proceedings of the Fourteenth conference on Uncertainty in artificial intelligence. Morgan Kaufmann Publishers Inc., 256–265. 14. Takeo Igarashi and Ken Hinckley. 2000.
Speed-dependent Automatic Zooming for Browsing Large Documents. In Proceedings of the 13th Annual ACM Symposium on User Interface Software and Technology (UIST ’00). ACM, New York, NY, USA, 139–148. DOI:http://dx.doi.org/10.1145/354401.354435
15. Edward W. Ishak and Steven K. Feiner. 2006. Content-aware Scrolling. In Proceedings of the 19th Annual ACM Symposium on User Interface Software and Technology (UIST ’06). ACM, New York, NY, USA, 155–158. DOI:
http://dx.doi.org/10.1145/1166253.1166277
16. Waqas Javed, Sohaib Ghani, and Niklas Elmqvist. 2012. GravNav: Using a Gravity Model for Multi-scale Navigation. In Proceedings of the International Working Conference on Advanced Visual Interfaces (AVI ’12). ACM, New York, NY, USA, 217–224. DOI:
http://dx.doi.org/10.1145/2254556.2254597
17. Susanne Jul and George W. Furnas. 1998. Critical Zones in Desert Fog: Aids to Multiscale Navigation. In Proceedings of the 11th Annual ACM Symposium on User Interface Software and Technology (UIST ’98). ACM, New York, NY, USA, 97–106. DOI:
http://dx.doi.org/10.1145/288392.288578
18. J. C. R. Licklider. 1992. Man-Computer Symbiosis. IEEE Ann. Hist. Comput.14, 1 (Jan. 1992), 24–.
http://dl.acm.org/citation.cfm?id=612400.612433
19. Dennis V Lindley. 1956. On a measure of the information provided by an experiment. The Annals of Mathematical Statistics(1956), 986–1005.
20. Wendy E Mackay. 2000. Responding to cognitive overload: Co-adaptation between users and technology. Intellectica30, 1 (2000), 177–193.
21. Tomer Moscovich, Fanny Chevalier, Nathalie Henry, Emmanuel Pietriga, and Jean-Daniel Fekete. 2009. Topology-aware Navigation in Large Networks. In Proceedings of the SIGCHI Conference on Human Factors in Computing Systems (CHI ’09). ACM, New York, NY, USA, 2319–2328. DOI:
http://dx.doi.org/10.1145/1518701.1519056
22. Ken Perlin and David Fox. 1993. Pad: An Alternative Approach to the Computer Interface. In Proceedings of the 20th Annual Conference on Computer Graphics and Interactive Techniques (SIGGRAPH ’93). ACM, New York, NY, USA, 57–64. DOI:
http://dx.doi.org/10.1145/166117.166125
23. Emmanuel Pietriga. 2005. A toolkit for addressing hci issues in visual language environments. In 2005 IEEE Symposium on Visual Languages and Human-Centric Computing (VL/HCC’05). IEEE, 145–152.
24. Emmanuel Pietriga, Caroline Appert, and Michel Beaudouin-Lafon. 2007. Pointing and Beyond: An Operationalization and Preliminary Evaluation of Multi-scale Searching. In Proceedings of the SIGCHI Conference on Human Factors in Computing Systems (CHI ’07). ACM, New York, NY, USA, 1215–1224. DOI:
http://dx.doi.org/10.1145/1240624.1240808
25. Peter Pirolli and Stuart Card. 1995. Information Foraging in Information Access Environments. In Proceedings of the SIGCHI Conference on Human Factors in Computing Systems (CHI ’95). ACM Press/Addison-Wesley Publishing Co., New York, NY, USA, 51–58. DOI:
http://dx.doi.org/10.1145/223904.223911
26. Peter Pirolli and Stuart Card. 1999. Information foraging. Psychological review106, 4 (1999), 643.
27. Jens G Pohl. 1997. Human-Computer Partnership in Decision-Support Systems: Some Design Guidelines. Collaborative Agent Design (CAD) Research Center (1997), 36.
28. Claude E Shannon. 1948. A mathematical theory of communication. 27 (1948), 379–423, 623–656. 29. Claude E Shannon and Warren Weaver. 1949. The
mathematical theory of communication. (1949). 30. Ben Shneiderman. 1987. Designing the User Interface
Strategies for Effective Human-computer Interaction. SIGBIO Newsl.9, 1 (March 1987), 6–.
http://dl.acm.org/citation.cfm?id=25065.950626
31. Loren G Terveen. 1995. Overview of human-computer collaboration. Knowledge-Based Systems 8, 2 (1995), 67–81.
32. Colin Ware and Marlon Lewis. 1995. The DragMag Image Magnifier. In Conference Companion on Human Factors in Computing Systems (CHI ’95). ACM, New York, NY, USA, 407–408. DOI:
http://dx.doi.org/10.1145/223355.223749
33. John Williamson. 2006. Continuous uncertain interaction. Ph.D. Dissertation. University of Glasgow.
34. John Williamson and Roderick Murray-Smith. 2004. Pointing Without a Pointer. In CHI ’04 Extended Abstracts on Human Factors in Computing Systems (CHI EA ’04). ACM, New York, NY, USA, 1407–1410. DOI: