HAL Id: hal-01873610
https://hal.archives-ouvertes.fr/hal-01873610
Submitted on 17 Feb 2021HAL is a multi-disciplinary open access archive for the deposit and dissemination of sci-entific research documents, whether they are pub-lished or not. The documents may come from teaching and research institutions in France or abroad, or from public or private research centers.
L’archive ouverte pluridisciplinaire HAL, est destinée au dépôt et à la diffusion de documents scientifiques de niveau recherche, publiés ou non, émanant des établissements d’enseignement et de recherche français ou étrangers, des laboratoires publics ou privés.
Histone deacetylase 9 regulates breast cancer cell
proliferation and the response to histone deacetylase
inhibitors
Marion Lapierre, Aurélien Linares, Mathieu Dalvai, Céline Duraffourd,
Sandrine Bonnet, Abdelhay Boulahtouf, Carmen Rodriguez, Stéphan
Jalaguier, Said Assou, Béatrice Orsetti, et al.
To cite this version:
Marion Lapierre, Aurélien Linares, Mathieu Dalvai, Céline Duraffourd, Sandrine Bonnet, et al.. Hi-stone deacetylase 9 regulates breast cancer cell proliferation and the response to hiHi-stone deacetylase inhibitors. Oncotarget, Impact journals, 2016, 7 (15), pp.19693-708. �10.18632/oncotarget.7564�. �hal-01873610�
www.impactjournals.com/oncotarget/ Oncotarget, Vol. 7, No. 15
Histone deacetylase 9 regulates breast cancer cell proliferation
and the response to histone deacetylase inhibitors
Marion Lapierre1,2,3,4,#, Aurélien Linares1,2,3,4,#, Mathieu Dalvai5,6, Céline Duraffourd7,
Sandrine Bonnet1,2,3,4, Abdelhay Boulahtouf1,2,3,4, Carmen Rodriguez1,2,3,4, Stéphan
Jalaguier1,2,3,4, Said Assou3,8, Beatrice Orsetti1,2,3,4, Patrick Balaguer1,2,3,4, Thierry
Maudelonde7, Philippe Blache1,2,3,4, Kerstin Bystricky5,6, Nathalie Boulle1,2,3,4,7,‡,
Vincent Cavaillès1,2,3,4,‡
1 IRCM, Institut de Recherche en Cancérologie de Montpellier, Montpellier, France 2INSERM, U1194, Montpellier, France
3Université Montpellier, Montpellier, France
4Institut du Cancer de Montpellier, Montpellier, France
5 Université de Toulouse, UPS, Laboratoire de Biologie Moléculaire Eucaryote (LBME), Toulouse, France 6 CNRS, UMR5099, Toulouse, France
7 Laboratoire de Biologie Cellulaire, CHU Arnaud de Villeneuve, Montpellier, France
8 IRMB, Institute for Regenerative Medecine and Biotherapy, INSERM U1183, Montpellier, France #Should be considered as first coauthors
‡Should be considered as last coauthors
Correspondence to: Vincent Cavaillès, e-mail: vincent.cavailles@inserm.fr Keywords: breast cancer, histone deacetylase, HDAC9, HDAC inhibitors, SOX9
Received: July 27, 2015 Accepted: January 23, 2016 Published: February 22, 2016
ABSTRACT
Histone lysine acetylation is an epigenetic mark regulated by histone acetyltransferases and histone deacetylases (HDAC) which plays an important role in tumorigenesis. In this study, we observed a strong overexpression of class IIa HDAC9, at the mRNA and protein levels, in the most aggressive human breast cancer cell lines (i.e. in basal breast cancer cells vs luminal ones or in malignant vs begnin MCF10A breast epithelial cell lines). HDAC9 overexpression was associated with higher rates of gene transcription and increased epigenetic marks on the HDAC9 promoter. Ectopic expression of HDAC9 in MCF7 luminal breast cancer cells led to an increase in cell proliferation and to a decrease in apoptosis. These effects were associated with a deregulated expression of several genes controlled by HDAC inhibitors such as CDKN1A, BAX and TNFRSF10A. Inversely, knock-down of HDAC9 expression in MDA-MB436 basal breast cancer cells reduced cell proliferation. Moreover, high HDAC9 expression decreased the efficacy of HDAC inhibitors to reduce cell proliferation and to regulate CDKN1A gene expression. Interestingly, the gene encoding the transcription factor SOX9 was identified by a global transcriptomic approach as an HDAC9 target gene. In stably transfected MCF7 cells,
SOX9 silencing significantly decreased HDAC9 mitogenic activity. Finally, in a large panel
of breast cancer biopsies, HDAC9 expression was significantly increased in tumors of the basal subtype, correlated with SOX9 expression and associated with poor prognosis. Altogether, these results indicate that HDAC9 is a key factor involved in mammary carcinogenesis and in the response to HDAC inhibitors.
INTRODUCTION
Despite real improvement in patient treatment, breast cancer remains a significant global health issue
and a major cause of cancer death worldwide [1]. Breast cancer is a complex and heterogeneous disease and at least five distinct molecular subtypes differing in clinical outcomes and treatment responses have been identified
based on gene expression profiles [2]. Routinely, breast cancers are classified according to different parameters including stage, grade and expression of molecular targets such as estrogen, progesterone and human epidermal growth factor receptors. Adjuvant systemic treatments after surgery include chemotherapy, hormone therapy and HER2-targeted therapy [3].
A number of epigenetic aberrations have been characterized in breast cancer, including DNA methylation and various histone modifications, such as methylation, phosphorylation, ubiquitination, sumoylation and acetylation [4]. Acetylation is controlled by a balance in activity between histone acetyltransferase and histone deacetylase (HDAC). Human HDACs form a large family of 18 members classified in four groups (I to IV) based on sequence homologies [5, 6].
HDAC inhibitors (HDIs) have emerged as a promising new class of multifunctional anticancer agents [7]. These molecules can block multiple cancer related pathways and reverse epigenetic events implicated in cancer progression due in part, to their ability to enhance acetylation of a wide range of proteins, including transcription factors, molecular chaperones and structural components [8]. HDIs exert various effects in tumor cells which include cell cycle arrest, induction of apoptosis, inhibition of angiogenesis, activation or inactivation of tumor suppressor genes or oncogenes, and decreased invasion and metastases [9]. In preclinical studies, they showed synergy with radiation, chemotherapeutics or other agents such as proteasome inhibitors and have been tested in clinical trials, as single agents or in combination with other therapies [10]. Despite promising results, clinical trials with HDIs in solid tumors have not met the expected success and ongoing work aims at increasing HDI selectivity and deciphering the mechanisms underlying intrinsic resistance to these inhibitors [11]. In breast cancer, HDIs strongly modulate estrogen signaling and the response to hormone therapies [12].
In this study, we first demonstrate that class IIa HDAC9 expression is markedly increased at the transcriptional level in the most aggressive mammary tumor cell lines. Our data also indicate that deregulated expression of HDAC9 in breast cancer cells (ectopic expression in MCF7 cells and knock-down in MDA-MB436 cells) alters gene expression, cell proliferation and apoptosis. Most importantly, HDAC9 expression controls the sensitivity of breast cancer cells to HDAC inhibitors. Finally, we identified the SOX9 gene as a new HDAC9 target gene which explained, at least partly, the effect of HDAC9 on breast cancer cell proliferation. Altogether, this work evidences an important role of HDAC9 in breast cancer cells and in their response to HDAC inhibitors.
RESULTS
HDAC9 is overexpressed in the most aggressive breast tumor cell lines
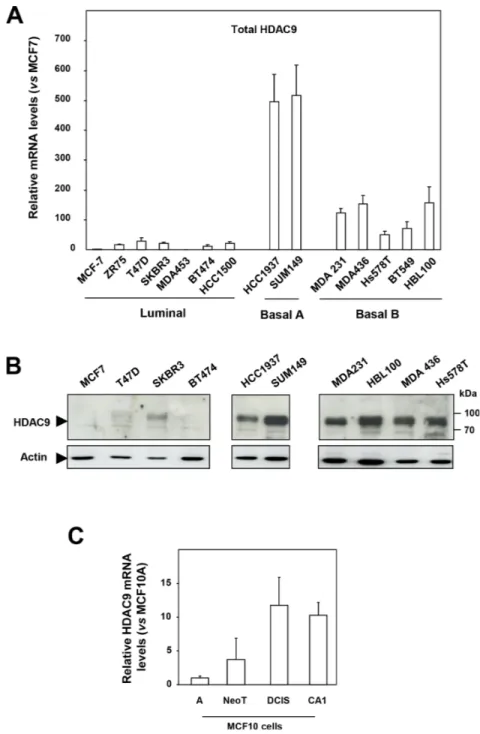
By comparing HDAC expression at the mRNA level in a panel of human breast tumor cell lines classified as luminal, basal A and basal B [13, 14], we found the level of HDAC9 expression to be strikingly increased in basal cells (mean ± SD = 223.7 ± 197) as compared to luminal cells (mean ± SD = 14.2 ± 10.7) (p = 0.0059) (Figure 1A). This deregulation between luminal and basal cells appeared specific since other HDACs did not display major differences in gene expression, except for HDAC4 and HDAC11, which, to a lesser extent, were respectively increased and decreased in basal cell lines (Supplementary Figure 1).
Various mRNA isoforms are encoded by the HDAC9 gene [15]. Comparison of mRNA levels for total HDAC9 with those of the longest HDAC9 isoforms (variants 1, 4 and 5) and the MITR isoform (for MEF2 Interacting Transcription Repressor also known as variant 3) lacking the catalytic deacetylase domain showed a similar pattern of distribution among luminal, basal A and basal B cells (Supplementary Figure 2).
HDAC9 expression was next analyzed at the protein level by western blotting using an anti-HDAC9 antibody recognizing all HDAC9 protein isoforms (Figure 1B and Supplementary Figure 3). Low or no HDAC9 signal was detected in the luminal breast cancer cells analyzed, whereas the anti-HDAC9 antibody detected high levels of a protein around 95 kDa in the basal cell lines tested (Figure 1B and Supplementary Figure 3B). Analysis of nuclear and cytoplasmic extracts from luminal MCF7 and basal HBL100 cells showed predominant nuclear localization of the HDAC9 protein in HBL100 cells (Supplementary Figure 3C). Similar results were found in additional luminal and basal cells tested including MDA-MB436, MDA-MB231 and MDA-MB453 cells (Supplementary Figure 3D). Immunofluorescence analysis confirmed very low levels of endogenous protein in MCF7 cells and high levels of endogenous HDAC9 protein in basal cells, with a predominant and diffuse distribution in the nuclei (Supplementary Figure 4A and 4B). Altogether, these data demonstrated that HDAC9 expression was significantly increased at the mRNA and protein levels in basal breast cancer cells, which exhibit the most aggressive phenotype.
These results were confirmed using the MCF10 cell model of breast cancer progression which comprises the well-differentiated cell line MCF10A unable to form lesions in nude mice, the premalignant transformed cell line called MCF10NeoT and the two malignant subclones MCF10DCIS and MCF10CA1, which produce either comedo-type tumors or highly invasive cancers after transplantation into nude mice [16]. As compared to
MCF10A cells, HDAC9 expression increased by 4 fold in MCF10NeoT cells and by 10 to 12-fold in MCF10DCIS and CA1 clones (Figure 1C) whereas the expression of the other HDACs was not significantly deregulated (Supplementary Figure 5). These data thus strengthen the conclusion that overexpression of the HDAC9 gene might be associated with breast cancer progression.
Mechanisms of HDAC9 overexpression in basal breast cancer cells
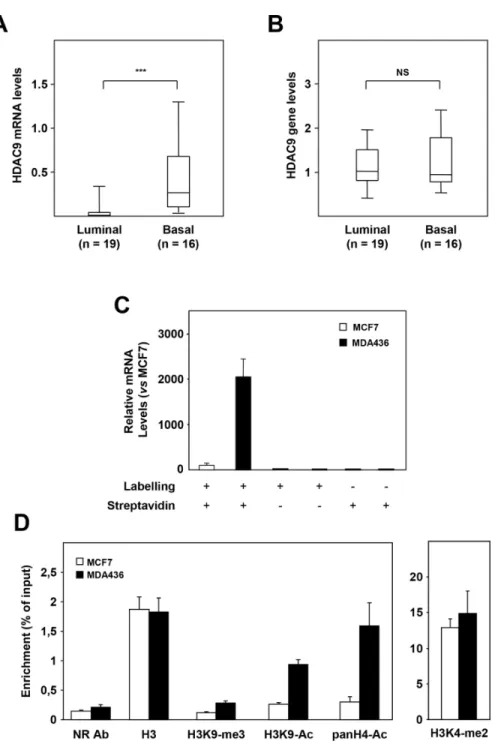
We investigated the mechanisms by which the HDAC9 gene is overexpressed in basal breast cancer cells. In a set of 35 breast tumor cell lines classified as luminal (n=19) or basal (n=16), RT-qPCR quantification confirmed higher
Figure 1: HDAC9 is overexpressed in the most aggressive breast cancer cells. A. Total HDAC9 mRNA levels were measured in fourteen breast tumor cell lines classified as luminal (n=7), basal A (n=2) and basal B (n=5). Results are expressed relative to the HDAC mRNA levels of the MCF7 cells and represent mean ± SD of 3 independent cell cultures. B. Proteins were extracted from luminal (n=4), basal A (n=2) and basal B (n=4) breast tumor cells and analyzed by western-blot using anti-HDAC9 antibody. Actin was used as a loading control. This western-blot is representative of two independent experiments. C. Total HDAC9 mRNA levels were measured in the MCF10 mammary cell lines. Results are expressed relative to the HDAC mRNA levels of the MCF10A cells and represent mean ± SD of 3 independent cell cultures.
levels of HDAC9 mRNA levels in basal cells as compared to luminal ones (Figure 2A, p<0.0001). In the same series of cells, HDAC9 gene amplification was analyzed by qPCR. No significant difference in HDAC9 gene levels was found between basal and luminal cell lines suggesting that gain in HDAC9 gene copy number is not involved in HDAC9
overexpression in basal breast cancer cells (Figure 2B). We next performed run-on experiments using luminal MCF7 and basal MDA-MB436 cell lines to compare HDAC9 gene transcription rate in both groups of mammary tumor cells (Figure 2C). HDAC9 transcription rate was found to be significantly enhanced in MDA-MB436 cells as compared to
Figure 2: Mechanisms of HDAC9 deregulation in basal breast tumor cells. A. HDAC9 mRNA levels were measured in luminal (n=19) and basal (n=16) breast tumor cell lines using RT-qPCR as described in Materials and Methods. B. Same as in panel A for HDAC9 gene levels measured by qPCR. C. HDAC9 transcription rates were measured in MCF7 and MDA-MB436 breast tumor cells in a run-on experiment. HDAC9 mRNA levels are expressed relative to the MCF7 cell line used as reference. The various experimental conditions used for both cell lines are indicated. D. ChIP experiments on the HDAC9 gene promoter after immunoprecipitation using antibodies against Histone H3 (H3), H3K9-me3, H3K9-Ac, panH4-Ac, H3K4-me2 or an irrelevant antibody (NR Ab).*** p < 0.001.
MCF7 cells (about 20-fold), suggesting that this mechanism is crucial for the differential expression of HDAC9 between the two cell lines. To emphasize this observation, we compared several epigenetic marks on the HDAC9 gene promoter in MCF7 and MDA-MB436 cells. As shown in Figure 2D, differences in epigenetic marks were found in the HDAC9 gene promoter between the two cell lines, with increased levels of both H3K9 and H4 acetylation and H3K9 methylation in MDA436 as compared to MCF7 cells.
HDAC9 increases breast cancer cell proliferation
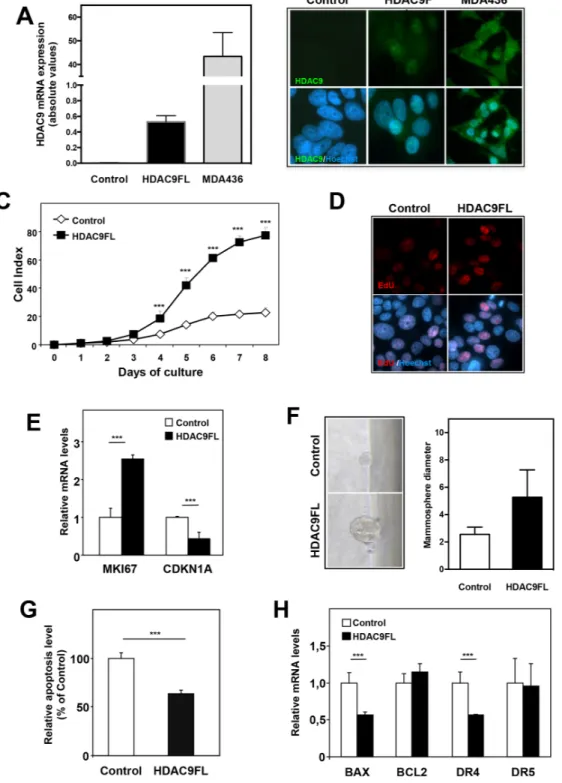
As HDAC9 was found to be overexpressed in the most aggressive breast tumor cells, we wondered what consequences HDAC9 overexpression could have on luminal cells behavior. We thus stably transfected luminal MCF7 cells using a full-length HDAC9 expression vector and generated MCF7-HDAC9FL cells together with control cells transfected with the corresponding empty expression vector (MCF7-Control). Expression of HDACs from classes I, IIa, IIb and IV was not significantly altered by HDAC9 overexpression in MCF7 cells (data not shown). As shown in Figure 3A and 3B, HDAC9 mRNA levels were strongly expressed in MCF7-HDAC9FL cells although the levels appeared still very low as compared to those found in MDA-436 basal human breast cancer cells.
The effect of HDAC9 expression on cell proliferation was analyzed using the xCELLigence technology which allows real-time monitoring of cell proliferation through measurement of impedance-based signals. We found that MCF7-HDAC9FL cells exhibited a higher proliferation rate than control cells (Figure 3C). This effect was also observed by quantifying the percentage of cells incorporating EdU (Figure 3D). Moreover, MCF7-HDAC9FL cells showed higher expression of the proliferation marker MKI67 together with decreased expression of the cell cycle inhibitor CDKN1A genes (Figure 3E). Interestingly, the effect on proliferation was also evidenced when cells were grown as mammospheres (Figure 3F). In an independent transfection experiment, we isolated stable MCF7 clones with two control clones (clones C3 and C4) and two HDAC9 overexpressing clones (clones 9.4 and 9.6) (Supplementary Figure 6A). The use of these stably transfected MCF7 clones further confirmed the growth advantage of HDAC9 overexpressing cells (Supplementary Figure 6B). To better characterize the effect of HDAC9, we monitored apoptosis in MCF7-HDAC9FL cells and observed that HDAC9 exerted an anti-apoptotic activity as shown by the quantification of cytoplasmic nucleosomes (Figure 3G). This apoptotic effect was in line with the significant decreased expression of two pro-apoptotic genes, BAX and DR4, in HDAC9 overexpressing cells as compared to control cells (Figure 3H).
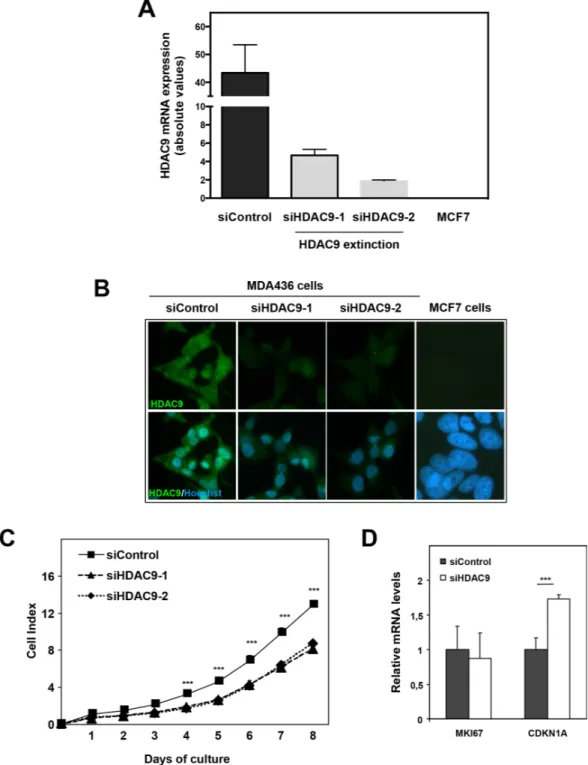
The impact of HDAC9 on cell proliferation was also assessed by knocking-down its expression in basal breast cancer cells using small interfering RNA. We used two different siRNAs that decreased HDAC9 expression by
more than 3-fold in MDA-MB436 basal cells as monitored at the mRNA and protein levels (Figure 4A and 4B). As shown in the Figure, the levels of HDAC9 expression after silencing in MDA-436 cells remained relatively high as compared to MCF7 cells. Moreover, HDAC9 depletion did not impact significantly the mRNA levels for the other classes of HDACs in MDA-MB436 (data not shown). In line with the data obtained in the model of HDAC9 overexpressing cells, we found that the depletion of HDAC9 expression led to a decrease in cell proliferation in MDA-MB436 cells (Figure 4C). Although, the level of MKI67 mRNA was not affected after HDAC9 silencing, we observed a significant increase in CDKN1A gene expression (Figure 4D).
Finally, we also investigated whether the catalytic domain of HDAC9 was required for the regulation of cell proliferation. The ectopic expression of the MITR isoform which lacks the catalytic deacetylase domain did not increase MCF7 cell proliferation nor KI67 expression (Supplementary Figure 7). Altogether, these data demonstrate that HDAC9 is a strong regulator of breast cancer cell proliferation and survival.
HDAC9 increases the resistance of breast cancer cells to HDIs
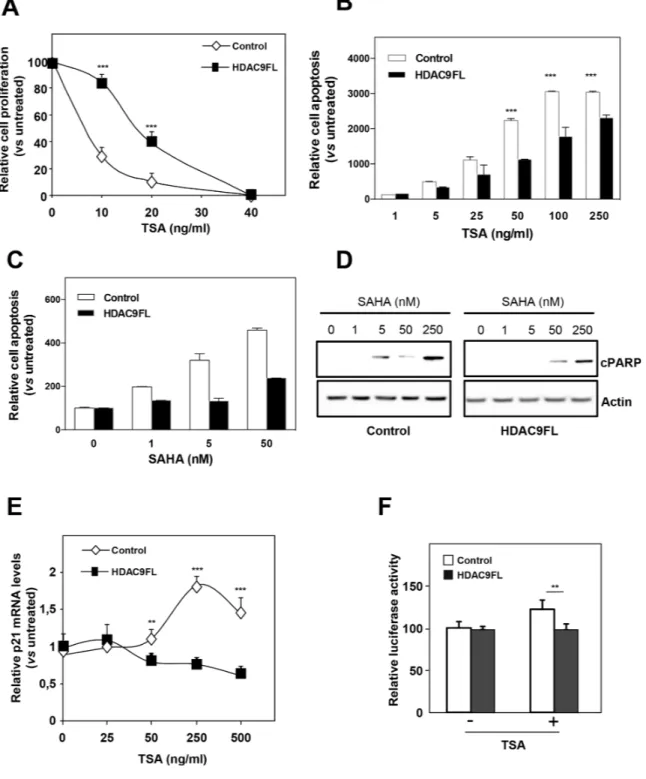
We previously reported that breast cancer cells of basal type were more resistant to the antiproliferative effects of HDIs than luminal cells ([17] and Supplementary Figure 8A for a comparison of MCF7 and MDA-MB436 cells). In order to precise the role of HDAC9 expression in the response to HDIs, we analyzed the effect of trichostatin A (TSA), a pan-HDAC inhibitor, on the proliferation of MCF7-Control and MCF7-HDAC9FL cells (Figure 5A). Very interestingly, we found that MCF7-HDAC9FL cells were more resistant to TSA than control MCF7 cells (IC50 of 22,8 and 4,9 ng/ml,
respectively). The same difference in apoptosis induction was observed in response to SAHA (Supplementary Figure 8B). The same difference in sensitivity was observed on the stably transfected MCF7 clone 9.6 in response to TSA or to the LBH589 compound, another pan-HDAC inhibitor (Supplementary Figure 8C and 8D).
Moreover, a different response to HDIs was also observed on cell apoptosis in response to TSA or SAHA as shown by quantification of the release of nucleosomes in the cytoplasm (Figure 5B and 5C). This was confirmed by measuring the expression of cleaved PARP in response to SAHA treatment (Figure 5D). The inverse results were obtained for the response to SAHA in MDA-MB436 cells after HDAC9 silencing (Supplementary Figure 9).
We also analyzed the response to HDIs at the level of gene expression regulation. In our previous work, we noticed that the regulation of CDKN1A expression was more sensitive to HDIs in luminal cells than in basal cells [17]. In line with this observation, we observed that TSA regulation of CDKN1A gene expression (endogenous mRNA levels or transiently transfected CDKN1A
Figure 3: HDAC9 regulates cell proliferation and apoptosis in breast cancer cells. A. HDAC9 mRNA levels were quantified using RT-qPCR in MCF7 cells stably transfected using either control plasmid (Control) or full length HDAC9 plasmid (HDAC9FL) and in MDA-MB436 cells. Results are expressed in arbitrary units (AU) as mean ± SD of 6 independent cell cultures. B. Control, MCF7-HDAC9FL and MDA-MB436 were analyzed by immunofluorescence using anti-HDAC9 antibody and Hoechst labeling. C. Cell index corresponding to the number of MCF7-Control and MCF7-HDAC9FL viable cells were monitored every 24 hours during 8 days using the xCELLigence system. Values are means ± SD, n=3 independent experiments. D. Proliferating cells in MCF7-Control and MCF7-HDAC9FL were analyzed by immunofluorescence using EdU and Hoechst labeling. E. Ki67 and p21 mRNA levels were quantified using RT-qPCR. Results represent fold change ± SD of 6 independent cell cultures vs levels in MCF7-Control cells after normalization to 28S mRNA. F. Mammosphere growth was analyzed in non-adherent conditions using MCF7-Control and MCF7-HDAC9FL cells. Values represent mammosphere diameter (mean ± SD of 34 values; n=3 independent experiments). G. Basal apoptosis was measured using the Cell Death Detection ELISA kit. Results are expressed relative to MCF7-Control cells (100%) and represent mean ± SD of 4 wells; n=3 independent experiments. F- BAX, BCl2, DR4 and DR5 mRNA levels were quantified using RT-qPCR. Results are expressed as in D. *** p< 0.001.
luciferase reporter vector) was diminished or abolished in MCF7-HDAC9FL cells (Figures 5E and 5F). These data thus suggest that HDAC9 expression is a key determinant of the response of breast cancer cells to HDI treatment.
SOX9 is a target gene of HDAC9
To identify HDAC9 target genes in breast cancer cells, we performed a global transcriptome analysis of MCF7-Control and MCF7-HDAC9FL cells. We identified
Figure 4: Effect of HDAC9 knock-down on breast cancer cell proliferation. A. HDAC9 expression was measured by RT-qPCR in MDA-MB436 cells after silencing (siHDAC9-1 and siHDAC9-2) or not (siControl) of the HDAC9 gene. Values represent fold changes ± SD corrected by the 28S mRNA and normalized to control cells. B. The same MDA-MB436 cells were analyzed by immunofluorescence using the anti-HDAC9 antibody. C. Cell index corresponding to the number of MDA436-siControl and MDA436-siHDAC9-1/-2 viable cells were monitored every 24 hours during 8 days using the xCELLigence system. Values are means ± SD, n=3 independent experiments. D. Ki67 and p21 mRNA levels were quantified using RT-QPCR. Results are expressed relative to the mRNA levels measured for the MDA436-siControl cells. *** p< 0.001.
Figure 5: HDAC9 increases the resistance of breast cancer cells to HDIs. A. MCF7-Control and MCF7-HDAC9FL were treated with increasing concentrations of TSA (up to 40 ng/ml) or with solvent alone (Control) and viable cells were monitored using the xCELLigence system during 72 hours. Values are means ± SD, n=3 independent experiments. B. MCF7-Control and MCF7-HDAC9FL were treated with increasing concentrations of TSA (up to 250 ng/ml) or with solvent alone (Control) and apoptosis was measured using the Cell Death Detection ELISA kit. Results are expressed as arbitrary units, normalized to Control and represent mean ± SD of 4 wells; n=3 independent experiments. C. Same as in panel B with SAHA treatment. D. Total proteins were extracted from MCF7-Control and MCF7-HDAC9FL cells treated with increasing concentrations of SAHA (up to 250nM) and analyzed by western-blot using anti-cleaved PARP antibody. Actin was used as a loading control. E. Total RNA was extracted from stably transfected MCF7 cells treated or not by TSA and p21 mRNA levels were quantified using RT-qPCR. Results represent mean and SD of 3 independent cell cultures and are expressed relative to the p21 mRNA levels of the not treated cells, used as reference. F. MCF7-Control and MCF7-HDAC9FL were transfected with the p21 promoter luciferase reporter plasmid and treated or not by TSA (ng/ml). Results represent the luciferase activity measured after normalization for renilla luciferase activity and relative to the values obtained in the untreated MCF7-Control. Data represent mean ± SD of triplicates and are representative of 2 independent experiments. ** p< 0.01; ***p< 0.001.
315 statistically significant differentially expressed genes with a fold change (FC) >2 and a False Discovery Rate (FDR) ≤0.05, with 195 genes up-regulated in MCF7-HDAC9FL and 120 genes down-regulated (see Supplementary Tables 1 and 2 for the list of up- and down-regulated genes). The molecular signatures of MCF7-Control and MCF7-HDAC9FL cells were visualized by hierarchical clustering on the 315 genes (Supplementary Figure 10). As showed in dendrogram, all the samples of the MCF7-HDAC9FL cells self-cluster into one branch and all samples of MCF7-Control samples self-cluster into another branch. Interestingly, the GO biological process enrichment analysis of these transcriptomic data using the Ingenuity software revealed that the most significantly deregulated processes were cell death and survival, cell movement and cell growth and proliferation (see the list of the corresponding genes in Supplementary Table 3), thus supporting our in vitro observations.
One of the most significantly upregulated gene was SOX9 [sex-determining region Y (SRY)-box 9 protein], a member of the SOX family of transcription factors which exhibits an high mobility group (HMG) box DNA-binding domain and plays key roles in cell fate specification, stem cell biology and related human diseases including cancer [18]. As expected from transcriptomic data, SOX9 expression was increased at the mRNA and protein levels by 2- to 3-fold in MCF7-HDAC9FL cells as compared to MCF7-Control cells (Figure 6A and 6B). The effect of HDAC9 on SOX9 gene expression was further confirmed by the decreased levels of SOX9 mRNA detected in HDAC9-depleted MDA-MB436 basal cells (Supplementary Figure 11A). Interestingly, similar to HDAC9, endogenous SOX9 mRNA and protein levels were significantly increased in MDA-MB436 cells as compared to MCF7-Control cells (Figure 6C and 6D). Moreover, SOX9 gene expression paralleled that of the HDAC9 gene in the MCF10 cells progression model except for MCF10CA1 cells in which overexpression of SOX9 was lower than in MCF10 DCIS (Supplementary Figure 11B).
A recent study reported that SOX9 plays a critical role in supporting mammary epithelial stem cells and enhances breast cancer cell proliferation and metastasis [19, 20]. In order to define whether SOX9 mediated the mitogenic effect of HDAC9 in breast cancer cells, we modulated SOX9 gene expression in MCF7 cells overexpressing or not HDAC9 (Figure 6E). As shown in Figure 6F, we found that HDAC9 no longer increased cell proliferation but rather decreased it when the expression of SOX9 gene was knocked-down. Altogether these results demonstrate that the SOX9 gene is an HDAC9 target gene, which controls its mitogenic effect in breast cancer cells.
HDAC9 expression in human breast cancer biopsies
To validate our in vitro data and to characterize HDAC9 expression in tumors from patients, we first
reanalyzed a cDNA array data set containing 184 breast cancers mRNA profiles (NKI dataset) [21]. This analysis confirmed the data obtained on cell lines with a significant differential expression of the HDAC9 gene (p<0.0002) when comparing tumors of luminal (141 patients) and basal (43 patients) phenotypes (Table 1A). To emphasize these results, we reanalyzed another public data set (GSE2250) which confirmed the increased expression of HDAC9 (p<0.0085) in tumors of the basal subtype (56±13 vs 67±14 arbitrary units) [22]. In the same datasets, the expression of the SOX9 gene was significantly increased in tumors of basal phenotype (p<0.00001 and p<0.001, respectively). As expected, and as shown in Table 1B, SOX9 expression was found to be significantly higher in tumors expressing high levels of HDAC9, both in the NKI cohort (p<0.009) and in the 189 samples of the GSE2990 dataset (p<0.0029) [23]. In the later cohort, Pearson’s analysis confirmed a strong correlation between HDAC9 and SOX9 expression in breast tumors (r=0.526, p<0.00001).
Finally, to determine whether HDAC9 expression was associated with patient survival, we used the Breast Cancer Gene-Expression Miner v3 statistical mining module [24]. As shown in Table 1C, the analysis of several datasets including GSE25055 [25], GSE26971 [26], GSE3143 [27], GSE33926 [28] and GSE22219 [29], indicated that high levels of HDAC9 mRNA were significantly associated with poor prognosis (p-value ranging from 0.0001 to 0.044 with hazard ratios ranging from 1.41 to 2.24). Altogether these data strengthened our in vitro results concerning the correlation between HDAC9 and SOX9, their higher expression in basal type breast cancers and the deleterious effect of HDAC9 overexpression on breast cancer cell proliferation.
DISCUSSION
Previous studies have underlined the potential role of HDACs in breast tumor progression [for a review, see [12]]. In the present study, we performed a careful analysis of HDAC expression in breast cancer cell lines. Our results demonstrate that class IIa HDAC9 may have a specific role in breast carcinoma as it is overexpressed in the most aggressive breast tumor cell lines and tumors, stimulates cell proliferation and increases resistance to HDAC inhibitors.
Since its cloning [30], HDAC9 has been implicated in various physiological processes, particularly through the analysis of HDAC9 knock-out mice [31, 32, 33, 34]. Fewer data have been published on HDAC9 in the context of cancer. HDAC9 has been shown for instance to bind and deacetylate TRIM29 and to decrease its cell proliferation-promoting activity [36]. To our knowledge, very few data on HDAC9 expression in breast tissues have been published to date, and the results presented herein evidence for the first time a strong deregulation of HDAC9 expression in breast cancer cells. We showed
that HDAC9 overexpression was associated to cells of the most aggressive basal subtypes as described by gene-expression models [13, 14]. According to these models,
the luminal signature includes many genes associated with the estrogen signaling pathway. By reanalyzing previous data from cDNA arrays, we observed a significant increase
Figure 6: SOX9 is a target gene of HDAC9 in breast cancer cells. A. SOX9 mRNA levels were quantified in MCF7-Control (Control) and MCF7-HDAC9FL (HDA9FL) cells using RT-qPCR. Results represent fold change ± SD of 6 independent cell cultures vs levels in MCF7-Control cells after normalization to 28S mRNA. B. Results were confirmed by immunofluorescence analysis using anti-SOX9 antibody. C and D. Same as in panel A and B, respectively in MCF7 and MDA-MB436 wild-type cells. E. anti-SOX9 mRNA levels was measured by RT-qPCR in MCF7-Control cells after silencing (siSOX9) or not (siControl) of the SOX9 gene. Results are expressed relative to the SOX9 mRNA levels of the MCF7-Control cells and represent mean ± SD of 3 independent cell cultures. F. MCF7-Control and MCF7-HDAC9FL viable cells, after silencing or not of the SOX9 gene, were monitoring using the XCELLigence system during 72 hours. Values are normalized to the MCF7-Control cells and are means ± SD, n=3 independent experiments.
in HDAC9 mRNA levels in basal like breast tumors as compared to luminal ones and in ERα negative tumors as compared to ERα expressing ones (Linares et al, in preparation), suggesting the biological relevance of the results obtained using breast cancer cell lines. The low expression of HDAC9 gene in breast luminal cells or tumors is in line with the recent observation that HDAC9 negatively regulates the expression of ERα in mouse cardiac tissue [37]. Interestingly, increased expression of HDAC9 was also observed in the MCF10 cell model of breast tumor progression.
HDAC9 overexpression was mainly explained by higher rates of HDAC9 gene transcription as shown by run on experiments. Accordingly, analysis of mRNA levels for the longer HDAC9 mRNA isoforms (variants 1, 4 and 5) and the deleted HDAC9ΔCD isoform (variant 3) showed similar profiles in various breast cancer cells, suggesting that the deregulation of HDAC9 expression mainly occurs at the transcriptional level. The molecular mechanisms leading to enhanced HDAC9 gene transcription in basal cells remain to be determined. Different epigenetic marks were detected between luminal MCF7 and basal MDA-MB436 cells on the HDAC9 gene promoter. Alternatively,
differences in transcription factors and/or cofactors may be involved in HDAC9 gene transcription between the two groups of breast tumor cells. Among them, the MEF2 family of transcription factors is a major candidate to study as the HDAC9 gene was shown to be a direct transcriptional target of MEF2 in vitro and in vivo [38].
Our data demonstrated that the overexpression of HDAC9 in the most aggressive breast cancer cells influences cell homeostasis with an increase in cell proliferation and a decrease in programmed cell death. This effect may be linked in part to the regulation of expression of key genes by HDAC9 such as the cell cycle inhibitor CDKN1A and the pro-apoptotic genes, BAX and DR4. Interestingly, our data indicated that the effect on cell proliferation was observed when cells were grown as mammospheres and further work will be necessary to define whether HDAC9 expression is deregulated in breast cancer stem cells [39]. Moreover, our preliminary experiments suggested that HDAC9 knock-down in MDA-436 cells reduced cell migration ability (data not shown) suggesting that HDAC9 might regulate the epithelial-mesenchymal transition. Interestingly, all these data are supported by our data from the global transcriptome
Table 1: Expression of HDAC9 and SOX9 in human breast cancer samples A
Dataset Subtype n HDAC9 SOX9
NKI [21] Luminal 141 p<0,0002 p<0,00001
Basal 43
GDS2250 [22] Non-basal 20 p<0,0085 p<0,001
Basal 18
B
Dataset HDAC9 groups n p value
NKI [21] Low 119 <0,009
High 119
GSE2990 [23] Low 94 <0,0029
High 95
C
Dataset Reference n No. of any
event p-value Hasard Ratio (HR) 95% confidence interval (CI)
GSE25055 Hatzis et al., 2011 309 65 0.0001 1.72 1.31 - 2.28 GSE26971 Filipits et al., 2011 258 58 0.0015 1.53 1.18 - 1.99 GSE3143 Bild et al., 2006 158 50 0.0176 1.41 1.06 - 1.87 GSE33926 Kuo et al., 2012 51 12 0.0329 2.24 1.07 - 4.68 GSE22219 Buffa et al., 2011 82 33 0.0447 1.78 1.01 - 3.14
analysis which revealed that proliferation and invasion are amongst the biological processes that are regulated by HDAC9 at the gene expression level.
The effect of HDAC9 on cell proliferation is coupled to a reduced sensitivity of breast cancer cells to the antiproliferative and apoptotic activity of HDIs, similar to that observed in cells of basal type as compared to luminal ones. Once again, this decreased sensitivity to HDIs was linked to a weaker transcriptional effect of these compounds on CDKN1A gene, suggesting that the CDKN1A gene may be a crucial target gene mediating HDAC9 effects. Based on our data, HDAC9 level may be considered as a predictive marker of the cellular response to HDAC inhibition. Other genes such as HR23B [40, 41] have been identified as biomarkers for tumor sensitivity to HDI-based therapy and the putative link of these genes with HDAC9 expression remains to be elucidated.
Finally, we identified SOX9 as an HDAC9 target gene in breast cancer cells which supports, at least partly, its mitogenic activity. Previous work has shown that SOX9, in cooperation with Slug, supports mammary epithelial stem cells and enhances breast cancer cell metastasis [19]. Recent studies showed that SOX9 was highly expressed in breast tumor cells and tissues of basal type [20] and that patients with higher SOX9 mRNA level had significantly shorter overall survival [42], thus supporting our data. The molecular pathways by which SOX9 mediates the mitogenic effects of HDAC9 in breast tumors are not known; it may involve the Wnt/β-catenin pathway as shown by Wang et al. [20]. In this latter study, Wnt was found to increase SOX9 gene expression. We show here that class IIa HDAC9 may be another regulator of SOX9 expression in breast tumor cells.
No link between SOX9 and HDACs has been clearly reported until now. To our knowledge, a single study described that HDIs regulates the translocation of SOX9 to the nucleus and increases SOX9 acetylation [43] suggesting that SOX9 activity is regulated both at the transcriptional and post-transcriptional levels, including via HDACs and HAT activity. It will be necessary to undertake further work in order to decipher the molecular mechanisms underlying the deregulated expression of the SOX9 gene in breast cancer.
In conclusion, our data show for the first time that class IIa HDAC9 could be involved at different levels in breast carcinogenesis. These data thus support previous results obtained in medulloblastoma showing that HDAC9 increased cell growth and viability and could be considered as an independent risk factor (high expression being significantly associated with poor overall survival) [35]. Obviously, other HDACs could be also highly relevant in breast cancer. For instance HDAC4 whose expression seems to be higher in basal breast cells (see Supplementary Figure 1) has also been shown to stimulate MCF7 breast cancer cell proliferation [44]. The prognostic significance of HDAC9 expression in breast tumors and its
relation to the resistance of the tumor to treatment will be important issues. This might help to better define the role of HDACs in breast tumorigenesis and to propose new therapies, including HDAC inhibitors, particularly in the context of hormonal resistance.
MATERIALS AND METHODS
Plasmids and reagentsFLAG-tagged full length HDAC9 (HDAC9FL) plasmid was a kind gift from Dr A. Zelent [15]. For stable transfections, pcDNA3.1-HDAC9-puromycin plasmid was obtained by subcloning HDAC9FL into the pcDNA3.1 vector (Invitrogen, Cergy Pontoise, France) conferring puromycin resistance. The PWWP reporter construct containing the promoter of the CDKN1A gene was previously described [17]. The pRL-CMV (Promega, Charbonnières, France) was used for normalization. Zeocin was purchased from InvivoGen (Toulouse, France). HDAC inhibitors TSA and LBH 589 were purchased from Sigma Aldrich and Alinda Chemicals Ltd respectively.
Cell lines and culture
The 14 breast cancer cell lines used in this study were obtained from the American Type Culture Collection (http://www.atcc.org/) except for the HCC1500 cell line, which was kindly provided by Dr E. Charafe-Jauffret (Marseille, France). Cells, classified as luminal (MCF7, ZR75, T47D, SKBR3, MDA-MB453, BT474, HCC1500), basal A (HCC1937, SUM149) and basal B (MDA-MB231, MDA-MB436, Hs578T, BT549, HBL100), were grown using the recommended culture conditions [13, 14]. The second set of 35 breast cancer cell lines used for HDAC9 gene quantification has been described previously [45]. The MCF7 and MDA-MB436 cells have been authenticated using the STR typing assay (Eurofins Genomics, Germany).
MCF7 human breast adenocarcinoma cells were stably transfected with the pcDNA3.1 and pcDNA3.1-HDAC9-puromycin plasmids respectively. Pools of puromycin resistant cells (respectively named MCF7-Control and MCF7-HDAC9FL) were selected and grown in DMEM/F12 medium supplemented with 10% FCS, 100U/ml penicillin, 100mg/ml streptomycin, 100mg/ ml sodium pyruvate and 0.5μg/ml puromycin. MCF7-Control and MCF7-HDAC9FL cells were also infected by lentivirus allowing overexpression of SOX9 or transiently transfected with small interfering RNA against SOX9 (Dharmacon). MDA-MB436 cells were transiently transfected with either mock siRNA (SiControl) or two sets of siRNA directed against HDAC9 gene (siHDA9-1 and siHDAC9-2) (Dharmacon). All transfections were carried out using Lipofectamine 2000 (Life Technologies) as recommended by the manufacturer.
An independent series of stable transfection was also set up using expression vectors bearing the resistance to zeomycin. The pcDNA3.1-HDAC9-zeomycin plasmid was obtained by subcloning HDAC9FL into the pcDNA3.1zeo vector (Life Technologies). In these experiments, independent clones (Clone 9.4 and 9.6) were isolated by selection through resistance to zeocin (0.5% in DMEM supplemented with 10% FCS).
For mammosphere formation, cells were plated at a density of 1 cell per well in 96-well tissue culture plates covered with poly-2-hydroxyethyl-methacrylate (Sigma) to prevent cell attachment. The medium was serum-free DMEM supplemented with 1% L-glutamine, 1% penicillin/streptomycin, 30% F12 (Sigma), 2% B27 (Invitrogen), 20 ng/ml EGF (Sigma) and 20 ng/ml bFGF (Invitrogen).
Breast tumor samples
The breast tumor data set (NKI set) used for HDAC9 and Sox9 mRNA analysis was obtained from a cDNA array study previously described [21]. We also reanalyzed two expression datasets (GDS2250 and GSE2990) obtained from Geoprofile. The Breast Cancer Gene-Expression Miner v3 statistical mining module (targeted prognostic analysis) [24] was used to determine the correlation with survival on five different cohorts (GSE25055, GSE26971, GSE3143, GSE33926 and GSE22219). The HDAC9 gene expression values were dichotomised according to gene median.
Luciferase reporter assays
MCF7-Control and MCF7-HDAC9FL cells were plated in 96-well plates (3.104 cells per well) 24h prior
to transfection with the CDKN1A gene promoter reporter vector using Jet-PEI (200 ng of total DNA) and treated with TSA during 24h. The pRLCMVBis plasmid (Ozyme) was used to normalize transfection efficiency. Firefly luciferase values were measured and normalized by the Renilla luciferase activity.
Cell proliferation measurement
Stably transfected MCF7 cells and MDA-MB436 cells were seeded at a density of 2500 cells/well into E-Plate 16 (ACEA Biosciences, Inc., San Diego, CA) containing 150μl per well of medium supplemented with 10% FCS. Dynamic monitoring of cell growth was determined every 24 hours up to 8 days using the impedance-based xCELLigence system (ACEA Biosciences). The cell index was derived from measured cell-electrode impedance that correlates with the number of viable cells.
Cell death analysis
Cells were plated in 6-well plates (50 000 cells/ well) and treated or not with TSA during 24h. Apoptosis
was quantified using the Cell Death Detection ELISA assay (Roche Molecular Biochemicals), according to the manufacturer’s conditions. Values from absorbance measurements at 405 nm were corrected using DNA quantification in separate wells treated in parallel.
Western-blot analysis
Whole-cell extracts, nuclear and cytoplasmic protein extracts were prepared using the NE-PER kit (Thermo Scientific) and western blotting were analyzed as previously described, using 30 μg protein for analysis [46] and a specific primary antibody against HDAC9 (abcam18970) or actin (Sigma). Signals were revealed using a horseradish peroxidase-conjugated secondary antibody (Jackson ImmunoResearch) and enhanced chemiluminescence (ECL-Plus; GE Healthcare) according to the manufacturer’s instructions.
Immunofluorescence analysis
Breast cancer cells were fixed in 4% formaldehyde, permeabilized with 1% Triton X-100 and incubated with 1% bovine serum albumin for 3h to reduce non-specific binding at room temperature. The cells were then incubated with antibodies specific for HDAC9 (Abcam ab18970) or SOX9 (Abcam ab3697). Detection was performed using an Alexa-conjugated secondary antibody (Life Technologies). After washing, sections were counterstained with Hoechst (Sigma Aldrich) and mounted for fluorescence microscopy. Negative controls using rabbit or mouse IgGs were performed and no staining was observed in these conditions.
Real-time quantitative PCR
Total RNA was extracted from cells using High Pure RNA Isolation kit (Roche Applied Science) according to the manufacturer’s instructions. Total RNA (1μg) was subjected to reverse-transcription using Superscript II reverse transcriptase (Invitrogen). RT-qPCR were performed with the LightCycler® 480 SYBR Green I
Master (Roche Applied Science) Melting curves of the PCR products were analyzed using the LightCycler®
software to exclude amplification of unspecific products. Results were normalized to 28S and TBP housekeeping gene transcripts. The primers for HDAC1 to HDAC11, p21, BAX, BCL2, DR4, DR5 and TBP genes have been described elsewhere [46]. Other primers used in this study are depicted in Supplementary Table 4.
ChIP analysis
For ChIP analysis, MCF7 and MDA-MB436 cells (70% confluent) were cross-linked with 3,7% formaldehyde during 10 min at 37°C. The Champion ChIP One-Day Kit (Qiagen) was then used according to the manufacturer’s recommendations. Immunoprecipitations
were performed using rabbit polyclonal antibodies against acylated-H3 (06-599, Upstate), or an irrelevant IgG antibody as a control. Quantitative PCR was then performed using a LightCycler® 480 SYBR Green I
Master (Roche Applied Science) with 2μl of material per point. Primers within the HDAC9 promoter are given in Supplementary Table 4. The input DNA fraction corresponded to 5% of the amount of immunoprecipitated chromatin.
Nuclear run-on assay
Nuclear run-on assays were performed using 6.107
MCF7 or MDA-MB436 cells and biotin-streptavidin labeling as previously described [47]. RNA was purified using Trizol reagent (Invitrogen). Reverse transcription and qPCR reactions were carried out as already described.
Global gene expression analysis
Global transcriptome analysis of MCF7-Control and MCF7-HDAC9FL cells was performed using human oligonucleotide HG-U219 microarrays (Affymetrix GeneAtlas) processed in the Microarray Core Facility of the Institute for Regenerative Medecine and Biotherapy (IRMB), CHRU-INSERM-UM Montpellier (http://www .chu-montpellier.fr/fr/irmb/). After image processing with the Affymetrix GeneChip command consol, the CEL files were analyzed using the Affymetrix Expression Console™ Software v1.3.1 and normalized with the RMA algorithm. Gene annotation was performed using NetAffx (http://www.affymetrix.com; October 2014). The Significant Analysis of Microarrays (SAM) software with the Wilcoxon test and sample label permutation (300) was used to identify differentially expressed genes between the MCF7-Control and MCF7-HDAC9FL samples. We identified 315 statistically significant differentially expressed genes with a fold change (FC) >2 and a False Discovery Rate (FDR) ≤0.05, with 195 genes up-regulated in MCF7-HDAC9FL and 120 genes down-regulated. Hierarchical clustering analyses based on the expression levels of the differentially expressed genes were performed by using the CLUSTER and TREEVIEW software packages [48]. The gene ontology (GO) biological process enrichment analyses of the differentially expressed genes were generated by Ingenuity Pathway Analysis (IPA) software. The 315 genes were imported into IPA database and were categorized on the basis of their biological process and molecular functions by using the software (www.ingenuity.com).
Statistical analysis
Results are expressed as mean ± standard deviations (SD). Statistical analysis was performed using Student’s t test or Mann-Whitney U test for comparison of two groups. A probability level of 0.05 was chosen for
statistical significance. Statistical analysis was performed using GraphPad Prism 5 version 5.01 (GraphPad Software, San Diego, CA, USA). The Mann-Whitney test (StatEL software) was used for statistical analysis of the GEO profile datasets. For the Breast Cancer Gene-Expression Miner analysis [24], p-values were determined using the Cox regression model.
ACKNOWLEDGMENTS
We thank Dr Caroline Desmetz for technical help, Dr Anne-Claire Lavigne for access to raw data of GEO profiles. We are also grateful to Dr Véronique Pantesco from the Microarray Core Facility of the Institute of Research of Biotherapy. This work was supported by the INCa (2011-054), the ‘’Institut National de la Santé et de la Recherche Médicale’’, the University of Montpellier, the ‘’Ligue Nationale contre le Cancer’’, the ‘’Association pour la Recherche sur le Cancer’’.
CONFLICTS OF INTEREST
The authors declare no conflicts of interest.
GRANT SUPPORT
This work was supported by the INCa (2011-054), the ‘’Institut National de la Santé et de la Recherche Médicale’’, the University of Montpellier, the ‘’Ligue Nationale contre le Cancer’’, the ‘’Association pour la Recherche sur le Cancer’’.
REFERENCES
1. Jemal A, Bray F, Center MM, Ferlay J, Ward E, Forman D. Global cancer statistics. CA Cancer J Clin. 2011;61:69–90. 2. Prat A, Ellis MJ, Perou CM. Practical implications of gene-expression-based assays for breast oncologists. Nat Rev Clin Oncol. 2012;9:48–57.
3. Beaumont T, Leadbeater M. Treatment and care of patients with metastatic breast cancer. Nurs Stand R Coll Nurs G B 1987. 2011;25:49–56.
4. Jovanovic J, Rønneberg JA, Tost J, Kristensen V. The epi-genetics of breast cancer. Mol Oncol. 2010;4:242–54. 5. Haberland M, Montgomery RL, Olson EN. The many
roles of histone deacetylases in development and physiol-ogy: implications for disease and therapy. Nat Rev Genet. 2009;10:32–42.
6. Gao L, Cueto MA, Asselbergs F, Atadja P. Cloning and functional characterization of HDAC11, a novel member of the human histone deacetylase family. J Biol Chem. 2002;277:25748–55.
7. Drummond DC, Noble CO, Kirpotin DB, Guo Z, Scott GK, Benz CC. Clinical development of histone deacetylase
inhibitors as anticancer agents. Annu Rev Pharmacol Toxicol. 2005;45:495–528.
8. Choudhary C, Kumar C, Gnad F, Nielsen ML, Rehman M, Walther TC, Olsen JV, Mann M. Lysine acetylation targets protein complexes and co-regulates major cellular func-tions. Science. 2009;325:834–40.
9. Xu WS, Parmigiani RB, Marks PA. Histone deacetylase inhibitors: molecular mechanisms of action. Oncogene. 2007;26:5541–52.
10. Slingerland M, Guchelaar H-J, Gelderblom H. Histone deacetylase inhibitors: an overview of the clinical studies in solid tumors. Anticancer Drugs. 2014;25:140–9. 11. Lee J-H, Choy ML, Marks PA. Mechanisms of
resis-tance to histone deacetylase inhibitors. Adv Cancer Res. 2012;116:39–86.
12. Linares A, Dalenc F, Balaguer P, Boulle N, Cavailles V. Manipulating protein acetylation in breast cancer: a prom-ising approach in combination with hormonal therapies? J Biomed Biotechnol. 2011;2011:856985.
13. Charafe-Jauffret E, Ginestier C, Monville F, Finetti P, Adélaïde J, Cervera N, Fekairi S, Xerri L, Jacquemier J, Birnbaum D, Bertucci F. Gene expression profiling of breast cell lines identifies potential new basal markers. Oncogene. 2006;25:2273–84.
14. Neve RM, Chin K, Fridlyand J, Yeh J, Baehner FL, Fevr T, Clark L, Bayani N, Coppe J-P, Tong F, Speed T, Spellman PT, DeVries S, et al. A collection of breast cancer cell lines for the study of functionally distinct cancer subtypes. Cancer Cell. 2006;10:515–27.
15. Petrie K, Guidez F, Howell L, Healy L, Waxman S, Greaves M, Zelent A. The histone deacetylase 9 gene encodes mul-tiple protein isoforms. JBiolChem. 2003;278:16059–72. 16. Miller FR, Soule HD, Tait L, Pauley RJ, Wolman SR,
Dawson PJ, Heppner GH. Xenograft model of progres-sive human proliferative breast disease. J Natl Cancer Inst. 1993;85:1725–32.
17. Margueron R, Licznar A, Lazennec G, Vignon F, Cavailles V. Oestrogen receptor alpha increases p21(WAF1/CIP1) gene expression and the antiproliferative activity of his-tone deacetylase inhibitors in human breast cancer cells. JEndocrinol. 2003;179:41–53.
18. Jo A, Denduluri S, Zhang B, Wang Z, Yin L, Yan Z, Kang R, Shi LL, Mok J, Lee MJ, Haydon RC. The versatile func-tions of Sox9 in development, stem cells, and human dis-eases. Genes Dis. 2014;1:149–61.
19. Guo W, Keckesova Z, Donaher JL, Shibue T, Tischler V, Reinhardt F, Itzkovitz S, Noske A, Zürrer-Härdi U, Bell G, Tam WL, Mani SA, van Oudenaarden A, Weinberg RA. Slug and Sox9 cooperatively determine the mammary stem cell state. Cell. 2012;148:1015–28.
20. Wang H, He L, Ma F, Regan MM, Balk SP, Richardson AL, Yuan X. SOX9 regulates low density lipoprotein recep-tor-related protein 6 (LRP6) and T-cell factor 4 (TCF4)
expression and Wnt/β-catenin activation in breast cancer. J Biol Chem. 2013;288:6478–87.
21. Fan C, Oh DS, Wessels L, Weigelt B, Nuyten DSA, Nobel AB, van’t Veer LJ, Perou CM. Concordance among gene-expression-based predictors for breast cancer. N Engl J Med. 2006;355:560–9.
22. Richardson AL, Wang ZC, De Nicolo A, Lu X, Brown M, Miron A, Liao X, Iglehart JD, Livingston DM, Ganesan S. X chromosomal abnormalities in basal-like human breast cancer. Cancer Cell. 2006;9:121–32.
23. Sotiriou C, Wirapati P, Loi S, Harris A, Fox S, Smeds J, Nordgren H, Farmer P, Praz V, Haibe-Kains B, Desmedt C, Larsimont D, Cardoso F, Peterse H, Nuyten D, Buyse M, Van de Vijver MJ, Bergh J, Piccart M, Delorenzi M. Gene expression profiling in breast cancer: understanding the molecular basis of histologic grade to improve progno-sis. J Natl Cancer Inst. 2006;98:262–72.
24. Jézéquel P, Frénel J-S, Campion L, Guérin-Charbonnel C, Gouraud W, Ricolleau G, Campone M. bc-GenExMiner 3.0: new mining module computes breast cancer gene expression correlation analyses. Database J Biol Databases Curation. 2013;2013:bas060.
25. Hatzis C, Pusztai L, Valero V, Booser DJ, Esserman L, Lluch A, Vidaurre T, Holmes F, Souchon E, Wang H, Martin M, Cotrina J, Gomez H, et al. A genomic predic-tor of response and survival following taxane-anthracy-cline chemotherapy for invasive breast cancer. JAMA. 2011;305:1873–81.
26. Filipits M, Rudas M, Jakesz R, Dubsky P, Fitzal F, Singer CF, Dietze O, Greil R, Jelen A, Sevelda P, Freibauer C, Müller V, Jänicke F, et al. A new molecular predictor of distant recurrence in ER-positive, HER2-negative breast cancer adds independent information to conventional clini-cal risk factors. Clin Cancer Res. 2011;17:6012–20. 27. Bild AH, Yao G, Chang JT, Wang Q, Potti A, Chasse
D, Joshi M-B, Harpole D, Lancaster JM, Berchuck A, Olson JA, Marks JR, Dressman HK, West M, Nevins JR. Oncogenic pathway signatures in human cancers as a guide to targeted therapies. Nature. 2006;439:353–7.
28. Kuo W-H, Chang Y-Y, Lai L-C, Tsai M-H, Hsiao CK, Chang K-J, Chuang EY. Molecular characteristics and metastasis predictor genes of triple-negative breast cancer: a clinical study of triple-negative breast carcinomas. PloS One. 2012;7:e45831.
29. Buffa FM, Camps C, Winchester L, Snell CE, Gee HE, Sheldon H, Taylor M, Harris AL, Ragoussis J. microRNA-associated progression pathways and potential therapeu-tic targets identified by integrated mRNA and microRNA expression profiling in breast cancer. Cancer Res. 2011;71:5635–45.
30. Zhou X, Marks PA, Rifkind RA, Richon VM. Cloning and characterization of a histone deacetylase, HDAC9. ProcNatlAcadSciUSA. 2001;98:10572–7.
31. Zhang CL, McKinsey TA, Olson EN. The transcriptional corepressor MITR is a signal-responsive inhibitor of myo-genesis. Proc Natl Acad Sci U S A. 2001;98:7354–9. 32. Zhang CL, McKinsey TA, Chang S, Antos CL, Hill JA,
Olson EN. Class II histone deacetylases act as signal-responsive repressors of cardiac hypertrophy. Cell. 2002;110:479–88.
33. de Zoeten EF, Wang L, Sai H, Dillmann WH, Hancock WW. Inhibition of HDAC9 increases T regulatory cell function and prevents colitis in mice. Gastroenterology. 2010;138:583–94.
34. Méjat A, Ramond F, Bassel-Duby R, Khochbin S, Olson EN, Schaeffer L. Histone deacetylase 9 couples neuronal activity to muscle chromatin acetylation and gene expres-sion. Nat Neurosci. 2005;8:313–21.
35. Milde T, Oehme I, Korshunov A, Kopp-Schneider A, Remke M, Northcott P, Deubzer HE, Lodrini M, Taylor MD, von Deimling A, Pfister S, Witt O. HDAC5 and HDAC9 in medulloblastoma: novel markers for risk strati-fication and role in tumor cell growth. Clin Cancer Res. 2010;16:3240–52.
36. Yuan Z, Peng L, Radhakrishnan R, Seto E. Histone deacet-ylase 9 (HDAC9) regulates the functions of the ATDC (TRIM29) protein. J Biol Chem. 2010;285:39329–38. 37. van Rooij E, Fielitz J, Sutherland LB, Thijssen VL, Crijns
HJ, Dimaio MJ, Shelton J, De Windt LJ, Hill JA, Olson EN. Myocyte enhancer factor 2 and class II histone deacetylases control a gender-specific pathway of cardioprotection medi-ated by the estrogen receptor. Circ Res. 2010;106:155–65. 38. Haberland M, Arnold MA, McAnally J, Phan D, Kim
Y, Olson EN. Regulation of HDAC9 gene expression by MEF2 establishes a negative-feedback loop in the transcrip-tional circuitry of muscle differentiation. Mol Cell Biol. 2007;27:518–25.
39. Carrasco E, Alvarez PJ, Prados J, Melguizo C, Rama AR, Aránega A, Rodríguez-Serrano F. Cancer stem cells and their implication in breast cancer. Eur J Clin Invest. 2014;44:678–87.
40. Khan O, Fotheringham S, Wood V, Stimson L, Zhang C, Pezzella F, Duvic M, Kerr DJ, La Thangue NB. HR23B is
a biomarker for tumor sensitivity to HDAC inhibitor-based therapy. Proc Natl Acad Sci U S A. 2010;107:6532–7. 41. New M, Olzscha H, Liu G, Khan O, Stimson L, McGouran
J, Kerr D, Coutts A, Kessler B, Middleton M, La Thangue NB. A regulatory circuit that involves HR23B and HDAC6 governs the biological response to HDAC inhibitors. Cell Death Differ. 2013;20:1306–16.
42. Chakravarty G, Moroz K, Makridakis NM, Lloyd SA, Galvez SE, Canavello PR, Lacey MR, Agrawal K, Mondal D. Prognostic significance of cytoplasmic SOX9 in invasive ductal carcinoma and metastatic breast cancer. Exp Biol Med (Maywood). 2011;236:145–55.
43. Chakravarty G, Rider B, Mondal D. Cytoplasmic compart-mentalization of SOX9 abrogates the growth arrest response of breast cancer cells that can be rescued by trichostatin A treatment. Cancer Biol Ther. 2011;11:71–83.
44. Clocchiatti A, Di Giorgio E, Ingrao S, Meyer-Almes F-J, Tripodo C, Brancolini C. Class IIa HDACs repressive activ-ities on MEF2-depedent transcription are associated with poor prognosis of ER+ breast tumors. FASEB J Off Publ Fed Am Soc Exp Biol. 2013;27:942–54.
45. Rodriguez AL, Tamrazi A, Collins ML, Katzenellenbogen JA. Design, synthesis, and in vitro biological evaluation of small molecule inhibitors of estrogen receptor alpha coacti-vator binding. JMedChem. 2004;47:600–11.
46. Duong V, Bret C, Altucci L, Mai A, Duraffourd C, Loubersac J, Harmand P-O, Bonnet S, Valente S, Maudelonde T, Cavailles V, Boulle N. Specific activity of class II histone deacetylases in human breast cancer cells. Mol Cancer Res. 2008;6:1908–19.
47. Stossi F, Madak-Erdogan Z, Katzenellenbogen BS. Estrogen Receptor Alpha Represses Transcription of Early Target Genes via p300 and CtBP1. Mol Cell Biol. 2009;29:1749–59.
48. Eisen MB, Spellman PT, Brown PO, Botstein D. Cluster analysis and display of genome-wide expression patterns. Proc Natl Acad Sci U S A. 1998;95:14863–8.