Effect of calcium on bioaccessibility of milk
fat during digestion of Cheddar-type cheeses
Thèse
Erik Ayala Bribiesca
Doctorat en sciences et technologie des aliments
Philosophiae doctor (Ph.D.)
Québec, Canada
Effect of calcium on bioaccessibility of milk
fat during digestion of Cheddar-type cheeses
Thèse
Erik Ayala Bribiesca
Sous la direction de :
Sylvie Turgeon, directrice de recherche
Michel Britten, codirecteur de recherche
Résumé
Le fromage cheddar est reconnu comme une excellente source de calcium. Outre son intérêt nutritionnel intrinsèque, le calcium favorise la lipolyse lors de la digestion. Cet effet s’explique par la formation de savons de calcium avec les acides gras saturés à longue chaîne, ce qui entraîne l’exposition de nouveau substrat à l’interphase huile-eau des gouttelettes de gras laitier, permettant à la lipase de continuer son action. En contrepartie, les savons de calcium limitent l'absorption des acides gras impliqués. D’un point de vue technologique, le calcium joue un rôle clé dans la structure du fromage car il participe à la formation du gel de paracaséine. Ayant un effet sur la matrice fromagère et sur la digestion des lipides, le calcium peut alors modifier la biodisponibilité du gras laitier. L’objectif de ce projet était de mieux comprendre l’effet du calcium sur la biodisponibilité du gras laitier à partir de fromages de type cheddar avec le but éventuel de développer des aliments pouvant contrôler la digestion et l’absorption des lipides. Dans un premier temps, des fromages de type cheddar enrichis en calcium par l’ajout de CaCl2 ont été soumis à une digestion in vitro. L’analyse des chymes a permis de démontrer que les fromages enrichis se désintégraient plus lentement que leur contrôle sans calcium ajouté. D’une autre part, la libération d’acides gras des fromages enrichis progressait plus rapidement, mettant en évidence l’effet du calcium sur les mécanismes impliqués dans la lipolyse.
Dans un second temps, des fromages de type cheddar ont été fabriqués à partir de lait standardisé avec des huiles de beurre contrôle, oléine et stéarine et salés avec ou sans CaCl2. Les fromages ont été digérés in vitro pour étudier l’effet du calcium sur la lipolyse et la formation de savons de calcium avec les huiles de beurre ayant différents profils d’acides gras. Les fromages préparés avec la fraction stéarine (avec le rapport le plus élevé d’acides gras saturés à longue chaîne) étaient plus résistants à la désintégration physique et présentaient une lipolyse plus lente que les autres fromages, en raison du point de fusion élevé de cette matière grasse. Les fromages enrichis en calcium présentaient des taux de lipolyse supérieurs aux fromages sans enrichissement. Cette lipolyse accrue a été expliquée par la
formation de savons de calcium avec des acides gras à longue chaîne. Ces composés insolubles pourraient toutefois réduire la biodisponibilité des acides gras impliqués en empêchant leur absorption.
Pour confirmer l’effet du calcium et du type de matière grasse sur la biodisponibilité des lipides, les fromages ont été utilisés par la suite pour une étude chez le rat. La lipémie postprandiale des animaux a été mesurée suite à l’ingestion du fromage. Les matières fécales ont été analysées pour quantifier les acides gras excrétés sous forme de savons de calcium. Les fromages ont eu des effets différents au niveau de la lipémie postprandiale. L'enrichissement en calcium a entraîné une augmentation de la lipémie avec les fromages à l'oléine, alors qu'un pic différé a été observé avec les fromages à stéarine. Ceci s'explique par la formation de savons de calcium avec des acides gras saturés à longue chaîne, favorisant indirectement une lipolyse plus rapide de ceux à courtes et à moyennes chaînes. Le retard du pic pour les fromages à base de stéarine s’expliquait par leur teneur plus élevée en acides gras saturés à longue chaîne, qui formaient des savons avec le calcium et se retrouvaient dans les fèces.
Les résultats confirment que le calcium affecte la digestion intestinale des lipides laitiers en augmentant le taux de lipolyse. Cependant, il limite également la bioaccessibilité des acides gras en produisant, au pH intestinal, des savons de calcium insolubles avec des acides gras saturés à longue chaîne. Ce projet démontre que la biodisponibilité des lipides peut être régulée par le calcium présent dans le fromage cheddar. Cette étude met en évidence l'interaction en cours de digestion du calcium et des lipides présents dans la matrice laitière et confirme sa répercussion physiologique. Ces effets sur la digestion et l'absorption des lipides sont d’intérêt pour la conception de matrices alimentaires pour la libération contrôlée de nutriments et bioactifs liposolubles. D'autres recherches dans ce domaine permettront de mieux comprendre le rôle joué par les aliments sur la santé humaine et d’habiliter le développement de produits laitiers pour contrôler la libération de nutriments afin de moduler les réponses métaboliques. Mots clés : fromage, gras laitier, digestion, lipolyse, savons de calcium.
Abstract
Cheddar cheese is recognized as an excellent source of calcium. In addition to its intrinsic nutritional value, calcium promotes lipolysis during digestion. This lipolysis enhancing effect is explained by the formation of calcium soaps with saturated long-chain fatty acids, resulting in the exposure of new substrate to the oil-water interphase of the milk fat droplets, thus enabling lipase to continue its action. On the other hand, the formation of calcium soaps reduces the absorption of saturated long-chain fatty acids. From a technological point of view, calcium plays a key role in the cheese structure as it participates in the formation of the paracasein gel. By such effects on the cheese matrix and the digestion of lipids, calcium can modify the bioavailability of the dairy fat. The objective of this project was to better understand the effect of calcium on the bioavailability of dairy fat from Cheddar cheeses, in aim to developing food matrices for controlled digestion and absorption of lipids.
In a first step, Cheddar cheeses enriched with calcium by the addition of CaCl2 were subjected to digestion in vitro. Chyme analysis showed that calcium-enriched cheeses disintegrated less rapidly than the non-enriched control but that their lipolysis progressed more rapidly, demonstrating the effect of calcium on the factors that influence lipolysis.
In a second step, Cheddar cheeses were made from standardized milk with control, olein and stearin butter oils and salted with or without CaCl2. The cheeses were digested in vitro to study the effect of calcium on lipolysis and the formation of calcium soaps from butter oils with different fatty acid profiles. Cheeses prepared with the stearin fraction (with the highest ratio of saturated long-chain fatty acids) were more resistant to physical disintegration and presented slower lipolysis than the other cheeses because of the high melting point of this fat. Cheeses enriched with calcium had higher levels of lipolysis than cheeses without enrichment. This increased lipolysis was due to the formation of calcium soaps with saturated long-chain fatty acids. These insoluble compounds could reduce the bioavailability of the fatty acids involved by preventing their absorption.
To confirm the effect of calcium and type of fat on lipid bioavailability, the cheeses were subsequently used for an in vivo study. Postprandial lipemia of Wistar rats was monitored following ingestion of the cheese. The feces were analyzed to quantify the fatty acids excreted as calcium soaps. The cheeses had different effects in postprandial lipemia. Calcium enrichment led to a higher lipemic peak for the cheeses with olein, while a delayed peak was observed for cheeses with the stearin. This was explained by the increased affinity of calcium for saturated long-chain fatty acids, indirectly allowing faster lipolysis of other fatty acids, such as those with short- and medium-chains. The delay for stearin cheeses was due to their high content of saturated long-chain fatty acids, which formed soaps with calcium, thus reducing their absorption and ending up in feces.
The results confirm that calcium plays an important role in intestinal digestion of dairy lipids by increasing the rate of lipolysis. However, it also limits the bioaccessibility of fatty acids by producing insoluble calcium soaps with saturated long-chain fatty acids at intestinal pH conditions. This project demonstrates that the bioavailability of lipids can be regulated by calcium in Cheddar cheese. This study demonstrates the interaction of calcium and lipids present in the dairy matrix during digestion and confirms its physiological repercussion. These effects on digestion and lipid absorption are of interest for the design of food matrices for the controlled release of liposoluble nutrients or bioactive molecules. Further research in this area will provide a better understanding of the role of foods in human health and enable the development of dairy products to control the release of nutrients to modulate metabolic responses.
Table of contents
Résumé ... iii
Abstract ... v
Table of contents ... vii
List of Tables ... xi
List of Figures ... xiii
List of Equations ... xvi
List of Abbreviations ... xvii
Dedication ... xix
Acknowledgements ... xx
Foreword ... xxi
Chapter 1. Introduction ... 1
1.1 Cardiovascular disease risk and fat ingestion ... 2
1.2 Nutritional implications of the food matrix ... 3
1.3 Nutritional relevance of Cheddar cheese ... 4
Chapter 2. Review of literature ... 6
2.1 Human digestion ... 7
2.1.1 Gastrointestinal tract ... 7
2.1.1.1 Mouth and esophagus ... 8
2.1.1.2 Stomach ... 8
2.1.1.2.1 Physical and chemical disintegration of food ... 8
2.1.1.2.2 Gastric emptying ... 9
2.1.1.3 Small intestine ... 10
2.1.1.4 Large intestine ... 11
2.1.2 Nutrient bioaccessibility and bioavailability ... 11
2.2 Digestive handling of nutrients ... 14
2.2.1 Digestion of lipids ... 15
2.2.1.1 Gastric digestion ... 15
2.2.1.2 Intestinal digestion ... 17
2.2.2 Absorption of lipids ... 19
2.2.2.1 Mixed micelles ... 20
2.2.2.2 Paths for lipid absorption ... 21
2.2.2.2.1 Absorption without mixed micelles ... 21
2.2.2.2.2 Absorption mediated by mixed micelles ... 21
2.2.3 Calcium and lipid bioaccessibility ... 24
2.2.3.1 Calcium soaps ... 25
2.2.3.2 Effect of calcium soap formation on lipolysis ... 26
2.3 Postprandial lipids ... 30
2.3.1 Fatty acid handling within the enterocyte ... 30
2.3.2 Postprandial lipemia ... 31
2.3.2.1 Postprandial lipemia and cardiovascular disease ... 34
2.3.2.2 Postprandial lipemia and dietary fat ... 35
2.3.2.3 Postprandial lipemia and dairy products ... 36
2.4 Milk fat ... 37
2.4.1 Composition and structure ... 37
2.4.2 Technological and nutritional functionality of milk fat ... 40
2.4.2.1 Fractions of milk fat ... 40
2.4.2.2 Homogenization of milk fat ... 41
2.4.2.3 Technological properties of milk fat ... 42
2.4.2.4 Nutritional properties of milk fat ... 42
2.4.2.4.1 Size of the milk fat droplets ... 42
2.4.2.4.2 Emulsifying agent of the milk fat droplets ... 43
2.4.2.4.3 Milk fat distribution within the food matrix ... 44
2.5 Cheese ... 46
2.5.1 Nutritional relevance of cheese ... 46
2.5.2 Studies on cheese digestion ... 46
2.5.3 Cheddar cheese ... 47
2.5.3.1 Definition ... 47
2.5.3.2 Manufacturing process ... 48
2.5.3.2.1 Conditioning of milk ... 49
2.5.3.2.2 Clotting of milk ... 50
2.5.3.2.3 Cooking of the curd ... 52
2.5.3.2.4 Cheddaring ... 52
2.5.3.2.5 Salting and forming ... 53
2.5.3.3 Texture and structure of the Cheddar cheese matrix ... 54
2.5.3.4 Role of proteolysis in Cheddar cheese texture ... 54
2.5.3.5 Role of calcium in Cheddar cheese texture ... 55
2.5.3.6 Role of fat in Cheddar cheese texture ... 58
2.6 Digestion models ... 61
2.6.1 In vitro digestion models ... 61
2.6.1.1 Versantvoort in vitro digestion model ... 61
2.6.2 In vivo digestion models ... 63
Chapter 3. Hypothesis and objectives... 65
3.1 Hypothesis ... 66
3.2 Objectives ... 67
Chapter 4. Effect of calcium enrichment of Cheddar cheese on its structure, in vitro digestion and lipolysis ... 68
4.1 Résumé ... 69
4.2 Abstract ... 70
4.3 Introduction ... 71
4.4 Materials and methods ... 74
4.4.1 Preparation of Cheddar-type cheeses ... 74
4.4.2 Cheese composition ... 75
4.4.3 Texture profile analysis ... 76
4.4.4 Scanning electron microscopy ... 76
4.4.6 In vitro digestion of Cheddar-type cheeses ... 77
4.4.6.1 In vitro digestion model ... 77
4.4.6.2 Matrix degradation index ... 78
4.4.6.3 Lipolysis ... 79
4.4.7 Statistical analysis ... 79
4.5 Results and discussion ... 81
4.5.1 Cheese appearance and composition ... 81
4.5.2 Cheese texture ... 84
4.5.3 Cheese microstructure ... 86
4.5.4 In vitro digestion of cheese ... 88
4.5.4.1 Matrix degradation index ... 88
4.5.4.2 Lipolysis ... 91
4.6 Conclusion ... 94
4.7 Acknowledgements ... 96
Chapter 5. Effect of calcium on fatty acid bioaccessibility during in vitro digestion of Cheddar-type cheeses prepared with different milk fat fractions ... 97
5.1 Résumé ... 98
5.2 Abstract ... 99
5.3 Introduction ... 100
5.4 Materials and methods ... 103
5.4.1 Characterization of AMF ... 103
5.4.2 Preparation and characterization of the creams ... 104
5.4.3 Cheddar-type cheeses ... 105
5.4.3.1 Cheese production ... 105
5.4.3.2 Cheese composition ... 106
5.4.3.3 Cheese structure. ... 107
5.4.4 In vitro digestion ... 108
5.4.5 Fatty acid bioaccessibility ... 109
5.4.5.1 Calcium enrichment and fatty acid solubility ... 111
5.4.6 Statistical Analysis ... 112
5.5 Results and discussion ... 114
5.5.1 AMF characteristics ... 114 5.5.2 Preparation of creams ... 117 5.5.3 Cheddar-type cheeses ... 117 5.5.3.1 Cheese composition ... 117 5.5.3.2 Mineral profile ... 119 5.5.3.3 Cheese structure ... 120 5.5.4 In vitro digestion ... 122
5.5.4.1 Fatty acid bioaccessibility ... 128
5.5.4.2 Calcium enrichment and fatty acid solubility. ... 132
5.6 Conclusion ... 136
5.7 Acknowledgements ... 137
Chapter 6. Postprandial lipemia and fecal fat excretion in rats is affected by the calcium content and type of milk fat present in Cheddar-type cheeses ... 138
6.2 Abstract ... 140
6.3 Introduction ... 141
6.4 Materials and methods ... 145
6.4.1 Cheddar-type cheeses ... 145
6.4.2 In vivo protocol ... 146
6.4.3 Calcium soap quantification ... 149
6.4.4 Statistical analysis ... 151
6.5 Results and discussion ... 152
6.5.1 In vivo protocol ... 152
6.5.1.1 Training stage ... 152
6.5.1.2 Postprandial responses ... 152
6.5.2 Quantification of fecal calcium soaps ... 156
6.6 Conclusion ... 162
6.7 Acknowledgements ... 164
Chapter 7. General discussion ... 165
7.1 Completion of the specific objectives ... 166
7.1.1 Assessment of in vitro bioaccessibility of fatty acids from cheese matrices enriched with calcium ... 166
7.1.2 Assessment of the impact of calcium on fatty acid bioaccessibility from cheeses prepared with different milk fats under simulated digestive conditions. ... 166
7.1.3 Modulation of bioavailability of cheese lipids contained by modifying the composition and structure of their matrices. ... 167
7.2 Confirmation of the hypothesis ... 168
7.3 Original aspects and contributions to science ... 169
7.4 Perspectives ... 171
General conclusion ... 172
Bibliography ... 174
Appendices ... 188
Appendix A. In vitro digestion system ... 189
Appendix B. Glyceride-related lipid structure and nomenclature ... 190
Fatty acids ... 190
Main fatty acids with dietary relevance. ... 191
Subclasses of fatty acids ... 191
Triacylglycerols ... 192
Appendix C. Solubility products of some calcium soaps and salts ... 193
Appendix D. Stereospecific composition of milk fat ... 194
List of Tables
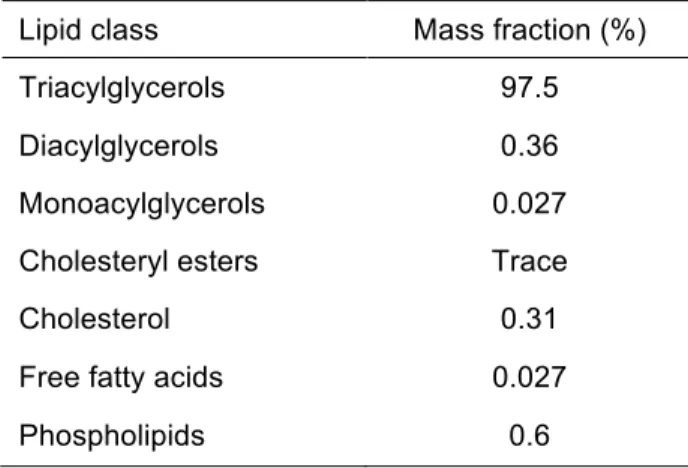
Table 1. Segments of the human small intestine and their approximate physical and biological parameters. Data adapted from Daugherty et al. (1999). ... 10 Table 2. Solubility of calcium soaps in water at 50°C (Pohle, 1941). ... 28 Table 3. Usual composition of major lipid classes in bovine milk (Christie, 1995). ... 37 Table 4. Composition (weight % and mole %) of the major fatty acids in butterfat (Sichien et
al., 2009). ... 39 Table 5. Relative abundance of main fatty acids esterified in cow’s milk triacylglycerols
(Christie, 1995; Jensen et al., 1995). ... 39 Table 6. Typical composition of Cheddar cheese (Health Canada, 2010a). ... 48 Table 7. Experimental conditions used in the salting step for Cheddar-type cheeses. ... 74 Table 8. Composition of a typical fresh Cheddar cheese and the experimental Cheddar
cheeses. ... 82 Table 9. Total and colloidal calcium (mg/g protein) of the experimental cheeses after different
ripening periods. ... 83 Table 10. Water-soluble nitrogen (WSN) to total nitrogen (TN) ratio (as % WSN/TN) in the
experimental cheeses after different ripening periods. ... 84 Table 11. Texture properties of cheeses with different calcium levels. ... 85 Table 12. Main thermal events obtained from differential scanning calorimetry thermograms
recorded at 1°C/min for olein, control, and stearin anhydrous milk fats. ... 115 Table 13. Fatty acid composition of the olein, control, and stearin anhydrous milk fats. ... 116 Table 14. Characterization by laser diffraction of fat droplets in creams obtained by mild
homogenization of olein, control, and stearin anhydrous milk fats in skim milk. ... 117 Table 15. Composition, as mass fraction, and pH of experimental cheeses prepared with
different anhydrous milk fats and salted with NaCl (regular calcium level) or
NaCl + CaCl2 (high calcium level). ... 118 Table 16. Major minerals in experimental regular-calcium cheeses (salted with NaCl) and
high-calcium cheeses (salted with NaCl + CaCl2) (all anhydrous milk fat sources
combined). ... 120 Table 17. Overall bioaccessibility of fatty acids after in vitro digestion of experimental cheeses
prepared with different anhydrous milk fat (AMF) types. ... 129 Table 18. Differences in fatty acid extraction rates (reported as loss ratios) between solvent
extraction from chymes adjusted at pH 7 and 2. ... 133 Table 19. Mass fractions of fat lost (ML) between extraction pairs performed at pH 2 and 7 and
increment in calcium soaps due to calcium enrichment (∆CS) in chyme juices obtained after 270 min of in vitro digestion of Cheddar-type cheeses prepared with different
anhydrous milk fat types and with a regular- or a high-calcium level. ... 134 Table 20. Experimental conditions used for the different Cheddar-type cheeses and their
moisture, fat and calcium content. ... 146 Table 21. Experimental cheeses and the respective number of rats that completed the in vivo
protocol. ... 147 Table 22. Incremental area under the curve (iAUC) for TAG appearance in blood 6 h into the
postprandial phase after ingestion of experimental cheeses prepared with different
types of anhydrous milk fat (AMF). ... 155 Table 23. Mass fraction of long chain fatty acids and total fatty acids (FA) recovered in feces,
on a dry basis (mg/g), from rats that were fed Cheddar-type cheeses prepared with a control, olein or stearin AMF. ... 157 Table 24. Mass fraction long chain fatty acids and total fatty acids (FA) recovered in feces, on
a dry basis (mg/g), from rats that were fed Cheddar-type cheeses with regular or high calcium content. ... 157 Table 25. Mass fraction of Ca, Mg and P recovered in feces, on a dry basis (mg/g), from rats
that were fed Cheddar-type cheeses with regular or high calcium content. ... 159 Table 26. Composition of the simulated digestion fluids used in the Versantvoort in vitro
Table 27. Common names and molecular weights (MW) of some carboxylic acids. Compilation from various sources (Christie, 1995; Jensen et al., 1995; Kaylegian et al., 1995;
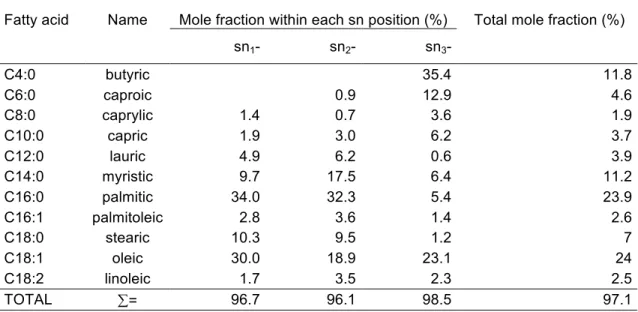
Lide, 2005). ... 190 Table 28. Molecular weight (MW) and molar and mass fractions of milk fat fatty acids per their
sn- position on the TAG (Walstra et al., 1984). ... 194
List of Figures
Figure 1. Gastrointestinal tract parts with the main processes and physiological characteristics for each major segment. Reproduced from Guerra et al. (2012). ... 7 Figure 2. Ordering of factors in bioaccessibility and bioavailability. Reproduced from
Duchateau et al. (2009). ... 12 Figure 3. Interfacial processes occurring during pancreatic lipolysis at oil-water interface of fat
droplets. Reproduced from Golding et al. (2010). ... 18 Figure 4. Lipolysis of triacyglycerol (TAG) by digestive lipases, producing non-esterified fatty
acids (NEFA) and sn-2 monoacylglycerols (2-MAG). Reproduced from Berry et al.
(2005). ... 18 Figure 5. Schematic representation of transport of lipolysis products assembled in mixed
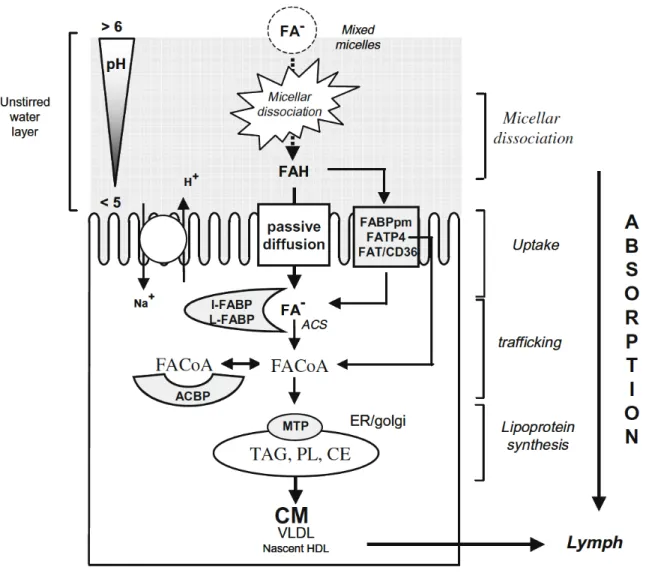
micelles from the lipid droplet to the enterocyte. Modified from Jones et al. (2006). ... 20 Figure 6. Main processes involved in intestinal absorption of long-chain fatty acids (LCFA).
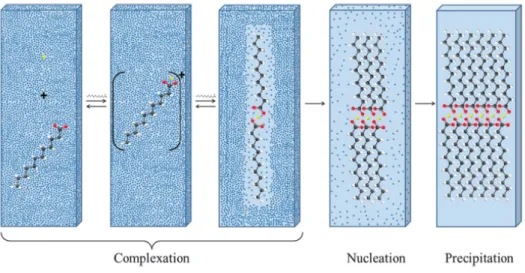
Adapted from Niot et al. (2009). ... 24 Figure 7. Schematic representation of complexation between calcium and saturated fatty acids
(lauric acid depicted) in aqueous media. Reproduced from Pereira et al. (2012). ... 25 Figure 8. Schematic representation of the formation of calcium soaps at the lipid-water
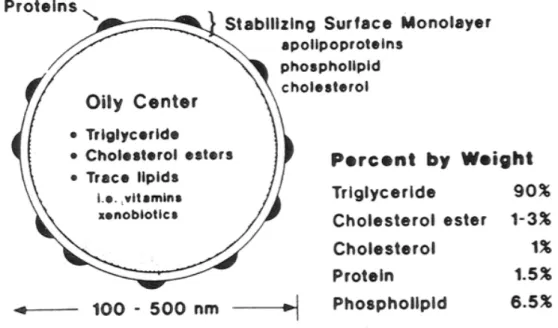
interphase with FA produced by lipolysis. Based on the figure by Jones et al. (2006). ... 27 Figure 9. Schematic structure and composition of chylomicrons, the main lipoproteins secreted
by the enterocytes into the lymphatic system (Klein et al., 2006). ... 31 Figure 10. Main lipoproteins and their approximate dry-weight mass ratio triglyceride content
(%) in each fraction, all contributing to total serum triglyceride concentration.
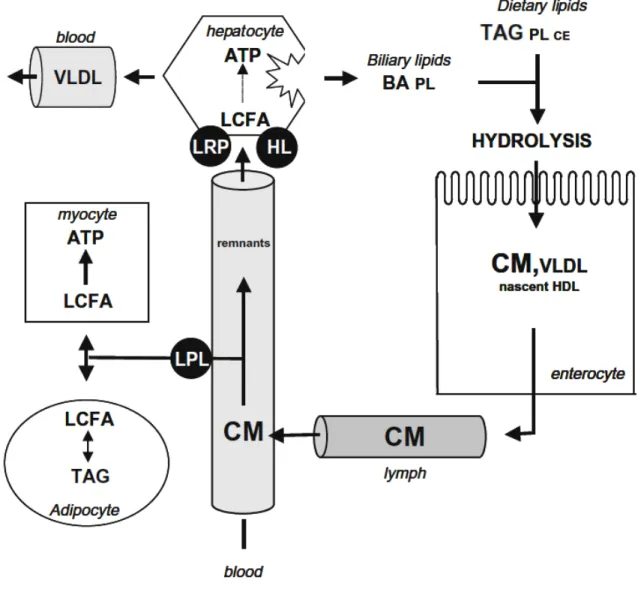
Reproduced from Ooi et al. (2011). ... 32 Figure 11. Representation of the circulation and metabolic fate of postprandial lipids in the
body. Modified from Niot et al. (2009). ... 34 Figure 12. Distribution of different fatty acid groups in AMF and its fractions obtained by
crystallization from the melt. Values indicate mass fraction (%) of each FA group.
Modified from Augustin et al. (2006). ... 40 Figure 13. Melting profile of milk fat, stearin and olein determined by differential scanning
calorimetry (DSC) with a heating rate of 5°C/min. Reproduced from Sichien et al.
(2009). ... 41 Figure 14. Generic process for Cheddar cheese manufacture. Adapted from Everett (2007). ... 49 Figure 15. Schematic representation of a) paracasein aggregation during the gel formation and
b) the subsequent rearrangement events leading to local shrinkage and whey
expulsion from the gel (syneresis). Adapted from Walstra et al. (2005). ... 52 Figure 16. Dual bonding model of structure of casein micelle, with b, k and a-casein and CCP
depicted as indicated and hydrophobic and hydrophilic bonding regions represented by parallel bars and CCP clusters, respectively. Reproduced from Horne (1998). ... 56 Figure 17. Confocal laser scanning microscopy (CLSM) (left, bar = 10 µm) and Cryo-scanning
electron micrographs (right, bar = 5 µm) images of samples with the addition of 50 (left) or 300 mg/L CaCl2 (right), respectively for A, E: gel; B, F: cooked curd; C, G: cheddared curd and D, H: cheese. For CLSM, red and green channels represent protein and fat, respectively. Arrows indicate micro-pores. Adapted from Ong et al.
(2013). ... 57 Figure 18. Hardness values as determined by texture profile analysis for a control
Cheddar-type cheese and cheeses salted with different amounts of NaCl and CaCl2 or trisodium citrate (TSC). Ratios indicate the contribution of each salt to the ionic
strength. Adapted from Brickley et al. (2009). ... 58 Figure 19. Confocal laser scanning micrographs of the protein (a) and fat (b) in full fat Cheddar
cheeses. The protein (long arrow) and fat (short arrow) are shown as light areas against a dark background. The micrographs were taken at 1 d. Bar = 25 µm.
Figure 20. In vitro digestion sequence for cheese digestion, based on the model proposed by Versantvoort et al. (2004) and adapted to Cheddar cheese (Ayala-Bribiesca et al.,
2016). ... 63 Figure 21. Scanning electron micrographs of control, high-calcium, and very high-calcium
cheeses. Arrows indicate examples of a) a space occupied by an individual milk-fat globule, b) an intact protein matrix, c) a space occupied by partially coalesced milk-fat globules, d) a dehydrated protein matrix, and e) a space occupied by large fat
reservoirs. Bar = 10 µm. ... 86 Figure 22. Confocal laser micrographs of control, high-calcium, and very high-calcium
cheeses. Green and red channels represent fat and protein, respectively.
Overlapping channels (top images) show the distribution of fat and protein within the cheese matrix. Bar = 40 µm. ... 87 Figure 23. Matrix degradation index values during the in vitro digestion of a) cheeses with
different calcium levels (all ripening times combined) and b) cheeses ripened for 1, 2, or 4 weeks (all calcium levels combined). The plots begin after the completion of the oral phase (5 min). SEM = 0.51%. ... 90 Figure 24. Evolution of non-esterified fatty acids (NEFA) and lipolysis during the intestinal
phase of the in vitro digestion of control, high-calcium, and very high-calcium
cheeses. SEM = 1.61%. ... 92 Figure 25. Differential scanning calorimetry thermograms of the control, olein, and stearin
anhydrous milk fats recorded during a crystallization and melting cycle from 70 to −50°C (1 to 2) and −50 to 70°C (2 to 3) at a rate of 1°C/min. Exothermic (a) and endothermic (b) events are shown for the crystallization and melting spans,
respectively. ... 115 Figure 26. Scanning electron micrographs of Cheddar-type cheeses prepared with olein,
control, or stearin anhydrous milk fats and with regular or high calcium levels for salting conditions with, respectively, NaCl or NaCl + CaCl2. Voids represent the space once occupied by fat. Bar = 10 µm. ... 120 Figure 27. Confocal laser scanning microscopy images of Cheddar-type cheeses prepared
with olein, control, or stearin anhydrous milk fats and with regular or high calcium levels for salting conditions with, respectively, NaCl or NaCl + CaCl2. Green and red channels represent fat and protein, respectively. Overlapping channels show the
distribution of fat within the protein matrix. Bar = 20 µm. ... 121 Figure 28. Hardness at 22 and 37°C of Cheddar-type cheeses prepared with olein, control, or
stearin anhydrous milk fats. SEM = 0.32. ... 122 Figure 29. Matrix degradation index of Cheddar-type cheeses prepared with olein, control, or
stearin anhydrous milk fats during in vitro digestion. SEM = 0.9. ... 124 Figure 30. Progression of lipolysis (% as the mass fraction of non-esterified fatty acids in
relation to the anhydrous milk fat) during the in vitro digestion of Cheddar-type cheeses prepared with olein, control, or stearin AMF and with regular or high calcium levels for cheeses salted with, respectively, NaCl or NaCl + CaCl2. Bars indicate
SEM. ... 125 Figure 31. Change in pH during the in vitro digestion of Cheddar-type cheeses prepared with
olein, control, or stearin anhydrous milk fats (AMF). The dotted line indicates the
expected pH before the first sampling. SEM = 0.02. ... 128 Figure 32. Bioaccessibility of saturated long-chain fatty acids after the in vitro digestion of
Cheddar-type cheeses prepared with different AMF types. Different letters indicate
significant differences within bar groups. SEM ≤ 0.7 for all FA. ... 130 Figure 33. Bioaccessibility of short-chain, medium-chain, and unsaturated fatty acids after the
in vitro digestion of Cheddar-type cheeses prepared with different calcium levels and different AMF types. Dashed connectors indicate significant differences between regular and high calcium levels (left and right markers, respectively), and solid lines indicate statistically equivalent means. SEM = 3.9, 3.0, 2.3, 1.7, 1.0, and 1.4 for C4:0, C6:0, C8:0, C10:0, C12:0, and C18:1, respectively. ... 130 Figure 34. Typical layering of chymes during solvent extractions at pH 7 (after centrifugation).
Figure 35. Fatty acid subclass composition (molar %) of different anhydrous milk fats (AMF) used to prepare the Cheddar-type cheeses. Calculated from data presented by Ayala-Bribiesca et al. (2017). Subclasses UFA, LCFA, MCFA and SCFA stand, respectively, for unsaturated fatty acids (C18:1, C18:2 and C18:3), long-chain fatty acids (C18:0 to C14:0), medium-chain fatty acids (C12:0 to C8:0) and short-chain
fatty acids (C4:0 and C6:0). SEM < 0.1% for all subclasses. ... 145 Figure 36. Training protocol for the ingestion of cheese meals prior to the oral lipid-tolerance
test (OLTT). ... 148 Figure 37. Postprandial progression of (a) glucose (b) total cholesterol and (c) NEFA
concentrations in plasma after the ingestion of a cheese meal. Bars indicate SEM. ... 154 Figure 38. Postprandial progression of TAG concentration in plasma after the ingestion of
Cheddar-type cheese with regular or high calcium content and prepared with olein,
control or stearin AMF. Bars indicate SEM. ... 156 Figure 39. Schematic representation of the original Versantvoort in vitro digestion model
(Versantvoort et al., 2005). ... 189 Figure 40. Structure of the triacylglycerol (TAG) molecule. Reproduced from Berry et al.
List of Equations
Equation 1. Matrix degradation index. ... 79
Equation 2. Ionic strength of a solution. ... 106
Equation 3. Matrix degradation index. ... 109
Equation 4. Loss ratio of fatty acids extracted under different pH conditions. ... 111
Equation 5. Mass fraction of fat lost between extractions at neutral and acidic pH conditions. ... 112
Equation 6. Increment in calcium soaps due to calcium enrichment. ... 112
List of Abbreviations
AMF Anhydrous milk fat ANOVA Analysis of varianceBA Bile acids
CCP Colloidal calcium phosphate CE Cholesterol esters
CEL Cholesterol-esterase lipase
CLSM Confocal-laser scanning microscopy
CM Chylomicron
CMP Caseino-macropeptide
CS Calcium soaps
CVD Cardiovascular disease
DAG Diglycerides (or diacylglycerides) DSC Differential scanning calorimetry EDTA Ethylenediaminetetraacetic acid
FA Fatty acids
FABP Fatty acid binding proteins FCF For coloring food
FID Flame-ionization detector
GC Gas chromatography
GI Gastro-intestinal
HDL High-density lipoproteins HGL Human gastric lipase HL Hepatic lipase
HPL Human pancreatic lipase
iAUC Incremental area under the curve
ICP-OES Inductively coupled plasma-optical emission spectroscopy IDL Intermediate density lipoproteins
LCFA Long-chain fatty acids LDL Low-density lipoproteins LRP LDL-related peptide LSD Least square difference
MAG Monoglycerides (or monoacylglycerides) MCFA Medium-chain fatty acids
MDI Matrix degradation index MFG Milk fat globule
MFGM Milk fat globule membrane MW Molecular weight
NEFA Non-esterified fatty acids OLTT Oral lipid tolerance test
PL Phospholipids
PLA2 Phospholipase A2 PES Poly-ether sulfone
PUFA Polyunsaturated fatty acids PPL Postprandial lipemia
SCFA Short-chain fatty acids SEM Standard error of the mean SPE Solid-phase extraction
TAG Triglycerides (or triacylglycerides) TN Total nitrogen
TPA Texture profile analysis TRL Triglyceride-rich lipoproteins TSC Trisodium citrate
UFA Unsaturated fatty acids VLDL Very low density lipoproteins WSN Water-soluble nitrogen
Dedication
Aire…
Cada respiro lleva tu nombre.
A mis abuelos, Laura, Elvia, Federico y Daniel, por mostrarme el horizonte, a mis padres, Elsa y Daniel, por haberme dado alas,
a mi mentor, Rafael Said Tannos Uribe, por echarme a volar, a Marie-Ève, por guiarme con bien a mi destino.
Acknowledgements
Michel Britten, merci pour autant d’heures de conversation stimulante. Que le sujet ait été la science ou la vie, ta porte a toujours été ouverte et tes conseils appréciés.
Sylvie Turgeon, merci pour ton appui, ton écoute et ta confiance, au Québec et ailleurs! Jean Amiot, merci de m’avoir conseillé dans un projet d’études qui est devenu un projet de vie. Laurent Bazinet, merci de m’avoir introduit à la recherche et de m’avoir appuyé dans mes projets. Marie-Caroline Michalski, merci d’avoir été une source d’inspiration scientifique admirable.
Marie-France Morissette, Martine Lussier, Audrey Robert, Charline Guilbault. Merci pour vos précieux coups de mains (oui, mains, car une digestion in vitro à 4 mains se passe toujours mieux). Travailler avec vous pendant vos stages a été amusant et très enrichissant pour moi.
Gaétan Bélanger, Hélène Giroux, Nathalie Rémillard, Annie Caron, Denise Chabot, Daniel St-Gelais, Caroline Lapointe, Nancy Graveline, Jacinthe Fortin et Denis Bélanger d’Agriculture et agroalimentaire Canada. Merci d’avoir partagé votre expertise et votre bonne humeur.
Sophies Turcot et Lamothe. J’ai appris beaucoup avec vous, mais merci surtout pour les fous rires. Diane Montpetit, merci pour tes leçons de vie, même en fin de vie.
Hélène P. Drolet, merci pour ton écoute, ton amitié et ton imbattable sucre à la crème.
Merci aux équipes en arrière-scène pour leur aide dans la rédaction de cette thèse : Bibliothèque du CRD de St-Hyacinthe et Service de consultation en statistique de l’Université Laval.
« Thèsez-vous ? », merci d’être catalyseur d’inspiration, de productivité et de rencontres amicales. Geneviève Pilon et André Marette, merci d’avoir partagé votre savoir-faire et de m’avoir accueilli dans votre laboratoire pour que je puisse inclure une étude in vivo dans ce projet.
Didier Dupont, Claire Bourlieu, Olivia Ménard, Amélie Déglaire et à toute l’équipe de l’unité en Science et technologie du lait et de l’œuf (STLO) de l’INRA à Rennes, France, merci pour votre accueil durant 6 mois bien remplis de science, amitié et gastronomie.
Gracias a mis profesores Rafael Tannos, Jorge Maldonado, Jorge Nieto, François Da Ponte y Marte García. En su momento marcaron de manera positiva la persona que soy ahora.
Marie-Ève, merci pour ton appui et ta patience. Tu es la pierre angulaire de mon bonheur. Tristan, Ariane y Katia: perdón por los momentos de ausencia y gracias por no tocar mi compu. Los amo. Pá, yo me tardé un mes de más y tú te fuiste antes de tiempo. Con el olor de tu corbata me alimentaste en la defensa de mi tesis. Siempre te llevaré conmigo, en cada comida y en cada viaje. Raffie, thanks for your friendship and your blunt honesty. Thanks to you I have realized that one question concerning digestion will forever remain unanswered: Who cut the cheese?
Foreword
This thesis is divided in 7 chapters, as follows:
Chapter 1 is an introduction to the nutritional importance of the food matrix. It presents different aspects of health relevance of dairy products, namely those concerning Cheddar cheese.
Chapter 2 is a review of literature on human digestion, with emphasis on lipid digestion and the chemical interaction of calcium with digestion products. The general characteristics of milk fat are presented and recent works on its health implications are discussed. Lastly, the manufacturing process of Cheddar cheese is presented, with emphasis on the factors influencing its texture and the functional role of calcium.
Chapter 3 presents the hypothesis and the general objectives of the project
Chapter 4, 5 and 6 are written as research papers presenting the experiments and results corresponding to the research objectives presented in chapter 3.
Chapter 7 provides a general discussion on the main findings of this project, and stresses the complementarity between in vitro and in vivo models.
A general conclusion highlights the main findings of this project and emphasizes on their significance towards the development of wholesome and healthy foods.
1.1 Cardiovascular disease risk and fat ingestion
From the estimated 58 million deaths in 2005, cardiovascular diseases (CVD) are the most important cause of mortality in the World (World Health Organization, 2007). In 2005, CVD accounted for about 17.5 million deaths, equivalent to more than 30% of all deaths causes (World Health Organization, 2007). In Canada, CVD are the second most important cause of mortality, being responsible for nearly 25% of the deaths in 2013, just after cancer (Statistics Canada, 2017).
One of the underlying pathologies of CVD is atherosclerosis, which develops over many years and is usually advanced by the time symptoms occur (World Health Organization, 2007). Research has shown that abdominal obesity and exaggerated postprandial lipemia are among the main risk factors1 for CVD and mortality (Bohl et al., 2015) by contributing to the induction and progress of atherosclerosis (Wilhelm et al., 2003; Zilversmit, 1995). Both risk factors can be related to lifestyle, especially inappropriate dietary behavior (Bohl et al., 2015). For this reason, the association of fat with CVD risk factors has reflected on nutritional guidelines outlining ingestion limits and different nutritional impact of different fats (World Health Organization, 2007).
Nutritionally speaking, fat has been targeted since the early 1960s for its consequences on human health (Keys et al., 1957, 1965). However, the ingestion of saturated fat as a major risk factor for CVD has been revised and nuanced during the past two decades, especially in the case of fat from dairy products (Elwood et al., 2004a; Elwood et al., 2004b; German, 2008; German et al., 2009; Gibson et al., 2009). In sum, high-fat dairy products are not consistently associated with higher CVD risk and have even been found to have positive effects on overall health (German, 2008; German et al., 2009; Huth et al., 2012; Visioli et al., 2014). Given the wide array of structures and composition of dairy foods, further research is necessary to better understand their role on digestion, absorption and metabolism to predict their effect on CVD risk (Bohl et al., 2015).
1.2 Nutritional implications of the food matrix
Traditionally, foods have been formulated to meet special needs and market trends by replacement or elimination of specific components. Such compositional tailoring interprets the food as a simple addition of individual components, without accounting for the complex chemical and physical interactions that food components may have on nutrient release and absorption (Turgeon et al., 2011). Under the compositional approach, food structure has often been overseen and the implications on its health properties are far from being thoroughly explored (Argov et al., 2008). On the upside, food design is evolving towards food systems that promote health of the individual consumer. In this sense, parallel to the formulation, the role of the food matrix is being emphasized (Nehir El et al., 2012; Turgeon et al., 2011).
The food matrix is the continuous medium, of natural or technological origin, where nutrients can interact at different length scales with its components and structures (Parada et al., 2007). There is a need to understand the association between the food matrix and its role on nutrient release beyond simple food composition. Basic understanding of the physicochemical processes taking place during digestion is required to design food matrices that can modulate nutrient release and absorption (Norton et al., 2015; Parada et al., 2007). This will help identify food processing techniques and parameters that could modify the food matrix to enhance or hinder biological availability of certain nutrients (Hur et al., 2009; McClements et al., 2009a; McClements et al., 2009b).
1.3 Nutritional relevance of Cheddar cheese
Dairy products have widespread consumption and are of nutritional and economic importance. Cheddar cheese is a dairy product widely consumed in North America. On a technological basis, Cheddar cheese is a well-studied food, but its nutritional role is usually brought down to its composition, without considering the possible matrix effects during digestion and nutrient absorption. Although Cheddar cheese is recognized as a source of calcium, its reputation has been tarnished by the high amount of fat it contains. However, several studies have shown that cheese, as well as other dairy products, do not have the deleterious effects once associated with foods containing saturated fats and that some may even have a positive effect on health (Christensen et al., 2009; de Oliveira Otto et al., 2012; German et al., 2009; Tremblay et al., 2011).
These beneficial effects have been in part linked to the calcium content and to the structure of such products (Soerensen et al., 2014). Calcium largely determines the structural characteristics of cheeses like Cheddar by promoting association of casein micelles during renneting (Ong et al., 2013). Secondly, calcium plays a major role on lipid digestion by enhancing lipolysis, but simultaneously limiting the absorption rate of the fatty acids released by forming calcium soaps (Lorenzen et al., 2011; Welberg et al., 1994). These opposed effects are self-coordinated and have been identified as one of the main reasons for their positive health repercussions.
The main objective of this project was to better understand the role of calcium on the Cheddar cheese matrix, its microstructure and nutrient release, specifically lipids, during digestion. Hence, Cheddar-type cheeses were prepared with different calcium levels and milk fats with different fatty acid profiles to study the calcium-lipid interactions taking place under simulated digestive conditions. Successively, a rat model was used to validate in vitro data and assess the metabolic impact of the calcium-lipid interactions on lipid bioavailability.
In sum, this study describes the process by which Cheddar cheese releases its lipid nutrients, specifically fatty acids, during the digestion process and how such nutrients are absorbed. These findings could result in novel nutritional aspects that could be modulated in food systems and adapted for the food industry, which is the goal of the present project. Knowledge generated by this project will aid the food industry’s capability of designing food matrices that enhance the consumers’ health by modulating the physiological repercussions of foods, especially those concerning postprandial lipemia. Eventually, new strategies may be developed to produce food with regulated nutrient release and absorption or targeted delivery of bioactive molecules.
2.1 Human digestion
2.1.1 Gastrointestinal tract
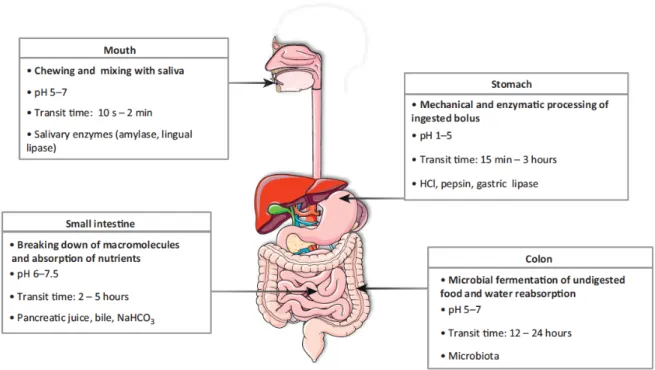
Digestion is the process by which complex nutrients in food are broken down into absorbable forms that can pass through the epithelial cells lining the mucosa of the gastrointestinal (GI) tract into the underlying blood and lymphatic vessels (Kong et al., 2008a; Versantvoort et al., 2004). Digestion starts as food enters the mouth and continues as it passes through the GI tract, which is the tubular organ that extends from the posterior oropharynx to the anus (Klein et al., 2006). The different parts of the GI tract and the main processes and physiological characteristics for each major segment are presented in Figure 1.
Figure 1. Gastrointestinal tract parts with the main processes and physiological characteristics for each major segment. Reproduced from Guerra et al. (2012).
Digestion and absorption are the two main processes taking place in the GI tract. During digestion, the food is broken down, physically and chemically, into absorbable forms. Then absorption takes place and the nutrient passes the GI mucosa to become available for metabolism. Although digestion and absorption are distinct processes, they are entwined throughout the different parts of the GI
tract. In each part, specific changes occur to the food constituents and the sites of absorption aim the uptake different nutrients.
2.1.1.1 Mouth and esophagus
The mouth has an important role in food digestion by activating the integrated response of the GI tract to a meal (Stenson, 2006). Formally, the mouth is not part of the GI tract but the mastication process allows deglutition and facilitates digestion (Klein et al., 2006). During its short time in the mouth, food pieces are reduced in size by mastication and are incorporated with saliva into a smooth bolus that can be swallowed (Klein et al., 2006; Kong et al., 2008a; Stenson, 2006). Saliva contains enzymes that immediately start nutrient breakdown. Amylases act on starch hydrolysis, although most of their action takes place in the stomach (Stenson, 2006). A lingual lipase is also secreted in saliva, but its lipolytic action is minimal when compared to lipases from the GI tract (Klein et al., 2006), and it has mainly been suggested to play a role in oral sensitivity to fat (Laugerette et al., 2006; Laugerette et al., 2005; Pepino et al., 2012). Residence time in the mouth goes from seconds to minutes (Oomen et al., 2002), until most particles in the bolus have a diameter of 3 mm or smaller (Hoebler et al., 2000; Jalabert-Malbos et al., 2007; Klein et al., 2006).
After being swallowed, the food passes into the esophagus and formally enters the gastrointestinal tract (Kong et al., 2008a). The adult esophagus is approximately 25 cm long and it transports the bolus from the mouth into the stomach. Besides some mucus to aid in transit, no digestive fluids are incorporated into the bolus during its passage through the esophagus. Contraction of the esophagus transports the food through the diaphragmatic hiatus and into the stomach (Klein et al., 2006).
2.1.1.2 Stomach
2.1.1.2.1 Physical and chemical disintegration of food
The stomach serves as a reservoir where food continues to be mechanically and chemically disintegrated (Kong et al., 2008b). As food is ingested, the fundus (i.e.
the upper part of the stomach) relaxes to contain arriving bolus (Stenson, 2006). Gastric fluids are secreted to achieve chemical breakdown. At the beginning of the fed state2 the pH of the gastric medium is raised from around 2 up to 5 when buffered by food components (Klein et al., 2006). Gradually, the secretion of HCl lowers the pH back to 2 (Malagelada et al., 1976), which provides optimal conditions for pepsin activity (Minekus et al., 2014).
Besides the chemical disintegration, the antral musculature grinds food into smaller particles (Stenson, 2006). The repetitive contractions of the antral musculature squeeze the chyme towards the pyloric sphincter and the chyme squirts back into the body of the stomach (Stenson, 2006). This way, gastric motility grinds food particles and emulsifies fat into the chyme. An appreciable digestion of carbohydrates, proteins and lipids occurs in the stomach (Stenson, 2006). Some absorption (i.e. small hydrophilic molecules) takes place in the stomach, but most gastric contents are emptied into the small intestine.
2.1.1.2.2 Gastric emptying
Another important function of the stomach is regulating gastric emptying (i.e. the control of the chyme flow into the small intestine (Stenson, 2006)). Gastric emptying depends on the volume contained in the stomach and the degree of disintegration and chemical breakdown of the chyme. Gastric emptying delivers a relatively steady rate of 200 kcal/hour into the intestine, so the caloric density of the chyme also plays in regulating its emptying (Stenson, 2006). Other factors in response to food-related factors that modify the gastric emptying rate are osmolality, fat content, pH, and the mechanical food characteristics (e.g. liquid, viscous, solid) (Stenson, 2006).
The composition of the food impacts gastric emptying because not all nutrients are emptied at the same rate. For instance, fat floats over the aqueous medium, which
2 Gastric conditions differ between the fed and the fasted state (i.e. with or without food, respectively) (Versantvoort et al., 2004). An important difference, being more acidic in the fasted state (i.e. 1 ≤ pH ≤ 2 (Oomen et al., 2002)) than in the fed state (i.e. 5 ≤ pH ≤ 6).
delays its emptying with respect to latter (Stenson, 2006). Furthermore, solid fats can bind to solid particles and delay their emptying. Liquids are emptied faster than solids because they do not require grinding (Stenson, 2006). Gastric emptying of solid food is also affected by the disintegration process, which is mainly affected by surface erosion and texture softening during digestion (Kong et al., 2008b). Smaller particles are more easily digested by enzymes due to more exposed surface (Stenson, 2006). In general food particles are reduced to a size of 1 to 2 mm before they pass to the small intestine (Kong et al., 2008a; Stenson, 2006). Since different food structures behave in a different manner during digestion, altering such structures may modify the emptying process (e.g. aiming for harder textures to delay physical breakdown) (Kong et al., 2008b).
2.1.1.3 Small intestine
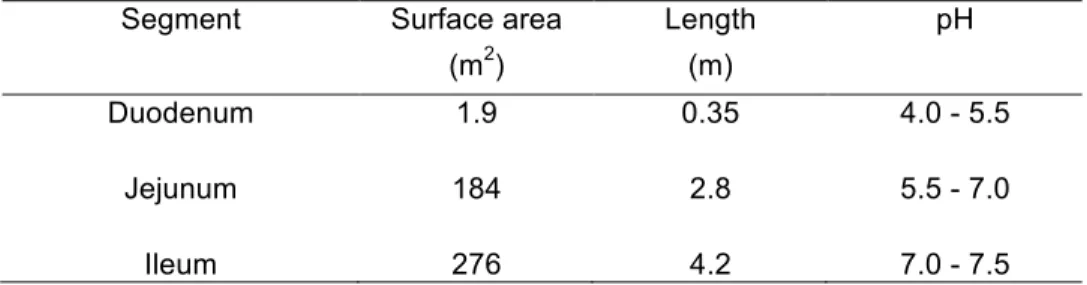
The chyme arriving from the stomach contains partially digested nutrients and digestive breakdown is completed in the small intestine (Versantvoort et al., 2004). The small intestine is the organ with the largest absorption surface and it consists of three continuous segments: duodenum, jejunum and ileum (Table 1). As the chyme moves forward in the small intestine, the pH increases due to the secretion of carbonate and bile salts (Daugherty et al., 1999; Diem et al., 1970; Oomen et al., 2002; Versantvoort et al., 2004).
Table 1. Segments of the human small intestine and their approximate physical and biological parameters. Data adapted from Daugherty et al. (1999).
Segment Surface area Length pH
(m2) (m)
Duodenum 1.9 0.35 4.0 - 5.5
Jejunum 184 2.8 5.5 - 7.0
Ileum 276 4.2 7.0 - 7.5
The duodenum is connected to the stomach through the pylorus and it is attached along to the pancreas, which secretes juices containing carbonate, bile salts and
the enzymes that finish food breakdown to enable absorption. The duodenum represents only a short segment of the small intestine, around 30 cm long, but it acts as a neutralizing and mixing chamber for the chyme exiting the stomach with the pancreatic secretions (Daugherty et al., 1999; Guerra et al., 2012). From the duodenum, chyme advances into the jejunum due to peristaltic movement (Klein et al., 2006). After the jejunum, the chyme reaches the ileum, the last segment of the small intestine, where absorption of released nutrients is completed. Most nutrients are absorbed at the jejunum and ileum, given their length and a longer residence time of the chyme, when compared to the duodenum (Daugherty et al., 1999; Oomen et al., 2002). The ileum also reabsorbs most of the bile salts (Jones et al., 2006). At the end of the ileum, the ileocecal valve marks the entry into the large intestine. About 90% of all nutrients are absorbed in the small intestine, with most of them being absorbed in the jejunum. The other 10% occurs in the stomach and large intestine (Versantvoort et al., 2004).
2.1.1.4 Large intestine
Any non-digested or non-absorbable components pass into the large intestine, where the water and mineral contents of the chyme will be recovered. Any bile salts remaining are also recovered and stored in the gallbladder for further use (Jones et al., 2006). At this point, absorption of macronutrients is complete and the intestinal flora consumes part of the non-digested or non-absorbed components. At the end, all residues are excreted as feces.
2.1.2 Nutrient bioaccessibility and bioavailability
The purpose of digestion is to enable nutrient absorption. However, not all ingested nutrients can be absorbed and used for normal body functions so the total amount of a nutrient in a food does not necessarily reflect the amount of such that can be absorbed (Oomen et al., 2002). Furthermore, not all nutrients in an absorbable form are necessarily bioavailable. Nutrient bioavailability (i.e. biological availability) is the fraction of an ingested component that eventually ends up in the systemic circulation (Versantvoort et al., 2004) and it is the key to nutrient effectiveness
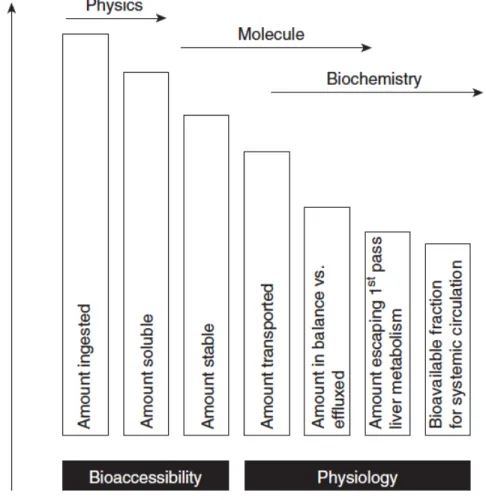
(Watzke, 1998). Bioavailability depends on several physicochemical and biochemical processes, as depicted in Figure 2.
Figure 2. Ordering of factors in bioaccessibility and bioavailability. Reproduced from Duchateau et al. (2009).
In simplified terms, bioavailability (F) can be defined by 3 factors as F = Fb * Ft * Fm (McClements et al., 2009a; Oomen et al., 2003). Bioaccessibility (Fb) represents the fraction of an ingested component that is released from the food matrix into the juices of the gastrointestinal tract (Versantvoort et al., 2004). Processes affecting bioaccessibility of components include the release from the food matrix, their solubility and their stability at gastrointestinal conditions (Duchateau et al., 2009). Transport (Ft) represents the fraction of the released component that is transported across the intestinal epithelium (Versantvoort et al., 2004). Such transport is determined by the gut wall permeability to the specific
component (Duchateau et al., 2009), including active and passive transport mechanisms. Finally, metabolism (Fm) represents the fraction of the component that can reach its site of action (McClements et al., 2009a; Versantvoort et al., 2004). Such fraction differs if nutrients are transported into systemic circulation through the lymph or the portal vein (Duchateau et al., 2009). For the latter, the fraction is highly dependent on the liver first-pass effect, which implies major remodeling of nutrients that are absorbed through the portal vein (Duchateau et al., 2009). The transport pathway depends on the physicochemical properties of the compound. Hydrophilic compounds are preferentially transported though the portal vein, whereas lipophilic compounds are transported through the lymph (Duchateau et al., 2009). Altogether, bioavailability is the outcome of a complex physicochemical, biochemical and physiological stepwise reduction processes (Duchateau et al., 2009), which complicates its study by in vitro approaches.
The term bioaccessibility is commonly used when using in vitro approaches to digestion because it specifically designates the fraction of a substance that is freed from the food matrix and that is available for absorption from the gastrointestinal environment (Failla et al., 2005; Ruby et al., 1999; Versantvoort et al., 2004). In other words, bioaccessibility gives information on the digestibility of a food component or a nutrient (Failla et al., 2005). In vitro approaches to digestion are useful to study digestion processes, even if they lack the complex physiology that takes place in living organisms (van Aken, 2010). Nevertheless, in vitro models can be used to predict bioavailability and to screen and target experimental conditions before proceeding with in vivo models or clinical studies (Failla et al., 2005).
2.2 Digestive handling of nutrients
Different food components follow specific digestion processes, which differ according to the chemical nature of each nutrient. Macronutrients (i.e. carbohydrates, proteins and lipids) follow a specific breakdown pathway and are absorbed at different sites in the gastrointestinal tract. Absorption of micronutrients (e.g. vitamins and minerals) is influenced by macronutrient breakdown, which releases them from the food matrix. Once released, some nutrients follow similar uptake pathways as the macronutrients (Borel, 2003).
Salivary amylase is secreted in the mouth, where it begins to break down starches into smaller carbohydrates and continues its hydrolytic action in the stomach while the buffering effect of food lasts. Salivary amylase is inactivated eventually at low pH in the stomach (Keim et al., 2006; Versantvoort et al., 2004). The pancreas also secretes other amylases (Keim et al., 2006). Starches are further hydrolyzed by pancreatic amylase into disaccharides, trisaccharides and α-dextrins (i.e. 5 to 10 glucose units) (Versantvoort et al., 2004). Finally, enzymes at the brush border complete the digestion to monosaccharides, which are then absorbed (Versantvoort et al., 2004). Most simple sugars present or produced by amylases and other intestinal enzymes are water-soluble and are transported from the small intestine to the liver via the portal vein (Keim et al., 2006). Non-hydrolyzed carbohydrates (e.g. dietary fiber), pass to the large intestine (Keim et al., 2006). Under normal conditions, most dietary and endogenous protein is absorbed (Mackie et al., 2010; Matthews, 2006). Digestion of proteins begins in the stomach by pepsin, when activated from pepsinogen by the acidic conditions given by HCl secreted in gastric juice (Klein et al., 2006). Most of proteolysis occurs in the small intestine (Klein et al., 2006), where protein digestion is continued by trypsin and chymotrypsin, which are present in the pancreatic fluids secreted into the duodenum (Dupont et al., 2010; Matthews, 2006; Versantvoort et al., 2004). Other enzymes in pancreatic juice (carboxypeptidase and elastase) and in the brush border (aminopeptidase and dipeptidase), produce dipeptides, tripeptides and
amino acids (Mackie et al., 2010; Norton et al., 2015; Versantvoort et al., 2004). Such proteolysis products are absorbed by active transport through the enterocytes, where hydrolysis of peptides is completed by cytosolic peptidases (Klein et al., 2006). Amino acids pass through portal circulation to the liver ultimately regulates their metabolism and flow into systemic circulation (Matthews, 2006).
2.2.1 Digestion of lipids
Due to the hydrophobic nature of lipids, different mechanisms than those for proteins and carbohydrates take place for digestion and absorption (Klein et al., 2006). Besides lipolysis (i.e. hydrolysis of ester bonds in triglycerides), a transport system through the intestinal medium enables absorption. These processes will be discussed in more detail in this section. Appendix B presents a short review on structure and nomenclature of glyceride-related lipids.
Triacylglycerols (TAG) represent around 95% of dietary lipids (Favé et al., 2007; Jones et al., 2006). The other lipids are a heterogeneous mix of more or less hydrophobic molecules like phospholipids, diacylglycerols (DAG), monoacylglycerols (MAG), free fatty acids, free cholesterol, cholesterol esters, lipid soluble pigments, lipid-soluble vitamins and other minor components (Favé et al., 2004; Jones et al., 2006). In the first place, lipids must be released from the food matrix by mechanical or enzymatic action so they can be accessible to lipases, which act on the surface of lipid droplets (Borel, 2003; Golding et al., 2010). Fat-soluble vitamins and minor lipophilic molecules also congregate in the fat droplets and follow the absorption paths of major dietary lipids (Borel, 2003; Machlin, 1984; Norman et al., 1984; Olson, 1984; Suttie, 1984).
2.2.1.1 Gastric digestion
Lipid components are dispersed as oil-in-water emulsified lipid droplets with diameters between 10 and 100 μm in the aqueous gastric medium (Mekki et al., 2002). Lipolysis starts in the stomach by human gastric lipase (HGL), secreted by
chief cells in the gastric mucosa (Klein et al., 2006). The enzyme is resistant to pepsin and it is not inactivated under the acidic conditions in the stomach (Klein et al., 2006). HGL is stable up to pH ≈ 2 and shows optimal activity between 4.5 and 6 (Favé et al., 2007; Sams et al., 2016; Stenson, 2006). Gastric lipase does not require a cofactor (cfr. human pancreatic lipase requires colipase to be effective) (Bodmer et al., 1987).
HGL acts preferentially on sn3-linked, and generally leads to hydrolysis of 10 to 30% of esterified fatty acids (Carriere et al., 1993; Favé et al., 2004; Favé et al., 2007). Hydrolysis extent by HGL from 5 to 40% has also been reported (Armand, 2007). Fatty acids (FA) are cleaved from the glycerol backbone according to their carbon-chain length. Short-chain fatty acids (SCFA) are preferentially hydrolyzed from TAG than longer ones (German, 2008). As lipolysis advances, protonated long-chain FA inhibit gastric lipolysis when they accumulate around the fat droplets and form vesicles that entrap the lipase and physically isolate it from its substrate (Favé et al., 2004). Small droplets (i.e. with a high interface area) delay such inhibition (Favé et al., 2004). HGL is resistant to pepsin, but sensitive to trypsin and chymotrypsin (Favé et al., 2007).
The release of amphiphilic lipid digestion products, combined to shear forces in the stomach and gastric emptying, facilitates the formation of an emulsified chyme that empties into the duodenum (Versantvoort et al., 2004). For this reason, lipid digestion in the stomach is a crucial step because it facilitates subsequent TAG hydrolysis by providing fatty acids that promote fat emulsification and increase the available lipid-water interface for pancreatic lipases (Borel et al., 1994b; Favé et al., 2004; Klein et al., 2006).
Gastric lipolysis is essential for newborns and individuals with pathologies that limit the secretion of lipases after the gastric passage (e.g. pancreatic insufficiency, cystic fibrosis, reduced hepato-biliary functions), individuals with special needs (e.g. pregnant and lactating women, elderly people), who could benefit from an enhanced lipid bioavailability (Armand, 2007; Armand et al., 1999; Borel et al., 1994b; Favé et al., 2004; Favé et al., 2007).
2.2.1.2 Intestinal digestion
Fat entering the duodenum consists of 70% TAG and a mixture of partially digested hydrolysis products (Jones et al., 2006). Bile salts are delivered to the duodenal lumen, where they aid in emulsifying fat (Jones et al., 2006). Hydrolysis continues in the duodenum, through the synergistic action of HGL, colipase-dependent human pancreatic lipase (HPL) and bile (Favé et al., 2004). Adsorption of the enzyme to the interface causes a conformational rearrangement, exposing the catalytic site of the enzyme (Golding et al., 2010). Bile salts inhibit HPL activity by desorbing it from the substrate interface, but colipase, an interfacial coenzyme, acts as an anchor for lipase at the lipid droplets so it can exert its lipolytic activity (Bauer et al., 2005; Borgström et al., 1982; Klein et al., 2006). To optimize lipolysis, colipase is required in a 1:1 molar ratio to lipase (Bezzine et al., 1999). Under normal digestion conditions, HPL is extremely rapid and lipolysis occurs faster than the depletion of reaction products from the water-fat interphase (Jones et al., 2006).
The main interfacial processes occurring during pancreatic lipolysis (Figure 3) are as follow:
• Pancreatic lipase binds to co-lipase to access the interface of emulsified fat (Figure 3, i and ii) (Golding et al., 2010).
• The interfacial structure of some surfactants can inhibit the adsorption of the co-lipase/pancreatic lipase complex (Figure 3, iii) (Golding et al., 2010). • Bile salts can remove such inhibitory surfactants from the interface via an
orogenic displacement mechanism (Figure 3, iv) (Golding et al., 2010). • As lipolysis proceeds, there is a buildup of 2-monoglycerides and free fatty
acids on the surface of the fat droplet, which can limit lipase adsorption. Bile salts have water soluble and lipid soluble portions, which assemble with the digested lipid products to remove them from the fat-water interface (Figure 3, v) (Golding et al., 2010; Klein et al., 2006). The formed structures are
called mixed micelles and they transport digestion products to the enterocyte border for absorption (Klein et al., 2006).
Figure 3. Interfacial processes occurring during pancreatic lipolysis at oil-water interface of fat droplets. Reproduced from Golding et al. (2010).
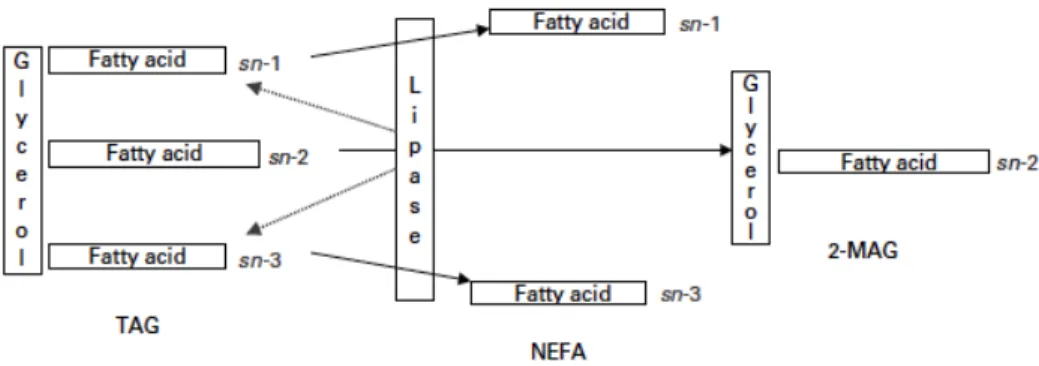
Hydrolysis of TAG by digestive lipases occurs on sn1 and sn3 fatty acids, yielding progressively sn1,sn2-DAG or sn2,sn3-DAG and finally FA and sn2-MAG (Carey et al., 1983) (Figure 4). When lipolysis is completed, each TAG yields 2 FA and 1 MAG (Berry et al., 2005). In the end, less than 5% of fat remains in the form of DAG and TAG (Favé et al., 2004). Fat digestion is very effective, and most ingested TAG are hydrolyzed to sn2-MAG and free FA within the first 100 cm of the jejunum (Klein et al., 2006).
Figure 4. Lipolysis of triacyglycerol (TAG) by digestive lipases, producing non-esterified fatty acids (NEFA) and sn-2 monoacylglycerols (2-MAG). Reproduced from Berry et al. (2005).
Phospholipids, most of which reach the gastrointestinal tract via biliary secretion (i.e. only small amounts are from dietary sources (Versantvoort et al., 2004)), are hydrolyzed by phospholipase A2 (PLA2) at the sn2 position into lysophospholipids and free FA (Favé et al., 2004). Alkaline sphingomyelinase hydrolyzes sphingomyeline (Duan, 2006; Duan et al., 2009). Cholesteryl esters are hydrolyzed
by pancreatic cholesterol-esterase lipase3 (CEL) (Favé et al., 2004). Esterified vitamins are also hydrolyzed by CEL to enable uptake (Borel, 2003). Some hydrolysis of sn2-MAG by CEL and PLA2 has also been reported (Sethi et al., 1993).
2.2.2 Absorption of lipids
Lipid absorption follows an intricate strategy to transport hydrophobic molecules through an aqueous medium and to transfer them to the absorption sites across an unstirred water layer at the surface of the intestinal microvillus membrane (Bauer et al., 2005; Klein et al., 2006). Daily intake of fat usually ranges from 50 to 150 g (Jones et al., 2006).
Overall, assimilation of lipid nutrients depends on the efficiency of lipolysis, with the activity of lipases being governed by the physicochemical properties of emulsions. In this sense, droplets of different size and composition are digested differently and, thus, are absorbed and metabolized differently (Borel et al., 1994a). Nonetheless, absorption effectiveness of TAG is higher than 95% (Sethi et al., 1993). Vitamins and other minor components have different absorption rates, but they are generally high and positively correlated to TAG absorption, since their uptake follows similar mechanisms (Borel, 2003).
There are two major macromolecular aggregates involved in lipid solubilization for absorption within the intestinal lumen (Armand, 1997; Favé et al., 2004; Woollett et al., 2006): The first are unilamellar vesicles (i.e. with only one phospholipid bilayer), spanning several hundred angstroms, containing phospholipids, long-chain fatty acids, monoglycerides, cholesterol and some bile acids (Klein et al., 2006). Unilamellar vesicles are an early product of lipolysis. They are mainly present in the duodenum, where they supply mixed micelles with lipolytic products to ensure their saturation, ensuring an optimal environment for lipid absorption (Christophe et
3 CEL (i.e. Cholesterol-esterase lipase) is also referred to under the following names: Carboxyl-esterase lipase, cholesterol lipase and bile-salt activated lipase (Bauer et al., 2005; Carey et al., 1983; Klein et al., 2006).