Within lab reproducibility, QC control data, blank subtraction
Quality control (QC) and blank charts were recorded over 6 weeks and over 2 weeks after a 6 months break. A very good control was observed on QC samples (Fig. 2) and slighly worst on blank samples (Fig. 3). For the latter, LOQ’s are defined with average blanks levels and they are acceptable outside the classical ±2sdev if they remain below the LOQ dashed line (+6sdev). We subtract from real samples an average blank value as soon as the blanks analyzed as control fall below the LOQ line. The variation below the LOQ level, and therefore the uncertainty on the ‘true’ blank value will be taken into account in the reported value and in the measurement uncertainty.
Measurement uncertainty
A top-down approach is used to assess measurement uncertainty. Fortified samples used for accuracy
test were used to determine the uncertainty on the bias (ubias) or systematic error, QC control data were
used to determine the contribution of precision (uRW) in the uncertainty following Eq. 1.
Eq. 1:
Validated GC-MS/MS confirmatory method for
the EU official control of levels of PCDD/Fs and
DL-PCBs in feed material of plant origin
L’Homme B., Scholl G., Eppe G., Focant J.-F.
CART, Organic and Biological Analytical Chemistry, Department of Chemistry, University of Liège, Belgium
Or
g
a
nic and Biological Analytical Chemistry Gr
oup
Introduction and strategyCriteria for sampling and analysis for the official control of dioxins (PCDD and PCDF) and dioxin-like (DL) PCB in feeding stuffs and certain foodstuffs are described in Commission Regulation (EU) No 709/2014 and No 589/2014. They allow the use of GC-QQQ as confirmatory method in addition to GC-HRMS.
We present a full validated method using the Agilent GC-QQQ 7000C instrument for the analysis of PCDD/Fs and DL-PCBs in vegetable oil (feed). We assessed individual analytical criteria specified in the above documents and checked that they meet the requirements. In this study we preferred observing performances of the QQQ (and their compliance with the Regulation), starting from basics, rather than simply comparing duplicated results on QQQ and HRMS. We therefore compiled results arising from different criteria and finally assessed the measurement uncertainty based on those.
Instrumentation & parameters
GC: Agilent 7890B GC equipped with a PTV injector and 7693A automated liquid sampler (ALS). Column: DB-5ms 60m x 250µm x 0.25µm
MS: Agilent 7000B series GC-QQQ with 7000C electron ionization (EI) source; ion source T=280°C; quads T=150°C; N2collision flow=1.5mL/min; He quench flow=2.25mL/min
Oven T program: 120°C (5min); 25°C/min until 250°C (5min); 3°C/min until 285°C (15min).
PTV: solvent vent mode; start at 40°C (3min) and ramp at 720°C/min until 320°C; vent flow=50mL/min (P=5psi) until 2.8min; purge flow=50mL/min at 5min.
Context
Context
Results and validation
Results and validation
Targets, sample preparation and method of analysis29 compounds were investigated including 7 PCDDs, 10 PCDFs, 4 ‘non-ortho’ (NO) PCBs, and 8 ‘mono-ortho’ (MO) PCBs. Pure vegetable oil (sunflower oil) was used as validation matrix. The clean-up is carried out on a Powerprep system using classical column set: mixed bed silica, alumina and carbon. Two fractions
are collected from the carbon column. Fraction A, eluted with
hexane/Dichloromethane, contains MO-PCBs and fraction B, eluted with toluene, contains PCDD/Fs and NO-PCBs. All analytes are quantified by isotopic dilution
against their own 13C labeled standard, spiked before clean-up. Recovery
(syringe) standards are spiked before injection and consist in13C
6-1,2,3,4-TCDD
(for tetra/penta dioxins and furans), 13C
12-1,2,3,4,7,8,9-HpCDF (for
hexa/hepta/octa dioxins and furans), and 13C
12-PCB80 (for PCBs). Each
compound is defined by a quantifier and a qualifier MRM transition whose collision energy (CE) has been optimized. Recovery experiments for accuracy and reproducibility tests are performed using fortified (with all congeners) sunflower oil.
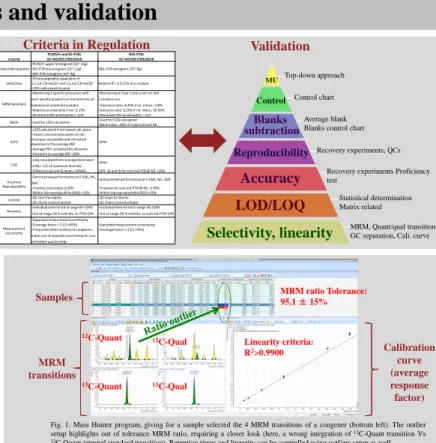
Selectivity, linearity
Control of 3 criteria to be verified during analysis: 1) retention time (RT) of targets must be within a +3s window from the internal standard. 2) MRM transition ratio (quant/qual), determined experimentally from standard injections, must be within the ±15% tolerance window. 3) Separation valley between HxCDF congeners must be <25% of peak height. Linearity is controlled from standards and is acceptable when calibration curve (built using average response
factors from 18 points (6 levels)) correlation coefficient (R2) is >0.9900. Example
of control is given in Fig. 1.
Limits of detection and quantitation
Instrumental limits of quantitation (iLOQ) must be calculated in a different way for GC-MS/MS. Unlike for GC-HRMS, signal-to-noise (S/N) ratio is not suitable to identify limits since it gives unrealistic values due to filtration of ions. We define the iLOQ, a ‘performance LOQ’ from the standard deviation associated to replicate injections of the lowest calibration point. The ‘real LOQ’ used in upperbound results is defined using replicate independent procedure blanks injections and is representative of the environment and sample preparation.
‘Performance’-iLOQ = 10*stdev (8 replicate injections of lowest cali. point)
‘Real’-LOQ = blank mean + 6*stdev (12 distinct blanks)
LOQ’s vary from 0.02 pg/g fat for 2,3,7,8-TCDD to 49.66 pg/g fat for PCB77 with a median of 0.10 pg/g fat for all congeners. The GC-HRMS method provides similar LOQ’s in the range 0.06-64.59 pg/g fat with a median of 0.10 respectively.
PhD funded by F.R.I.A (FNRS) at: OBiAChem, University of Liege, Belgium Allée du 6 Août, B6c, 4000 Liege, Belgium
Table 1: results for injections of 6 series of fortified vegetable oil in 3 days (2 series injected per day)
Table. 2: results of PT test (upperbound) in vegetable oil (2 different materials). All results were within the measurement uncertainty interval and Z-scores were 0.80 and 0.59 for materials 1 and 2 respectively.
Fig. 2: control chart of QC pork fat over 6 weeks + after 6 months break (black line). Red line is mean + 2 stdev (n=12)
Figure 4: control chart of blank samples. Red line is mean + 2 stdev (n=12). Dashed blue is LOQ defined as mean + 6 stdev.
PCDD/Fs and DL‐PCBs NDL‐PCBs Criteria GC‐MS/MS (709/2014) GC‐MS/MS (709/2014) Detectable quantity ‐PCDD/F upper femtogram (10^‐15g) NDL‐PCB nanogram (10^‐9g) ‐NO‐PCB low picogram (10^‐12g) ‐MO‐PCB nanogram (10^‐9g) Selectivity ‐Chromatographic separation of Relative RT ±0.25% IS vs analyte 1,2,3,4,7,8‐HxCDF and 1,2,3,6,7,8‐HxCDF <25% valley peak to peak MRM tansitions ‐Monitoring 2 specific precursors with ‐Monitoring at least 1 precursor ion and each specific product ion transition for all2 product ions labeled and unlabeled analytes ‐Tolerance ratio ±20% if rel. intens. >50% ‐Relative ion intensities max ±15% Tolerance ratio ±25% if rel. intens. 20‐50% ‐Resolution MS quadrupoles = unit ‐Resolution MS quadrupoles = unit
Blank ‐Used for LOQ calculation ‐Used for LOQ calculation‐Blank value <30% of maximul level ML iLOQ ‐iLOQ calculated from lowest cali. point ‐ditto ‐lowest concentration point on cali. must give acceptable and consistent deviation to the average RRF ‐Average RRF calculated for all points ‐Deviation to average RRF <30% LOQ ‐LOQ caluclated from average blank level ‐ditto ‐LOQ < 1/5 of maximum level ML ‐Difference ub and lb levels <20%ML ‐Diff. ub and lb for sum ind‐PCB @ ML <20% Accuracy Reproducibility ‐Demonstrate performances at 0.5ML, ML, ‐Demonstrate performances at 0.5ML, ML, 2ML 2ML ‐Trueness (accuracy) ±20% ‐Trueness for sum ind‐PCB @ ML ±30% ‐Within‐lab reproducibility (RSD) <15% ‐Within‐lab reproducibility (RSD) <20%
Control ‐QC chart for blanks ‐QC chart for blanks
‐QC charts control sample ‐QC charts control sample
Recovery ‐Individual internal std in range 60‐120%‐Out of range OK if contribu. to TEQ<10%‐Individual internal std in range 50‐120%‐Out of range OK if contribu. to sum ind‐PCB<10% Measurement uncertainty ‐Expanded measurement uncertainty ‐Coverage factor = 2 (CL=95%) ‐Expanded measurement uncertainty ‐If separate determination of congeners,‐Coverage factor = 2 (CL=95%) make sum of separate uncertainty for sum
of PCDD/F and DL‐PCBs
Selectivity, linearity
MRM, Quant/qual transitions GC separation, Cali. curve
LOD/LOQ
Statistical determinationMatrix relatedAccuracy
Recovery experiments Proficiency testReproducibility Recovery experiments, QCs
Blanks subtraction
Average blank Blanks control chart
Control Control chart MU Top-down approach
Criteria in Regulation
Validation
MRM ratio Tolerance: 95.1 ± 15% 12C-Quant 13C-Qual 13C-Quant 12C-Qual Samples MRM transitions Calibration curve (average response factor) Linearity criteria: R2>0.9900
Fig. 1: Mass Hunter program, giving for a sample selected the 4 MRM transitions of a congener (bottom left). The outlier setup highlights out of tolerance MRM ratio, requiring a closer look (here, a wrong integration of12C-Quant transition Vs 13C-Quant internal standard transition). Retention times and linearity can be controlled using outliers setup as well.
Accuracy and reproducibility
Six series of spiked materials at 0.5 maximum level (ML), ML, and 2ML were injected over 3 days (table 1). Bias and within lab reproducibility (RSD) are respectively <20% and <15% as required in the Regulation. Accuracy was also
tested during proficiency test (PT) on vegetable oil (Rikilt, 2013) (Table. 2). 19/923/926/930/93/107/1010/1014/1016/1021/1024/1018/0422/0405/0508/05
2 2.1 2.2 2.3 2.4 2.5 2.6 2.7 2.8 2.9 3 pg PCDD/ F−NO −PC B−WH O −TE Q /g Time Sum PCDD/F NO−PCB Mean + 2 * stdev Mean − 2 * stdev 23/926/930/93/107/1010/1014/1016/1021/1024/1024/1018/0422/0405/0508/05 0 0,02 0,04 0,06 0,08 0,10 0,12 pg PCDD/ F−NO −PC B−WH O −TE Q Blank injection Sum PCDD/F NO−PCB Mean + 2 * stdev Mean − 2 * stdev
LOQ = Mean + 6 * stdev Average blank subtraction
Uncertainty Benjamin L’Homme Office: +32 4 366 34 30 Cell: +32 496 08 42 54 Mail: [email protected] Connect on http://www.linkedin.com/in/benjaminlhomme Thanks to %U 2 %ubias 2 %u Rw
2 We determined a relative measurement uncertainty of 18.5% for the