Institut National de la Recherche Scientifique Centre Énergie, Matériaux et Télécommunications
GROWTH AND CHARACTERIZATION OF EPITAXIAL THIN FILMS
OF EPSILON FERRITE (ε-Fe2O3).
By Luca Corbellini
Thesis presented to obtain the degree of Philosophiae doctor (Ph.D.)
In Material Science
Evaluation Jury
Jury president and Emanuele Orgiu
Internal juror INRS, Centre EMT
External juror John T. Wei
Department of Physics University of Toronto
External juror Oussama Moutanabbir
Polytechnique Montreal
Supervisor Alain Pignolet
INRS, Centre EMT
Co-Supervisor David Ménard
Polytechnique Montreal
First of all, I would like to thank my advisor Professor Alain Pignolet and my co-supervisor Professor David Ménard, without whom my work at the Institut National de la Recherche Scientifique, centre Énergie, Matériaux et Télécommunications (INRS-EMT) and at Politechnique Montréal would not have been possible. This work would not have been feasible also without the support from the funding agencies NSERC (Natural Sciences and Engineering Research Council of Canada) and FRQNT (Fonds de Recherche du Québec - Nature et Technologies).
I would like to thank Professor Gianluigi Botton and Dr. Andreas Korinek of McMaster university for the amazing transmission electron microscope (TEM) images they provided.
Then I would like to thank Professor Chaker, Professor Legaré, Professor Ozaki and Professor Ruediger for their availability for scientific discussion and useful suggestions on pulsed laser deposition (PLD), second-harmonic phenomena, TeraHertz time domain spectroscopy (TDS), and Raman microscopy and general material science respectively.
A special thank to Dr. Christian Lacroix of Politechnique Montréal and Dr. Catalin Harnagea of INRS-EMT, for constantly engaging me in meaningful and fruitful discussions and teaching me the “secrets” of the vibrating sample magnetometer (VSM) and of the scanning probe microscope (SPM). I would also acknowledge Dr. Xavier Ropagnol for his help with the time domain spectroscopy (TDS) measurements. I would like to thank the members of Ferroic-Lab, Alì, Julien, Liliana and Thameur, with whom I shared the most part of my time in Varennes, for their constant help and availability to discuss scientific and everyday life topics.
A special thank to Cristophe Chabanier and Etienne Charette, who always showed great patience in training me first, and then help me with many different instruments and techniques I widely used during my doctorate.
I would like to thank my friends Andrea, Artiom, Daniele, Fabrizio, Gianluca, Luis, Piotr, Raffaello, Riccardo, Riccardo and Yohann, who always brought joy and lightheartedness to every lunch break at INRS.
and availability, along with the other members of the jury, Professor John T. Wei of University of Toronto and Professor Oussama Moutanabbir of Polytechnique Montreal, for accepting to evaluate my thesis and for their comments and corrections.
Epsilon ferrite (ε-Fe2O3) is a metastable phase of iron(III) oxide, intermediate between maghemite (γ-Fe2O3) and hematite (α-Fe2O3). ε-Fe2O3 has been investigated essentially because of its magnetic properties, in particular its strong magnetocrystalline anisotropy which results in a gigantic coercive field, as high as 2T for nanoparticles, with a Curie temperature of circa 500 K. Given its crystal structure belonging to the polar space group Pna21, it should exhibit pyroelectric, and possibly ferroelectric behavior, potentially making it one of the few single phase room temperature multiferroic materials. Moreover, the material anisotropy also results in a natural ferromagnetic resonance (FMR) frequency in the low THz range. This is of particular interest given its potential use in short-range wireless communications (e.g. 60GHz Wi-Fi) and ultrafast computer non-volatile memories.
To overcome its metastable nature, stabilization of ε-Fe2O3 has been obtained mainly by synthesizing it by sol-gel as nanoparticles embedded inside a SiO2 matrix. Recently however, deposition of epitaxial thin films of ε-Fe2O3 was demonstrated, with the growth occurring directly, on SrTiO3, as well as, with the use of a buffer layer, on YSZ and Al2O3. The ability of depositing high-quality epitaxial thin films of ε-Fe2O3 is a key feature for their development towards integrated devices.
In this thesis, the growth by Pulsed Laser Deposition of epitaxial thin films of pure and Al substituted ε-Fe2O3 on different single crystal substrates, such as SrTiO3, LaAlO3, LSAT, and YSZ, is reported, and the influence of the chosen substrate and of the aluminum doping on the structural and functional properties of ε-Fe2O3 is discussed. Detailed structural characterization performed by x-ray diffraction and transmission electron microscopy highlighted the differences resulting from growing epsilon ferrite on the diverse substrates, in particular the formation of twins with orientation depending on the choice of substrate. Magnetic characterization confirmed the high magnetocrystalline anisotropy of our film and revealed the presence of a secondary phase which was identified as the well-known magnetite (Fe3O4). Angular analysis of the magnetic properties revealed how their azimuthal dependence reflects the angular geometry of the twins. Aluminum insertion inside the ε-Fe2O3 lattice was also achieved, resulting in the ability to modify the coercive field and the magnetization at saturation by controlling the aluminum substitution into the film. Finally, depositions over vicinal STO and YSZ substrates have been performed to overcome the formation of twins, which might represent a fundamental advance given how some applications, e.g. non-volatile memories, require films of materials characterized by a single magnetic easy axis, thus twin-free, in order to be implemented into devices.
Keywords: thin films, epitaxy, pulsed laser deposition, iron oxide, multifunctional oxides, magnetism, ferroelectricity, multiferroic, ferromagnetic resonance.
L’oxyde ferrique epsilon (ε-Fe2O3) est une phase métastable de l'oxyde de fer(III), intermédiaire entre la maghemite (γ-Fe2O3) et l'hématite (α-Fe2O3). ε-Fe2O3 a été étudié essentiellement en raison de ses propriétés magnétiques, en particulier sa forte anisotropie magnétocristalline qui a pour conséquence un champ coercitif gigantesque pouvant atteindre 2T pour les nanoparticules, avec une température de Curie d'environ 500 K. Compte tenu de sa structure cristalline appartenant au groupe d'espaces polaires Pna21, il doit présenter un comportement pyroélectrique et possiblement ferroélectrique, ce qui en ferait l'un des rares matériaux monophasés multiferroïques à température ambiante. En outre, son anisotropie magnétocristalline géante résulte également en une fréquence de résonance ferromagnétique naturelle (FMR) dans la gamme des bas THz. Ceci est particulièrement intéressant compte tenu de son utilisation potentielle dans les communications sans fil à courte portée (par exemple 60 GHz Wi-Fi) et les mémoires non volatiles ultra-rapides.
Pour surmonter sa nature métastable, la stabilisation de ε-Fe2O3 a été obtenue principalement en le synthétisant par sol-gel en tant que nanoparticules incorporées dans une matrice de SiO2. Récemment cependant, le dépôt de couches minces épitaxiales de ε-Fe2O3 a été démontré, soit directement sur SrTiO3, soit, avec l'utilisation d'une couche tampon, sur YSZ et Al2O3. La capacité de déposer une couche mince épitaxiée de ε-Fe2O3 de haute qualité est une caractéristique clé pour son application potentielle à des dispositifs intégrés.
Dans ce manuscrit, le dépôt par ablation laser pulsé de couches minces épitaxiales de ε-Fe2O3 pur et dopé avec de l’aluminium sur différents substrats monocristallins, tels que SrTiO3, LaAlO3, LSAT et YSZ est décrit, et l'influence du substrat choisi et du dopage d'aluminium sur les propriétés structurelles et fonctionnelles est discuté. La caractérisation structurale détaillée réalisée par diffraction de rayons X et microscopie électronique à transmission, a mis en évidence les différences résultant de la croissance de ε-Fe2O3 sur les divers substrats, en particulier la formation de macles avec diverses orientations selon le choix du substrat. La caractérisation magnétique a confirmé l'anisotropie magnétocristalline élevée de nos films et a révélé la présence d'une phase secondaire qui a été identifiée comme étant de magnétite (Fe3O4). L'analyse angulaire des propriétés magnétiques a révélé comment la présence de macle affecte leur dépendance azimutale. L'insertion d'aluminium dans le réseau ε-Fe2O3 a également été réalisée, ce qui a permis de contrôler le champ coercitif et l'aimantation à saturation en fonction du pourcentage d'aluminium. Enfin, des dépôts sur des substrats STO et YSZ monocristallin avec un « miscut » ont été effectués pour prévenir la formation de macles, ce qui pourrait représenter une avance fondamentale compte tenu de la façon dont les applications, par exemple les mémoires non-volatiles, nécessitent des couches cristallines sans macles pour pouvoir être mises en œuvre dans des dispositifs.
Mots-clés: couches minces, épitaxie, ablation laser pulsé, oxyde de fer, oxydes multifonctionnels, magnétisme, ferroélectricité, multiferroïque, résonance ferromagnétique.
INTRODUCTION ... 1
CHAPTER 1 THEORETICAL BACKGROUND ... 11
1.1 STRUCTURE AND PROPERTIES OF EPSILON FERRITE. ... 11
1.2 BRIEF DISCUSSION ON MAGNETISM. ... 13
1.2.1 Magnetic interactions and classes of magnetic materials. ... 13
1.2.2 The magnetic hysteresis. ... 16
1.2.3 Ferromagnetic Resonance Frequency. ... 19
1.3 FERROELECTRICITY AND MULTIFERROICITY. ... 21
1.3.1 Phenomenological description of ferroelectricity. ... 21
1.3.2 Multiferroicity. ... 23
EXPERIMENTAL TECHNIQUES... 25
2.1 SYNTHESIS OF EPITAXIAL THIN FILMS OF EPSILON FERRITE BY PULSED LASER DEPOSITION. ... 26
2.1.1 Fundamentals on pulsed laser deposition. ... 26
2.1.2 Growth mode at thermodynamic equilibrium. ... 30
2.1.3 Homoepitaxial growth modes. ... 37
2.1.4 Pulsed Laser Interval Deposition. ... 38
2.1.5 Heteroepitaxy. ... 38
2.1.6 Pulsed Laser Deposition Experimental Setup setup. ... 42
2.2 CHARACTERIZATION OF EPSILON FERRITE THIN FILMS. ... 44
2.2.1 Characterization of the crystal structure via x-ray diffractometry. ... 44
2.2.2 Transmission Electron Microscopy. ... 46
2.2.3 Thickness. ... 47
2.2.4 Macroscopic Magnetic Characterization. ... 47
2.2.5 Macroscopic Ferroelectric Characterization. ... 50
2.2.6 Surface topology and microscopic characterization of magnetism and ferroelectricity via scanning probe microscopy (SPM)... 52
2.2.7 Direct and indirect measurement of the ferromagnetic resonance spectroscopy. ... 52
GROWTH OF EPITAXIAL THIN FILMS OF EPSILON FERRITE ... 55
3.1 EPITAXIAL STABILIZATION OF EPSILON FERRITE THIN FILM. ... 56
3.2 STRUCTURAL CHARACTERIZATION OF EPSILON FERRITE THIN FILMS. ... 65
3.2.1 Confirmation of epitaxial growth. ... 65
3.2.2 Graphical representation of twins. ... 73
3.2.3 Mosaicity effects. ... 74
3.2.4 Rocking curve analysis. ... 76
3.2.5 Structural characterization via transmission electron microscopy. ... 78
3.3 CONCLUSIONS... 82
FUNCTIONAL CHARACTERIZATION OF EPSILON FERRITE THIN FILMS ... 83
4.1 MAGNETIC CHARACTERIZATION OF THE EPSILON FERRITE THIN FILMS. ... 84
4.1.1 Magnetic hysteresis and temperature dependent measurements. ... 84
4.1.2 Angle dependent measurements. ... 95
4.1.3 Microscopic magnetic characterization via magnetic force microscopy. ... 100
4.2 FERROELECTRIC CHARACTERIZATION OF EPSILON FERRITE THIN FILMS. ... 101
4.3 DIRECT AND INDIRECT MEASUREMENT OF THE FERROMAGNETIC RESONANCE FREQUENCY. ... 104
4.4 CONCLUSIONS... 107
GROWTH AND CHARACTERIZATION OF ALUMINUM-SUBSTITUTED EPSILON FERRITE THIN FILMS ... 109
5.1 GROWTH AND STRUCTURAL CHARACTERIZATION OF AL-SUBSTITUTED EPSILON FERRITE THIN FILMS. ... 110
5.2 THE EFFECT OF ALUMINUM SUBSTITUTION ON THE MAGNETIC PROPERTIES. ... 112
5.3 THE EFFECT OF ALUMINUM SUBSTITUTION ON THE FERROELECTRIC PROPERTIES. ... 114
5.4 CONCLUSIONS... 114
THE DEPOSITION ON MISCUT SUBSTRATES. ... 115
6.1 GROWTH OF EPSILON FERRITE THIN FILMS ON MISCUT SUBSTRATES. ... 117
6.2 STRUCTURAL CHARACTERIZATION OF EPSILON FERRITE THIN FILMS ON MISCUT SUBSTRATES. ... 117
6.3 MAGNETIC CHARACTERIZATION OF EPSILON FERRITE THIN FILMS ON MISCUT SUBSTRATES. ... 123
6.4 CONCLUSIONS... 125
GENERAL CONCLUSIONS AND PERSPECTIVES. ... 127
7.1 GENERAL CONCLUSIONS ... 127
7.2 PERSPECTIVES ... 131
SYNOPSYS IN FRENCH... 133
FERROIC MATERIALS. ... 169
I.1 SEPARATING THE DIFFERENT CONTRIBUTIONS TO THE MEASURED HYSTERESIS LOOPS ... 171
I.2 VALIDATION OF THE TECHNIQUE ... 173
Figure 1: (a) hematite, (b) magnetite, (c) maghemite, and (d) wüstite minerals. ____________________________ 2 Figure 2: Some of the different applications in which iron oxides are utilized (adapted from 2). ________________ 3
Figure 3: The structures of the three most investigated iron oxides, (a) hematite, (b) magnetite, and (c) maghemite. 4 Figure 4: ε-Fe2O3 has an intermediate structure, characterized by oxygen octahedra like maghemite, and by
alternating oxygen/iron layers like in hematite. ______________________________________________________ 5
Figure 5: ε-Fe2O3 unit cell and configuration of the magnetic moments on the four different iron sites. _________ 11
Figure 6: Antiferromagnetic order due to superexchange in magnesium oxide. ____________________________ 15 Figure 7: The different kind of magnetic orders – (a) ferromagnetic, (b) antiferromagnetic, and (c) ferrimagnetic
order. _____________________________________________________________________________________ 16
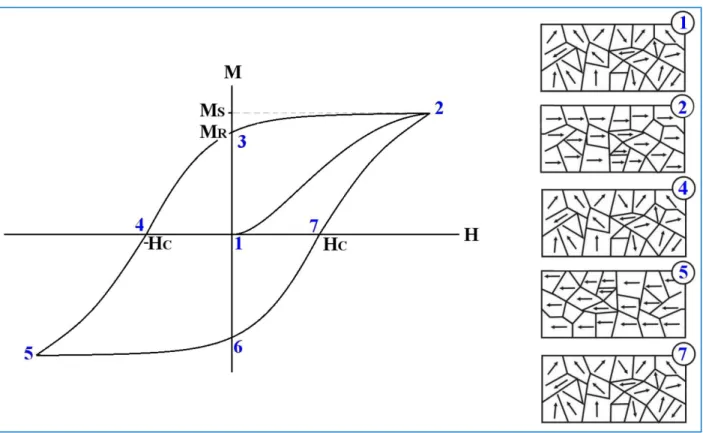
Figure 8: Typical magnetic hysteresis loop and behavior of the moments in the different domains in response to the
applied field. ________________________________________________________________________________ 17
Figure 9: Fine splitting giving source to the ferromagnetic resonance frequency in materials: on the right, the case
of a material with high magnetocrystalline anisotropy is depicted. ______________________________________ 20
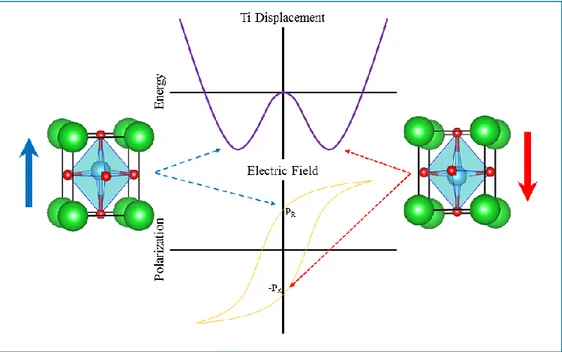
Figure 10: Ferroelectric and paraelectric structure for barium titanate beyond and above the Curie temperature. 22 Figure 11: Double well potential representing the movement of the Ti ion during the switch of the polarization in
BatTiO3. ___________________________________________________________________________________ 22
Figure 12: The different sets and subsets of the ferro-, pyro-, and piezoelectric materials. ___________________ 23 Figure 13: The three class of ferroic materials, separated by their order parameters M, P and ε, and the different
coupling possible. In the figure, the two magnetoelectric couplings – i.e. the control of polarization by a magnetic field and of magnetization by an electric field – are shown by the green arrows. ___________________________ 24
Figure 14: Typical plasma plume in PLD. _________________________________________________________ 27 Figure 15: Film growth modes: (a) Layer by layer - Frank-Van der Merwe. (b) Island - Volmer-Weber. (c)
Stranski-Krastanov. (d) Step flow. ______________________________________________________________________ 31
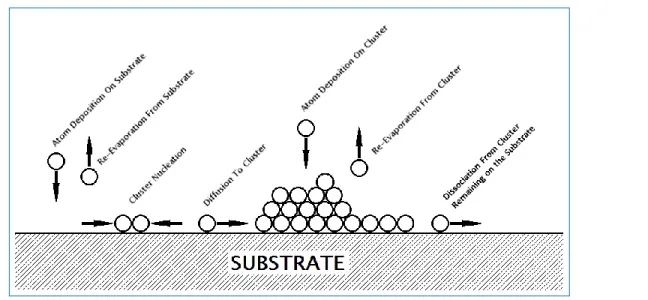
Figure 16: Schematic diagram of atomic processes in the nucleation of three dimensional clusters of deposited film
atoms on a substrate surface. ___________________________________________________________________ 32
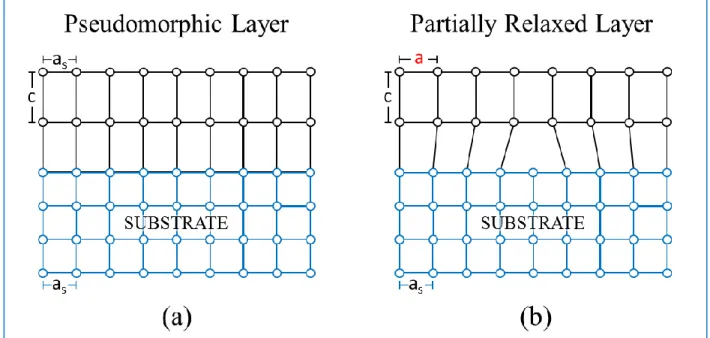
Figure 17: (a) Pseudomorphic and (b) relaxed growth of a cubic epitaxial film on a slightly mismatched cubic
substrate. __________________________________________________________________________________ 40
Figure 18: (a) Typical PLD setup and (b) schematic of a PLD chamber. _________________________________ 42 Figure 19: Graphical representation of Bragg's law. ________________________________________________ 44 Figure 20: The different angles that can be adjusted with high precision during a XRD measurement. The sample is
portrayed in blue. ____________________________________________________________________________ 45
Figure 21: (a) schematics of the Vibrating Sample Magnetometer (VSM) and (b) in-plane (left) and out-of-plane
(right) configuration of the sample in the VSM. _____________________________________________________ 48
field HAC of the cavity is applied parallel to the rod and perpendicular to the static magnetic field H0. __________ 53
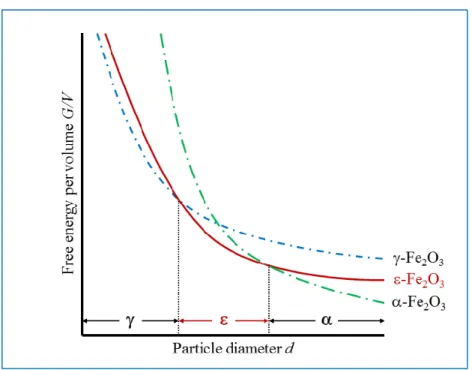
Figure 24: Free energy per volume versus particle diameter in iron oxide (adapted from 40). ________________ 56 Figure 25: Graphical representation of the (111) plane of cubic perovskites (in light blue) and the epitaxial relation
with the epsilon ferrite unit cell. To be noted, the orientation of the substrate (bottom left corner) and on the film (middle right). _______________________________________________________________________________ 57
Figure 26: Graphical representation of the (100) plane of YSZ (in pink) and the two epitaxial matches between
ε-Fe2O3 (001) and YSZ (100), (a) “parallel” match and (b) “non-parallel” match. To be noted: the same orientation
of the two lattices in the “parallel” case and the presence of a rotation in the “non-parallel” one. ____________ 59
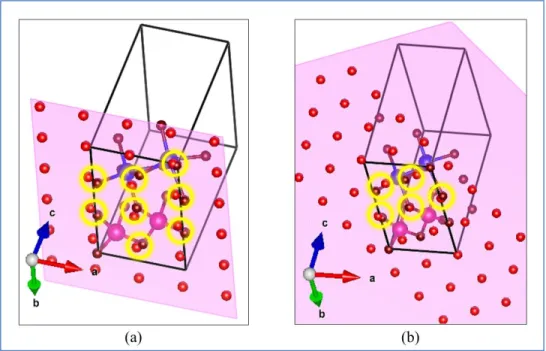
Figure 27: Graphical representation of the good match of the oxygen polyhedra framework in the epsilon ferrite
grown film and in the underlying (111)-oriented perovskite substrate. ___________________________________ 60
Figure 28: Graphical representation of the continuity of the oxygen polyhedra framework in epsilon ferrite grown
on (100)-oriented YSZ. The continuity in the case of the “parallel” epitaxial match (a) seems, from the graphical representation, to be better than for the “non-parallel”, although, in both cases, it is not as good as for the case of epsilon ferrite grown on perovskites (111). ________________________________________________________ 61
Figure 29: Optimal deposition temperature and pressure (star), and deposition window (in green) for thin films of
epsilon ferrite. The area drawn in yellow depicts the condition for which extra magnetite was grown, while the areas in red are either non accessible with the utilized experimental setup or do not yield to the growth of epitaxial thin films. ______________________________________________________________________________________ 64
Figure 30: X-ray diffractogram for (001)-oriented thin films of epsilon ferrite grown on STO (111) (green line),
LSAT (111) (red line), LAO (111) (blue line), and YSZ (100) (orange line). The peaks belonging to the film are the one of lower intensity marked in the top diffractogram and labeled with the corresponding index. The peaks
belonging to the substrates are the high intensity ones marked with red dots in the two top sections. ___________ 66
Figure 31: Diffractogram for a thin film of ε-Fe2O3 (001) grown on STO (111). In red the peaks belonging to highly
constraint magnetite are noted. Note also the secondary peaks arising from the substrate (marked in red). ______ 67
Figure 32: Detail of the 004 peak for thin films of epsilon ferrite grown on different substrates (same color code as
Figure 30). Note how the position of the peak does not change with the different substrates. __________________ 68
Figure 33: Phi scans for the 013 peak of epsilon ferrite when grown on (111)-oriented perovskites (left) and
(100)-oriented YSZ (right), along with the scan of peaks belonging to the substrates, in order to infer the mutual
orientation between the films and the substrates. ____________________________________________________ 69
Figure 34: Phi scans for the 013 peak of epsilon ferrite thin films grown on different substrates: from the top left
clockwise, on YSZ (100) (orange), STO (111) (green), LAO (111) (blue), and LSAT (111) (red). _______________ 70
Figure 35: θ/2θ scan around the peaks associated with the (013) and the (132) planes of epsilon ferrite. The two
green) and YSZ (100) (bottom – orange) plotted along the phi scan of the 132 peaks of the interstitial domains, along with the separation between them. __________________________________________________________ 72
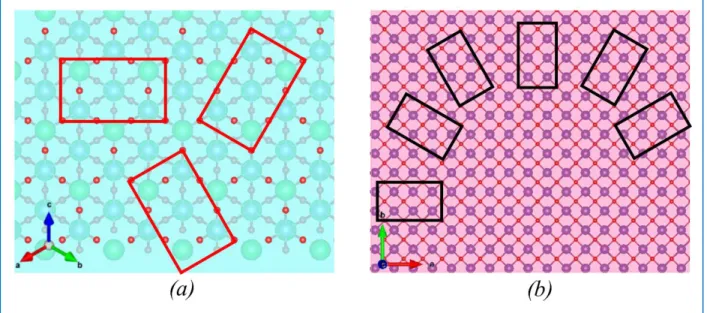
Figure 37: Graphical representation of the different growth orientations possible on (a) (111)-oriented perovskites,
and (b) (100)-oriented YSZ. ____________________________________________________________________ 73
Figure 38: Graphical representation of mosaicity in one particular growth domain in a crystal. Such mosaicity
effect can affect both plane parallel to the surface of the sample and perpendicular to it. In the first case, mosaicity will be studied with rocking curve measurements, in the second with Phi-scans. ___________________________ 74
Figure 39: Dispersion in the angular dependence of the 013 peak for epsilon ferrite films: the experimental data are
shown as symbols, while the Gaussian fit is represented by the black line. From the top left clockwise, on YSZ (100) (orange), STO (111) (green), LAO (111) (blue), and LSAT (111) (red). __________________________________ 75
Figure 40: Rocking curve measurements for the 004 peak for epsilon ferrite films: the experimental data are shown
as symbols, while the Lorentzian fit is represented by the black line. From the top left clockwise, on YSZ (100) (orange), STO (111) (green), LAO (111) (blue), and LSAT (111) (red). __________________________________ 77
Figure 41: (a) STEM image of a circa 120 nm thick film of epsilon ferrite grown on STO (111), highlighting the
formation of twins, denoted by the areas with different contrast, separated by randomly oriented boundaries (as noted by the red lines), (b) detail of the interface between the substrate and the film, showing the really sharp interface between (111)-oriented strontium titanate and epsilon ferrite. Below: (1st from the left) graphical
simulation of the interface between STO (111) and epsilon ferrite, portraying the same orientation as STO seen in the TEM image. (2nd from left) top view of the epsilon ferrite twins, with the same orientation kept for the substrate,
highlighting (in red) the only detectable orientation, which is magnified in the light blue selected area (3rd from left)
which is portrayed next to the simulated ε-Fe2O3 structure rotated according to the proposed epitaxy relationship
(4th from left). _______________________________________________________________________________ 80
Figure 42: (a) STEM image of a circa 100 nm thick film of ε-Fe2O3 on YSZ (100) highlighting the formation of
pillar-like twins, (b) detail of the interface between the substrate and the film, evidencing the formation of ‘bubbles’ of a foreign phase (most likely Fe3O4) at the interface. Below: high-magnification of the 4 colored selected areas
overlapped with simulated ε-Fe2O3 structures rotated according to the proposed epitaxy relationships to further
prove the existence of different growth domains with different in-plane orientations. If the orientation in the red box, with the b axis pointing out-of-plane is taken as 0°, the unit cells depicted in the other boxes are rotated,
respectively by 300° (green), and 120° (light blue) (note that the 2 last unit cells (green) and (light blue) have a 180° rotational symmetry). No match was found for the yellow selection, probably due to the overlap of two different growth domains in the depth of the sample and overlapping in the STEM image. ___________________________ 81
Figure 43: Hysteresis loops recorded in-plane for thin films of epsilon ferrite of various thickness deposited on the
four substrates that grant epitaxial growth (same color code as XRD measurements). _______________________ 84
Figure 44: Estimation of the anisotropy field (the point of intersection of the linearization of the saturation part of
field of 1000 Oe (red dots/line) versus temperature for an epsilon ferrite thin film. _________________________ 87
Figure 46: The complex plot of magnetization versus temperature of an epsilon ferrite epitaxial film for
temperatures spanning 300 to 900 K. _____________________________________________________________ 88
Figure 47: Plot of the dependence of the magnetization versus temperature measured under an applied field of 1000
Oe, for increasing (red – same curve shown above with different scale) and decreasing (blue) temperature. _____ 89
Figure 48: Hysteresis in-plane measured before (left) and after (right) the involuntarily induced phase transition,
along with the passage used to estimate the new magnetic moment and the value experimentally measured. _____ 90
Figure 49: Practical application of the D-D-SI technique to separate the contributions of the two phases to the
measured magnetic moment in an epsilon ferrite thin film deposited on YSZ (100). _________________________ 92
Figure 50: Graph of the magnetization (in SI units) for the epsilon and the magnetite phase in a thin film of epsilon
ferrite. _____________________________________________________________________________________ 93
Figure 51: Hysteresis in plane for two thin films of epsilon ferrite grown on YSZ (100) (orange line) and STO (111)
(green line). ________________________________________________________________________________ 94
Figure 52: Plot of the angular evolution of the coercive field, relative to 0°, measured for a film of epsilon ferrite
grown on STO (111). _________________________________________________________________________ 96
Figure 53: Polar plot of the evolution of the measured MR versus angle (green diamonds) and of the fitted curve
(red line) for a sample of epsilon ferrite grown on STO (111). _________________________________________ 98
Figure 54: Polar plot of the evolution of the measured MR versus angle (red dots) and of the fitted curve (blue line)
for a sample of epsilon ferrite grown on YSZ (100). __________________________________________________ 99
Figure 55: Topography (left) and magnetic contrast (right) measured for a thin film of epsilon ferrite. ________ 100 Figure 56: Schematics of the sample structure for ferroelectric characterization: the epsilon ferrite thin film is
depicted in red, while the platinum electrodes are drawn, magnified, in silver. ___________________________ 101
Figure 57: Polarization and Current vs cyclic voltage plot for a thin film of epsilon ferrite grown on Nb-STO (111),
recorded at a driving frequency of (a) 100 Hz and (b) 2KHz. _________________________________________ 102
Figure 58: PFM signal as measured (black dots and red line), and without the linear electrostatic response
(magenta line), and PFM amplitude and phase (right); the recorded signals hint to the presence of a non-switchable polarization (see the magenta line in the PFM signal). ______________________________________________ 103
Figure 59: Field sweep with frequency set at 24GHz for thin films of aluminum ferrite (top green) and epsilon
ferrite (middle red) grow on YSZ (100), along with the signal from the bare substrate (blue bottom). __________ 105
Figure 60: Amplitude of a THz pulse transmitted through an epsilon ferrite thin film grow on YSZ (100) (orange
line), and through a YSZ (100) bare substrate (red line), showing absorption in the 0.1-0.15 THz (100-150 GHz) range. ____________________________________________________________________________________ 106
thin film, and (b), In-plane (blue) and out-of-plane (red) hysteresis loop measured for a ε-Al0.1Fe1.9O3 epitaxial thin
film, both grown on YSZ (100). In both cases we can infer the high magnetic anisotropy of the two samples. ____ 112
Figure 63: (a) Dependence of the magnetization (M) on the temperature for a ε-Al0.1Fe1.9O3 thin film grown on YSZ
(100), recorded under a field of 1000 Oersted applied in -plane. (b) Evolution of the coercive field HC and (c) of the
magnetization at saturation MS in function of the aluminum concentration “x”. __________________________ 113
Figure 64: The magnetic easy axis that arise due to the different epitaxial matches and twinning in thin films of
epsilon ferrite grown on (111)-oriented perovskites (left) and on (100)-oriented YSZ (right). ________________ 115
Figure 65: Graphical representation of a section of a (100)-oriented YSZ substrate with a miscut of circa 15° and
terraces 19 Å wide. _________________________________________________________________________ 116
Figure 66: STEM picture for 50 nm films of epsilon ferrite grown on (a) STO (111) 5° miscut and (b) on YSZ (100)
5° miscut. As was observed for films grown on regular substrates, growth on STO (111) results in sharper interfaces than growth on YSZ (100). (c) Goniometer scan (2θ) of the films shown in the STEM images, revealing that the films grows along the same (001) direction as when grown on regular substrates. The peaks labeled by pound (#) and asterisk (*) belong respectively to the STO (111) and YSZ (100) substrates. ______________________________ 118 Figure 67: Goniometer scan of 50 nm thick epsilon ferrite epitaxial thin films grown on STO (111) (left) and YSZ (100) right, with increasing degree of miscut. As it was the case for epsilon ferrite thin films grown on regular substrates, the films are (001)-oriented. __________________________________________________________ 119
Figure 68: Phi scans of the (013) planes for 50 nm thick films of epsilon ferrite grown on STO (111) (left) and YSZ
(100) (right) thin films with increasing miscut (0° - 5° - 10°- 15° - 20°). The reduction of the multiplicity of the peaks hints to a reduction of the growth orientations. It has to be noted how higher degrees of miscut (higher than 10°) lead to the formation of new growth orientations, highlighted by red circles, given the novel angular distribution of the peaks that was detected. Finally, the two main peaks detected for thin films grown on YSZ (100) miscut 20° circled in violet belong to the substrate and not the film. _____________________________________________ 120
Figure 69: STEM image of the interface between a STO (111) 5° miscut substrate and the epitaxial thin film of
epsilon ferrite grown on top of it. Note how one growth domain, which boundaries (blue lines), extends over several step edges of the substrate (violet lines). In the two boxes, magnification of two areas picturing two different twins, overlapped with graphical simulation of the unit cell of epsilon ferrite. _________________________________ 121
Figure 70: STEM image of the interface between a YSZ (100) 5° miscut substrate and the epitaxial thin film of
epsilon ferrite grown on top of it. In the two boxes, magnification of two areas picturing two different twins, overlapped with graphical simulation of the epsilon ferrite unit cell. ___________________________________ 122
Figure 71: Magnetic hysteresis in-plane and out-of-plane measured for two 50 nm thick thin films of epsilon ferrite
grown on 5° miscut STO (111) (a) and YSZ (100) (b). _______________________________________________ 123
Figure 72: Evolution of the remanent magnetization in thin films of epsilon ferrite grown on STO (111) (a) and YSZ
(100) (b) with increasing degree of miscut. The measurements hint to an increase in “global” anisotropy for films grown on substrates with miscut higher than 10°, as shown by the decrease in the number of local maxima and the
(111) des perovskites et, (c) et (d), les deux correspondances pour la surface (100) de YSZ. _________________ 140
Figure 74: Représentation graphique de la continuité du réseau de polyèdres d'oxygène de films d’ε-Fe2O3 déposés
sur (a) des perovskites orientées (111) et (b et c) du YSZ orienté (100). La continuité dans le cas de la relation d’épitaxie "parallèle" YSZ (100) semble, à partir de la représentation graphique, être meilleure que pour la relation d’épitaxie "non parallèle" (c). Il faut note cependant que la correspondance dans les cas (b) et (c) n’est pas aussi bonne que dans le cas d'ε-Fe2O3 déposé sur des perovskites orientées (111). _____________________________ 142
Figure 75: Détail du pic de diffraction 004 pour des films minces de ε-Fe2O3 déposés sur des substrats différents. À
Noter: la position du pic ne change pas avec les différents substrats. ___________________________________ 143
Figure 76: (a) Analyse Phi scan pour le pic 013 de ε-Fe2O3 lorsqu'il est déposé sur des perovskites orientées (111)
(à gauche) et sur et sur YSZ (100) (à droite), ainsi que les pour les pics 110 et 221 des substrats pérovskite, e des pics 220 des substrats de YSZ, afin de déterminer l'orientation mutuelle entre les films et les substrats. (b) Les mêmes phi-scans pour les pics 013 de ε-Fe2O3 sur les différents substrats qui assurent une croissance épitaxiale: de
en haut à gauche dans le sens des aiguilles d'une montre, sur STO (111) (vert), YSZ (100) (orange), LSAT (111) (rouge) et LAO (111) (bleu). ___________________________________________________________________ 145
Figure 77: (Planche de gauche) Dispersion de la dépendance angulaire du pic 013 pour les films de ε-Fe2O3: les
données expérimentales sont présentées sous forme de symboles discrets, tandis que le fit Gaussien est représenté par la ligne noire continue. En haut à gauche dans le sens des aiguilles d'une montre, dépendance angulaire du pic 013 de ε-Fe2O3 déposé sur YSZ (100), STO (111), LAO (111) et LSAT (111). (Planche de droite) Mesures « rocking
curve » pour le pic 004 des films de ε-Fe2O3: les données expérimentales sont présentées sous forme de symboles
discrets, tandis que l'ajustement de Lorentz est représenté par la ligne continue noire. En haut à gauche dans le sens des aiguilles d'une montre, pic 004 des films de ε-Fe2O3 déposés sur YSZ (100), STO (111), LAO (111) et LSAT
(111). ____________________________________________________________________________________ 147
Figure 78: (a) Image STEM d'un film d'une épaisseur d’environ 125nm de ε-Fe2O3 sur STO (111) et (b) sur YSZ
(100) mettant en évidence la différence de l'épaisseur de la couche tampon - quelques angströms dans le premier cas , plusieurs nanomètres dans le second - et la différence de morphologie des « twins » - désordonnés pour les films déposés sur STO, et en forme de pilier régulier pour les films déposés sur YSZ. ______________________ 149
Figure 79: (a) Dépendance de l'aimantation d’une couche mince ε-Fe2O3 déposée sur YSZ (100) avec le champ
magnétique appliqué dans le plan de l'échantillon (symboles bleus) et hors du plan de l'échantillon (symboles verts), montrant l'anisotropie magnétique de ε-Fe2O3. (b) Graphe de M en fonction de T mesuré sous champ nul (bleu) et
sous un faible champ magnétique appliqué de 1000 Oe (rouge), montrant que M ne disparaît pas pour une température supérieure à la température de Curie de ε-Fe2O3 de 460 K lorsqu'un un faible champ magnétique est
appliqué, révélant la présence d'une phase ‘parasite’ correspondant à un matériau magnétique doux ayantun TC plus élevé et ayant été assignée à une petite quantité de Fe3O4. (c) Mesure de M-H corrigée où les contributions du
Table 1: Lattice mismatch on the in-plane lattice parameters for the three (111)-oriented cubic perovskites. _____ 58 Table 2: Lattice mismatch on the in-plane lattice parameters for the two relation in (100)-oriented YSZ. ________ 59 Table 3: Thermal expansion coefficients for the different substrates (in red the ones that grant epitaxial growth). _ 62 Table 4: Lattice parameters found for epsilon ferrite epitaxial thin films grown on different substrates, the last two
rows describe the different matches granted by YSZ (100), along with the lattice parameters for epsilon ferrite nanoparticles and substrates epitaxial matches. ____________________________________________________ 69
Table 5: Values for the standard deviation of the Gaussian fit of the Phi scan of the 013 peaks for films grown on
different substrates. __________________________________________________________________________ 75
Table 6: Values of the standard deviation of the Lorentzian fit for the Rocking curve of 004 peaks of epsilon ferrite
thin films deposited on different substrates. ________________________________________________________ 76
Table 7: calculated width of the terrace for miscut YSZ (100) and STO (111) for increasing degrees of miscut. The
0.05° degrees, which is often the tolerance on regular substrates, is shown for comparison. _________________ 116
Table 8: Le « mismatch » entre paramètre de maille a et b de ferrite epsilon et les substrats choisis pour obtenir une
croissance épitaxiale. Le « mismatch » a été calculée en utilisant mismatch = (a film - a sub)/a sub. En raison du « match »
de réseau inhabituelle, il n'est pas possible de définir le « mismatch » pour le cas YSZ "non parallèle" (ici appelé YSZ 2). _______________________________________________________________________________________ 140
Table 9: Paramètres de mailles trouvés pour les films minces épitaxiales de ferrite epsilon cultivées sur des substrats
différents, ainsi que les paramètres de maille de nanoparticules de ferrite epsilon. ________________________ 144
Table 10: Valeurs de l'écart - type de la forme gaussienne, d'évaluer dans le plan mosaïcité, et en forme de Lorentz,
pour le hors-plan, pour le balayage « phi » du pic 013 et du « rocking curve » du pic 004 des couches minces de ferrite epsilon déposé sur différents substrats. _____________________________________________________ 148
Table 11: Largeur calculée de la terrasse pour substrats de YSZ (100) et STO (111) pour des degrés croissants de
miscut, calculées selon la formule: largeur = paramètre de maille * cos (angle de miscut). Les degrés de 0,05 °, souvent tolérants sur des substrats réguliers, sont présentés à titre onéreux. _____________________________ 157
𝑀 = 𝜒𝐻. (1.1) ____________________________________________________________________________ 13 H = -2J Si
Sj, (1.2) _________________________________________________________________________ 14 Ea = K1 sin2
, (1.3) _________________________________________________________________________ 18 m = γℏS. (1.4) ______________________________________________________________________________ 19 HZ = -m B0 = - γℏ B0 Sx. (1.5) __________________________________________________________________ 19 ΔE = γℏ B0. (1.6) ____________________________________________________________________________ 19 ω0 = γ B0. (1.7) ______________________________________________________________________________ 19 ω0 = γ μ0 Ha1/2. (1.8) _________________________________________________________________________ 20 ∆𝐺 = 𝑎1𝑟2Γ𝐶 − 𝑉 + 𝑎2𝑟2Γ𝐶 − 𝑆 − 𝑎2𝑟2Γ𝑆 − 𝑉 + 𝑎3𝑟3∆𝐺𝑉. (2.1) ________________________________ 32 ∆𝐺𝑉 = −𝑘𝐵 𝑇𝛺𝑙𝑛𝑃𝑃𝑒 = −𝐾 𝑇𝛺𝑙𝑛𝜉, (2.2) ______________________________________________________ 33 𝑎1Γ𝐶 − 𝑉 + 𝑎2Γ𝐶 − 𝑆 ≥ 𝑎2Γ𝑆 − 𝑉. (2.3) _______________________________________________________ 33 𝑟 ∗= −2(𝑎1Γ𝐶 − 𝑉 + 𝑎2Γ𝐶 − 𝑆 − 𝑎2Γ𝑆 − 𝑉)3𝑎3∆𝐺𝑉. (2.4) ________________________________________ 33 ∆𝐺 ∗= 4𝑎1Γ𝐶 − 𝑉 + 𝑎2Γ𝐶 − 𝑆 − 𝑎2Γ𝑆 − 𝑉327𝑎3∆𝐺𝑉2. (2.5) ______________________________________ 34 𝐽𝐶 = 𝐴𝑟𝑟𝑖𝑣𝑎𝑙 𝑟𝑎𝑡𝑒 𝑜𝑓 𝑎𝑡𝑜𝑚𝑠𝑎𝑡 𝑐𝑟𝑖𝑡𝑖𝑐𝑎𝑙 − 𝑠𝑖𝑧𝑒 𝑛𝑢𝑐𝑙𝑒𝑢𝑠 × 𝐶𝑜𝑛𝑐𝑒𝑛𝑡𝑟𝑎𝑡𝑖𝑜𝑛𝑜𝑓 𝑐𝑟𝑖𝑡𝑖𝑐𝑎𝑙 𝑛𝑢𝑐𝑙𝑒𝑖. (2.6) ______ 34 𝑒𝑥𝑝 − ∆𝐺 ∗ 𝑘𝐵𝑇. (2.7) _______________________________________________________________________ 34 Γ𝐶 − 𝑉 +Γ𝐶 − 𝑆 ≤Γ𝑆 − 𝑉. (2.8) ______________________________________________________________ 35 𝑙𝐷 = 𝐷𝑆𝜏, (2.9) ____________________________________________________________________________ 37 𝐷𝑆 = 𝜐𝑎2𝑒𝑥𝑝 − 𝐸𝐴𝑘𝐵𝑇, (2.10) _______________________________________________________________ 37 𝑚𝑖𝑠𝑚𝑎𝑡𝑐ℎ = 𝑎𝑓 − 𝑎𝑠𝑎𝑠, (2.11) _______________________________________________________________ 39 2𝑑𝑠𝑖𝑛𝜃 = 𝑚𝜆. (2.12) ________________________________________________________________________ 44 𝑄 = 𝐶𝑟𝑒𝑓 ∗ 𝑉𝑟𝑒𝑓. (2.13) ____________________________________________________________________ 50 𝐼 = 𝑑𝑄/𝑑𝑡. (2.14) ___________________________________________________________________________ 51 𝑃 = 𝑄𝑆. (2.15) _____________________________________________________________________________ 51 𝐺𝑉 = 𝜇𝑣 + 6𝜎𝑑, (3.1) _____________________________________________________________________ 56 𝑤𝑡 = 𝑎 𝑐𝑜𝑡𝜃. (3.2) ________________________________________________________________________ 116AFM, Atomic Force Microscopy CVD, Chemical Vapor Deposition
D-D-SI, Derivative-Deconvolution-Selective Integration EELS, Electron Energy Loss Spectroscopy
FE, Ferroelectric
FMR, Ferromagnetic Resonance FWHM, Full Width at Half Maximum GFO, Gallium Ferrite
HAADF, High-Angle Annular Dark-Field LaAlO3 – LAO, Lanthanum Aluminate LiNbO3, Lithium Niobate
LSAT, Lanthanum/Strontium Aluminate/Tantalate MFM, Magnetic Force Microscopy/Microscope MgO, Magnetisum Oxide
PFM, Piezoresponse Force Microscopy/Microscope PLD, Pulsed Laser Deposition
RHEED, Reflection High-Energy Electron Diffraction SPM, Scanning Probe Microscopy/Microscope
SrTiO3 – STO, Strontium Titanate
STEM, Scanning Transmission Electron Microscopy/Microscope STM, Scanning Tunneling Microscopy/Microscope
INTRODUCTION – IRON OXIDES AND EPSILON FERRITE.
Iron oxides are ubiquitous in Nature: they are not only abundantly found in Earth’s crust, but also in a very different setting such as the surface of Mars, where they are mostly responsible for the color of the “red” planet1,2. The most abundant iron oxide, hematite (α-Fe
2O3), is the oldest known among the iron oxides: millennia old writings made with an hematite-based red chalks were found in South Africa in what might constitute of one of the earliest evidences of human behavior3. Hematite can be found in a range of colors, among which one is red, from which takes its name from (in Greek, αἱματίτης haimatitēs = blood-red). Given the possibility of smelting it into iron ores, hematite played a pivotal role in human development and evolution, from the Iron Age (12th-7th century BCE) to the industrialization era (due to the use of iron to fabricate steel). Hematite is a weak magnetic material, characterized by a corundum structure (like sapphire, α-Al2O3), and it is the most stable between the different iron oxides.
The second most abundant iron oxide, magnetite (Fe3O4), is the most magnetic among the minerals found in the Earth crust, thus among the iron oxides: as a mineral, when naturally magnetized, is known as lodestone, which properties were well known by Asian and European, who used it as navigation tool (indicating the direction of the North) to aid themselves in their exploration as early as the eleventh century CE (although similar devices were used for divination a thousand year earlier)4. Magnetite is responsible for the magnetic properties of most rocks, and is even formed in different organism that base their orientation on magnetism. It is a black, ferrimagnetic mineral, characterized by an inverse spinel (cubic) structure containing both Fe3+ and Fe2+ ions.
Maghemite (γ-Fe2O3) is a brown-red ferrimagnetic compound, isostructural to magnetite but fully oxidized (therefore not characterized by the presence of Fe2+ ions). It is, along hematite, the only stable iron (III) oxide that can be found in nature. Its existence was long unknown to man: it was first synthesized by oxidizing magnetite in the second half of the 19th century5, and shortly after occurrence in Nature was also demonstrated. After a certain debate, its name was chosen by composing the one of MAGnetite with HEMatite, in allusion to its magnetic properties, similar to the ones of magnetite, and its composition (alike hematite, i.e. composed only of fully oxidized iron (III))6.
Figure 1: (a) hematite, (b) magnetite, (c) maghemite, and (d) wüstite minerals.
In the recent years iron oxides have attracted renewed interests; along with their abundance and low cost, the ease of obtaining different polymorphs with different oxidation states, and the possibility to access a variety of magnetic and electronic properties, the road towards new applications was opened by the development of new, easy, synthesis routes for nanosized iron oxides. Both chemical and physical approaches to the growth were followed, showing the possibility of achieving high quality nanostructures, along with extreme control on the nanostructures size, via techniques such as chemical precipitation, sol-gel, hydrothermal synthesis, precipitation, chemical vapor deposition, atomic layer deposition, sputtering and pulsed laser deposition7.
The possibility of displaying different colorations depending on the size of the iron oxides particles, along with their pure hues and high tinting strength, and their extreme stability and resistance to acidic and basic environments, make iron oxides ideally suited for pigments in ceramics and paints1. Pigments based on hematite, maghemite and magnetite are respectively red, brown, and black. Magnetite-based pigments are also used in magnetic ink in recognition devices, and in metallography for detecting defects in engines1. All the iron oxides are characterized by an overall environmental safety and stability in water at neutral pH and in physiological conditions, and, especially in their fully oxidized form, they are non-toxic, biodegradable, and biocompatible, making them ideal for applications in various fields of medicine. Last but not least, their intrinsic magnetic properties, e.g. the high magnetization at room temperature and high
of these particles, constitutes a major advantage given the need of avoiding any sort of cluster to prevent the very dangerous blockage of blood vessels. Hematite, due to its low cost, resistance to corrosion, environmental safety, and n-type semiconductor behavior, has been intensively investigated for applications in gas and chemical sensors8,9, rechargeable lithium ion batteries8, as catalyst10 or photocatalyst11, and for waste-water treatment12. The use of magnetite and maghemite nanoparticles has received considerable attention in different biomedical applications13,14, given their magnetic properties and the possibility to engineer their large surface area with different functional groups. Iron oxides nanoparticles have proved very efficient for in vivo applications, like in magnetic-guided drug delivery15,16, as contrast agent in magnetic resonance imaging (MRI)17, and for hyperthermia therapy18,19. Functionalized iron oxides nanoparticles also find many application in vitro, for example in biosensors20, and for cell separation21, displaying high cost-effectiveness ratio, sensitivity and speed. Maghemite also proved to be very efficient for removal of toxic agents, both ex situ and in situ, such as the water remediation of CrVI, a byproduct of many industrial processes that can act as a mutagen, carcinogen, and teratogen in mammals22, as well as for the removal of arsenic ions from wastewaters23. Finally, magnetite and hematite have been and are currently used as catalysts for several industrially important reactions, like in the desulfurization of natural gas, in the synthesis of NH3 (in the so-called Haber process), and in the high temperature water gas shift reaction1,3,24,25.
Figure 3: The structures of the three most investigated iron oxides, (a) hematite, (b) magnetite, and (c) maghemite.I
Although it is very rarely found in nature and it is not as easy to synthesize as its isomers, due to its inherent instability in ambient condition (which, however, did not stop Chinese craftsmen to use it as a pigment 1000 years ago26), attention must also be given to epsilon ferrite (ε-Fe
2O3), an intermediate phase of maghemite (γ-Fe2O3) and hematite (α-Fe2O3) with a complex orthorhombic crystal structure (Figure 4).
Figure 4: ε-Fe2O3 has an intermediate structure, characterized by oxygen octahedra like maghemite, and by alternating oxygen/iron layers like in hematite.
Epsilon ferrite has first been synthesized in 1934, when Forestier and Guiot-Guillain27 reported an iron(III) oxide different from α- and γ-Fe2O3. Then in 1963, Schrader and Buttner28, and almost at the same time Walter-Levy and Quemeneur29, were able to synthesize the material, to measure its X-ray diffraction (XRD) pattern for the first time and named it epsilon ferrite. Phase purity was first obtained by Trautmann and Forestier in 196530. Complete description of its structure, along with Mossbauer studies of its magnetic properties was reported by Tronc et al. in 199831, which renewed the interest towards the material prompting refined reports on its synthesis, structural, and magnetic characterization32,33. The then chosen form of synthesis was mostly nanoparticles embedded in a SiO2 matrix synthesized by Sol-Gel. The silica matrix proved to be crucial for the stabilization of metastable ε-Fe2O3 through size confinement mechanism. However, it was the first report on the giant coercive field in epsilon ferrite nanoparticles by Ohkoshi et al in 2004 which sparked the attention on this iron(III) oxide isomer34. The value found for H
C ≈ 20 kOe was the highest ever recorded for metal oxide-based material (commercially used hard magnetic materials barium hexaferrite and Co-ferrites are characterized by HC values of 6.4 and 7.4 kOe, respectively), opening
in forms different than nanoparticles, such as nanorods and nanowires36–39. A very important breakthrough was achieved when Ohkoshi et al. first showed how the magnetocrystalline anisotropy characterizing epsilon ferrite also results in a natural ferromagnetic resonance (FMR) frequency around 200 GHz, and showed the possibility of metal substitution into epsilon ferrite, thus obtaining ε-MxFe2-xO3, in order to tune the FMR frequency40. This frequency falls in the so-called millimeter wave range (30–300 GHz), which recently has started to be used in electronic devices for high-speed wireless communication. In various publications, it was shown how it is possible to lower the FMR frequency by substituting iron ions in ε-Fe2O3 with metals characterized by a smaller ionic radius compared to Fe3+, such as Ga3+ and Al3+, results in a lowering of the FMR frequency41–43, while substituting with ions having a larger radius like Rh3+ results in an the opposite effect, i.e. an increase of the FMR frequency44. Indium substitution in nanoparticles has been reported as well, however, while it was shown how it lowers the Curie temperature and the magnetization, no effect on the FMR frequency has been observed45. Finally, the last advancement on epsilon ferrite, was to show the possibility of synthesizing it in form different than nano-sized particles. In a recent publication, Carraro et al. reported on the growth of a mixture of supported ε- and ß-Fe2O3 nanorods on silicon wafers by chemical vapor deposition46. These nanostructures proved to not possess the same interesting functional properties as their nanoparticle counterparts; in particular, they exhibit a much lower coercive field, thus much lower magnetic anisotropy and much lower FMR. Moreover, they do not exhibit a completely ordered structure, making them not suitable for applications where such order is needed, like magnetic memories. However, they proved to be very efficient catalyst for hydrogen generation, with production rates as high as 125 mmol h-1 m-2, significantly superior to the commonly investigated α-Fe
2O347. In order to favor integration of ε-Fe2O3 in devices and to take advantage of the magnetic order characterizing the material, the most suitable form would be epitaxial thin films. Recently, growth of epitaxially stabilized epsilon ferrite thin films by pulsed laser deposition (PLD) has been reported by Gich et al., where the phase stabilization was accomplished by taking advantage of the epitaxial strain induced by the single crystal strontium titanate (SrTiO3) substrate48. Growth on substrates other than SrTiO3, namely alumina and yttrium stabilized zirconia (YSZ), has also been recently achieved, although not directly on YSZ, but with a 50 nm thick buffer layer of GaFeO3 (GFO) on top of YSZ used to promote the growth of epsilon ferrite49. Besides allowing better integration, epsilon ferrite in the form of thin films, given its polar structure (belonging to space group Pna21), also elicit the hope to be able to exploit its natural polarization. Although the ferroelectric behavior of single epsilon ferrite films has never been experimentally demonstrated, the presence of reversible spontaneous polarization was recently reported in layered structure of SrTiO3:Nb/AlFeO3/SrRuO3/ε-Fe2O350.
In such a context, my research focuses on expanding the current knowledge on the growth of epitaxial thin films of epsilon ferrite on different single crystal substrates by pulsed laser deposition and on the detailed characterization of their structural and functional properties. Initially, the idea to investigate ε-Fe2O3 was prompted by a publication by Ohkoshi et al. who showed that it was possible to induce the precession of the magnetization in epsilon ferrite nanoparticles utilizing an intense electromagnetic pulse of frequency equal to its FMR frequency51. Along with more fundamental research on the underlying physics of ultrafast demagnetization induced by femtosecond laser pulses52–58, epsilon-ferrite generated great interest at INRS-EMT given how, besides the expertise of our group Ferroic Lab in the growth and characterization of epitaxial thin film of multifunctional complex oxides a state-of-the-art laboratory for the generation and study of Terahertz radiation was in operation within the Advanced Laser Light Source (ALLS)59. ε-Fe
2O3, due its natural FMR frequency in the low THz rangeII, was indeed an ideally suited material for such an investigation.
The ultimate goal of the project was to achieve ultrafast switching of the magnetization by utilizing high intensity asymmetric THz pulses. Such feat would greatly increase the speed of magnetization reversal, which is a key feature in magnetic data storage, not to mention it would also be a switching process triggered remotely without the need of electrodes. In the state of the art recording technology, the magnetization reversal, i.e., the complete inversion of the direction of the magnetization vector M, occurs on a time scale on the order of the nanosecond, which is much larger than the characteristic precession time of the magnetization - on the order of picoseconds60. Having epitaxial thin films rather than nanoparticles, allows to have ordered structure of macroscopic dimensions, and is also very favorable for their eventual integration into consumer electronic devices. The first challenge encountered was to achieve the growth of epitaxial thin films by PLD and to understand the mechanisms behind the stabilization of the ε-Fe2O3 metastable phase. Then, the functional properties of the epsilon ferrite films were characterized to ensure they were showing the same features as the nanoparticles. In early stages of the research we were mainly interested in the high coercive field which is an effect of the high magnetic anisotropy, which in turn is also responsible for the FMR frequency in the low THz range.
The following step was to investigate the dielectric properties of our films, given their non-centrosymmetric crystal structure, in the hope to reveal a switchable polarization, therefore obtaining a novel multiferroic material with a very simple chemical composition and operating at room temperature. Finally, we looked
into the effect of metal substitution in epsilon ferrite, focusing on the effects of aluminum, in order to replicate the studies on metal inclusion in epsilon ferrite nanoparticles.
This thesis will therefore be organized in the following way:
Part I comprises the theoretical background and the description of the experimental techniques utilized in
the course of my doctorate. It is divided into two chapters:
Chapter 1: Theoretical background. Chapter 1 will introduce the physics behind the development of my
research. First, I will give more details about epsilon ferrite; then I will discuss about the magnetic order, about the ferroelectric order, and conclude introducing the concept of multiferroicity.
Chapter 2: Experimental. This chapter will be divided in two parts: The first will discuss the deposition
technique utilized in this work, pulsed laser deposition, both from the theoretical and practical point of view. The second part will review the main characterization methods that have been used through the course of the whole investigation.
Part II will discuss the different experimental results obtained in my research. It will be divided into five
chapters:
Chapter 3: Epitaxial stabilization of epsilon ferrite thin films. First, the features of the growth of epitaxial
thin films of epsilon ferrite by pulsed laser deposition will be presented, with focus given to the epitaxial match with the various substrates and the different growth mode they promote, and to the PLD growth conditions and their effect on the structure of the film. A detailed analysis of the structural results measured by X-ray diffractometry and scanning transmission electron microscopy will follow, detailing the effect on the different substrates on the structural properties of epsilon ferrite thin films.
Chapter 4: Functional characterization of epsilon ferrite thin films. This chapter will present the
characterization of the main functional properties of epitaxial thin films of ε-Fe2O3, namely their magnetic and dielectric properties. Extensive analysis will once more focus on the effect of the different substrates, this time on the magnetic properties.
Chapter 5: Growth and characterization of aluminum-substituted thin films. This section of the thesis
will cover the growth of aluminum-substituted epitaxial thin film of epsilon ferrite (ε-AlxFe2-xO3), highlighting how, by changing the aluminum concentration in the films, it is possible to control their coercive field and remanent magnetization.
Chapter 6: Deposition of epsilon ferrite on miscut substrates. Lastly, the study of the effect of growth on
on the effect of the miscut substrates on reducing the number of in-plane growth orientation, resulting in a material characterized by a quasi-uniaxial magnetic anisotropy.
Chapter 7: General conclusions and perspectives. This chapter will serve as general conclusion of the
thesis along with the future work needed towards improvement and integration of epsilon ferrite films as well as perspectives on the potential applications of ε-Fe2O3 thin films.
PART I
CHAPTER 1 THEORETICAL BACKGROUND
This first chapter will serve as an overview of the theoretical background of the thesis. Firstly, I will review the main properties of epsilon ferrite, starting from its crystal structure. Then, I will move to a review of the exchange interaction in magnetic materials, the different magnetic orders, and then introducing the concepts of magnetocrystalline anisotropy and its effect on magnetic materials. Lastly, I will conclude with a brief discussion over ferroelectricity and multiferroicity.
1.1 Structure and properties of epsilon ferrite.
Epsilon ferrite is characterized by an orthorhombic crystal structure which belongs to the non-centrosymmetric space group Pna21 (see Figure 5). Its structure is composed by 16 iron and 24 oxygen ions; the Fe atoms are divided into four different sites. Three of them, namely “A”, “B”, and “C” are
centering regular or distorted oxygen octahedra, while one, “D”, is centering oxygen tetrahedra. When grown as nanoparticles the lattice parameters of epsilon ferrite are a = 5.095 Å, b = 8.789 Å, and c = 9.437 Å.
Epsilon ferrite is a collinear ferrimagnet, with a Curie temperature TC ≈ 490 K43, composed by magnetic moment on the iron ions aligned anti-parallel two by two; the net magnetization is due to smaller magnetic moment on the “D” site (Figure 5)40.
Although being characterized by lower magnetization compared to γ-Fe2O3 and Fe3O4, ε-Fe2O3 exhibits high magnetocrystalline anisotropy which results in a gigantic room temperature coercive field, as high as HC ≈ 20 kOe in nanoparticles32,34,43,61,62. This characteristic makes it a promising candidate for non-volatile memories.
X-ray magnetic circular dichroism showed that the large coercivity of ε-Fe2O3 nanoparticles originates from the presence of a large magnetocrystalline anisotropy63. This large magnetocrystalline anisotropy, induced by the lattice distortions of the Fe3+ coordination polyhedra, leads to a strong hybridization between the Fe3d and the O2p orbitals, resulting in a non-zero orbital magnetic moment L, which, through spin-orbit coupling, defines a magnetic-easy axis. First principle calculations supported the experimental finding, predicting that the magnetic easy axis lies along the crystal a axis direction64. The magnetic anisotropy results also in a natural ferromagnetic resonance (FMR) frequency in the low THz range (~0.1-100 THz) at room temperature43, which is of particular interest given its potential use in short-range wireless communications (e.g. 60GHz Wi-Fi)42 and ultrafast non-volatile memories65.
Being characterized by a non-centrosymmetric crystal structure, belonging to a polar space group, ε-Fe2O3 is also characterized by a spontaneous polarization, which, if proved switchable at room temperature, will make of epsilon ferrite one of the few single phase room temperature multiferroic materials.
1.2 Brief discussion on magnetism.
1.2.1 Magnetic interactions and classes of magnetic materials.
The foundations of magnetic interactions lie in the study of the orbital and spin motions of electrons and their interaction with one another. The main distinction between the different materials is the presence or absence of interaction between the magnetic moments on the different atoms. Most of the materials do not show such interactions and will react weakly to applied fields, whereas the materials which are identified as magnetic, hold a very strong interaction between the moments. In order to introduce the different types of magnetic order, the simplest way is to describe the response of a material when subjected to an applied magnetic field. The first type of order discussed are the ones where the interactions between the magnetic moments on different atoms are ignored: diamagnetism and paramagnetism. The description that will follow will therefore describe the behavior of isolated atoms when exposed to a magnetic field. The complete description of these two phenomena requires treating the application of a magnetic field to an atom as a perturbation of its Hamiltonian 𝐻̂0 (see the books cited in reference for the complete
derivation)66,67. However, in case of linear materials such as diamagnetic and paramagnetic materials, the relationship between an applied field H and the resulting magnetic moment per unit of volume (or magnetization M) generated on a material, is expressed in term of the dimensionless quantity , called magnetic susceptibility, according to the law:
𝑴 = 𝝌𝑯. (1.1)
Diamagnetic materials (all the non-magnetic materials are at least diamagnetic if not paramagnetic, although such effect is often very weak), are characterized by a negative susceptibility χ, and will respond to an external field by generating an opposing magnetization. The diamagnetic interaction arises from the precession of the electron orbits. A diamagnetic material has its electrons all paired so that its atoms possesses only a net orbital moment (L) and no spin moment (S) in an applied field. In such case, the moments will have antiparallel alignment with respect to the applied field. The classical theory of diamagnetism was first suggested in 1905 by Paul Langevin and it is based on the Larmor precession of electrons.
moment. However, due to the non-interaction between the atoms, these moments are randomly organized. Applying and external field will have the effect of aligning all the moments, with higher alignment for more intense fields. In competition with the effect of the applied field, thermal energy will randomize the spins and the magnetic moments, resulting in a temperature dependency of the susceptibility, known as the Curie Law.
As previously stated, the materials which are usually identified as magnetic are characterized by a very strong interaction between the magnetic moments in neighboring ions. In order to evaluate the interaction between atoms, whose total electronic spins are Si and Sj, Werner Heisenberg formulated the following Hamiltonian known as the exchange interaction:
H = -2J S
i
S
j,
(1.2)
where J is the exchange constant. Exchange interactions are the fundamental entities that control long range magnetic order. Such interactions are electrostatic interactions, generated due to cost of keeping charges of the same sign close together. Exchange interaction will keep the moment on neighboring atoms aligned, while the sign of the exchange constant J will determine whether they are parallel or anti-parallel.
Different kind of exchange interactions exist. Amongst them, the most important are:
If the electrons on two neighboring atoms interact through exchange, this is called direct
exchange. However, such interaction is rare because it depends on the overlap of the magnetic
orbitals, which is often insufficient due to their strongly localized nature;
In many case, a third atom will act as a mediator between two magnetic ions. In such cases, one refers to indirect exchange and, more specifically, to superexchange. Such form of interactions extends longer than the short-range exchange thanks to the mediating non-magnetic ion.
Superexchange characterizes many ionic solids, including oxides and fluorides. In order to simplify the
description, the phenomena will be treated under the assumption that the magnetic moment arises from a single unpaired electron. Thus, in the case depicted in Figure 6 of MnO, there will be a single unpaired electron (in a d orbital), and the two electrons on the oxygen ion (on the p orbital). As shown in Figure 6, the antiferromagnetic alignment is the favorable one, since it would result in a delocalization of the electrons over the Mn-O-Mn bonds though decreasing the kinetic energy of the electron. However, superexchange can also lead to ferromagnetic, depending on the type of orbital (eg over t2g orbitals), or the angle between the metal (M) orbitals. The favorable configuration is described by the Anderson formulation of the so-called Goodenough-Kanamori rules.