BELGIAN SCIENCE POLICY
HEAD OF THE DEPARTMENT ‘RESEARCH PROGRAMMES’: NICOLE HENRY (UNTIL SEPTEMBER 2007) DIRECTOR OF ‘RESEARCH AND APPLICATIONS’: DOMINIQUE FONTEYN (FROM APRIL 2006)
CONTACT PERSON: DIMITRI HARMEGNIES
SPSD II (2000-2005)
FOR MORE GENERAL INFORMATION: SECRETARIAT: VÉRONIQUE MICHIELS WETENSCHAPSSTRAAT 8, RUE DE LA SCIENCE B-1000 BRUSSELS TEL : +32 (0)2 238 36 13 FAX : +32 (0)2 230 59 12 EMAIL : MICH@BELSPO.BE
S P S D I I
A L G A L B L O O M S : E M E R G I N G
P R O B L E M F O R H E A L T H A N D
S U S T A I N A B L E U S E O F S U R F A C E
W A T E R S ( B - B L O O M S )
A . W I L M OT T E , J. P. D E S C Y, W. V Y V E R M A N PART 2 G L O B A L C H A N G E , E C O S Y S T E M S A N D B I O D I V E R S I T Y AT M O S P H E R E A N D C L I M AT E M A R I N E E C O S Y S T E M S A N D B I O D I V E R S I T Y T E R R E S T R I A L E C O S Y S T E M S A N D B I O D I V E R S I T Y N O RT H S E A A N TA R C T I C A B I O D I V E R S I T Y SPSD IIALGAL BLOOMS: EMERGING PROBLEM FOR HEAL
T H AND SUST AINABLE USE OF SURF A CE W A TERS (B-BLOOMS) EV -34
Part 2:
Global change, Ecosystems and Biodiversity
A. Wilmotte University of Liege
Centre for Protein Engineering, Institute of Chemistry B6 B-4000 Liege
J.-P. Descy
FUNDP - Laboratory of Freshwater Ecology B- 5000 Namur
W. Vyverman University of Ghent
Protistology and Aquatic Ecology, B-9000 Gent
May 2008
With the participation of C. Boutte, V.Gosselain, I. v. Gremberghe, B. Leporcq, C. Moiny, J. Stimart, K.Van der Gucht, J. Van Wichelen, M. Waleron.
FINAL REPORT
Algal blooms: emerging problem for health and sustainable use of surface waters
(B-BLOOMS) EV/34
D/2008/1191/9
Published in 2008 by the Belgian Science Policy Rue de la Science 8 Wetenschapsstraat 8 B-1000 Brussels Belgium Tel: +32 (0)2 238 34 11 – Fax: +32 (0)2 230 59 12 http://www.belspo.be
Contact person: Mr Dimitri Harmegnies Secretariat: +32 (0)2 238 36 13
Neither the Belgian Science Policy nor any person acting on behalf of the Belgian Science Policy is responsible for the use which might be made of the following information. The authors are responsible for the content.
No part of this publication may be reproduced, stored in a retrieval system, or transmitted in any form or by any means, electronic, mechanical, photocopying, recording, or otherwise, without indicating the reference.
SPSD II - Part 2 - Global change, Ecosystems and Biodiversity 3
TABLE OF CONTENTS
ABSTRACT... 5
INTRODUCTION ... 9
MATERIAL AND METHODS ... 17
1. Monitoring of reference lakes in Wallonia and Flanders... 17
1.1. The reference lakes: the 3 pre-dam lakes of Eau d’Heure and Blaarmeersen... 17
1.2. Sites, sampling occasions and measurements... 19
2. Screening of Belgian lakes for algal blooms by the BLOOMNET network... 19
3. Pigment analysis... 20
4. Microscopic identifications... 20
5. Zooplankton countings and filtration rates... 20
6. Studies of the genotypic diversity of bloom-forming cyanobacteria... 21
6.1. Sampling and DNA extraction... 21
6.2. Denaturating Gradient Gel Electrophoresis (DGGE) ... 21
6.3. Construction of clone libraries... 21
7. Molecular studies of diversity of cyanotoxin genes and design of tools for monitoring toxins... 22
7.1. mcyE/B detection ... 22
7.2. RFLP of mcyE: fast assessment of the identity of the toxin-producer ... 22
8. Determination and measurement of toxins... 23
8.1. Handling of samples for microcystins measurements ... 23
8.2. Measurements of microcystins at CRITT-BioIndustries (Toulouse, France) ... 23
8.3. Measurements of microcystins at FUNDP ... 24
8.3. Analyses of anatoxin-a at CRITT-BioIndustries (Toulouse, France) ... 24
9. Data processing: multivariate analyses and artificial neural network... 25
9.1. Prediction of cyanobacteria in Eau d’Heure pre-dam lakes... 25
RESULTS AND DISCUSSION... 29
1. Monitoring of the pre-dam lakes of the “Eau d’Heure” complex... 29
1.1. Cyanobacteria blooms in Eau d’Heure lakes: data analysis and prediction models ... 29
1.3. Monitoring of Lake Blaarmeersen ... 32
1.4. Screenings of Belgian lakes for algal blooms by the network BLOOMNET ... 35
2. Determination of toxigenicity and measurement of toxins... 40
2.1. Determination of the toxigenicity... 40
2.2. Identification of the toxin producer by RFLP of the mcyE gene... 40
SPSD II - Part 2 - Global change, Ecosystems and Biodiversity 4
3. Genotypic diversity of bloom-forming cyanobacteria... 53
3. 1. Cyanobacterial genotypic diversity in lake Blaaarmeersen ... 53
3.2. L’ Eau d’Heure complex ... 56
3.3. BLOOMNET lakes and ponds... 61
3.4. Global tree based on the five clone libraries... 65
3.4. Comparing DGGE and clone libraries with microscopic determinations ... 68
GENERAL CONCLUSIONS AND RECOMMENDATIONS... 71
ACKNOWLEDGEMENTS ... 75
SPSD II - Part 2 - Global change, Ecosystems and Biodiversity 5
ABSTRACT
The BBLOOMS project was a two-year program, which was primarily proposed to make a first assessment of the extent of present cyanobacterial blooms in Belgium and of the potential threat for the surface water resources. In this study, we addressed several aspects: (i) the extent and phenology of nuisance blooms in multiple-use Belgian surface waters, (ii) the taxonomic diversity of bloom-forming cyanobacteria, using traditional and genetic tools, (iii) the use of genetic markers to estimate whether the organisms are potentially toxic, (iv) the measurement of toxin concentration in field samples, and (v) the relationship between environmental variables and nuisance blooms in selected water bodies. Most field samples came from 4 reference lakes (Blaarmeersen lake in Flanders and three pre-dam lakes of Eau d’Heure in Wallonia) that were monitored intensively for 2 years. Twenty-three samples were taken for Blaarmeersen, in a continuous manner. Seventy-three samples were studied for the Eau d’Heure complex, but only when proliferations were observed. Additional samples were provided by summer samplings in a series of small lakes in Flanders carried out by the University of Gent. As this was insufficient to obtain a global view of the phenomenon, we have built BLOOMNET, a network of water managers and users, who received information about cyanobacterial blooms and how to collect them for subsequent analysis. The network contributed about forty samples from all regions.
This first study of algal blooms in Belgium has shown that the phenomenon was quite common when meteorological and environmental conditions were favourable.
The monitoring of the reference lakes provided the environmental and biological data to assess the feasibility of developing predictive models of cyanobacterial blooms. Environmental conditions favouring cyanobacteria were systematically high temperature, high pH and stable stratification, but potentially toxic taxa required high dissolved phosphorus, with relatively low inorganic nitrogen. Number of days without strong winds was also a factor favouring cyanobacteria blooms, as was the abundance of the larger filter-feeders (Daphnia, cyclopoid copepods) in the zooplankton. The prediction of total cyanobacteria biomass using Artificial Neural Networks (ANN) gave good agreement between predicted and
observed values (R2 = 0.95). The best predictive variables were total nitrogen and
total phosphorus, along with the meteorological variables. This implies that key conditions for bloom prediction can be monitored relatively easily using weather stations and water sensors connected to data loggers.
In total, 93 BLOOMNET bloom samples from Flanders, Wallonia and Brussels were obtained, with 81 coming from Flanders (69 different waterbodies). The bloom samples were obtained from March till October. The toxigenicity tests by amplification
SPSD II - Part 2 - Global change, Ecosystems and Biodiversity 6
of mcyB/E genes appeared adequate to select samples that could be submitted to an analytical measurement of microcystins by HPLC. When 12 samples with one or none of the mcy genes were tested, none gave detectable concentrations of microcystins. In contrast, half of the samples selected with both mcy genes indeed contained measurable amounts of microcystins in the conditions used. In total, seventy-nine percent of the Flemish BLOOMNET samples tested by PCR harboured toxigenic taxa (double positives for the mcyB/E genes), and 90% for the Walloon BLOOMNET samples (11 samples tested). Due to technical problems, measurements of microcystins by a sub-contractor were restricted to a limited number of samples, and mainly carried out on lyophilized biomass. Of the 46 Flemish BLOOMNET samples positive for the two mcy genes, 54% actually contained total
microcystins, in a range of concentration from 18 µg [g DW]-1 to 2651 µg [g DW]-1. In
13/21 Flemish lakes, the microcystin-LR concentrations are higher than the threshold of a French recommendation used to forbid the access to the recreation waters (25 µg/L microcystin-LR). Microcystis was the dominant cyanobacterial genus in all samples where microcystins were detected. However, Planktothrix blooms were also observed, and in 2 cases, coincided with microcystin detection. Among the reference lakes, lake Blaarmeersen does not seem to be prone to toxic blooms, whereas toxigenic proliferations were observed in the Eau d’Heure lakes but could not be confirmed by microcystin measurements due to technical problems. The neurotoxin, anatoxin-a, was also measured by HPLC but could not be detected by the subcontractor in any of the samples selected for analysis of this toxin, even in the presence of massive bird kills. Other cyanotoxins were not tested.
The protein phosphatase inhibition assays used for detection and analysis of cyanobacterial hepatotoxins did not provide satisfactory results in this study. It seems that it produced false positives, probably because the targeted enzyme system also responds to a wide variety of noncyanobacterial toxins and metabolites.
The molecular diversity of the cyanobacteria was also studied on the basis of 16S rRNA sequences. Two methods were used, Denaturating Gradient Gel Electrophoresis (DGGE) and construction of clone libraries.
In lake Blaarmeersen, no real cyanobacterial blooms were detected by DGGE. The most dominant cyanobacteria were affiliated to Synechococcus, Limnothrix
redekei and Anabaena/Aphanizomenon. The cyanobacterial community in lake
Blaarmeersen differed from season to season and from year to year. During the stratification period, there was also a difference between the community in the epilimnion and hypolimnion. A clone library on a July sample yielded a majority of sequences belonging to Anabaena/Aphanizomenon (OTU I), and quite a lot of
Synechococcus ones (OTU IV, V, VI). A minor component corresponded to Limnothrix redekei (OTU IX). Four measurements of microcystins by HPLC in 3
SPSD II - Part 2 - Global change, Ecosystems and Biodiversity 7
Considering two lakes of Eau d’Heure (30 samples), in Falemprise, a bloom of
Anabaena/Aphanizomenon and in Ri Jaune, a proliferation of Synechococcus were
detected by DGGE. The cyanobacterial community differed significantly between the two lakes and between the two years. With clone libraries, a July sample of Falemprise confirmed the dominance of cyanobacteria affiliated to Anabaena/Aphanizomenon (OTU I) whereas in August in Féronval, it was a different lineage in this cluster (OTU II) that was dominant. In Ri Jaune, in August, a much larger diversity was present with sequences of Woronichinia naegeliana (OTU VII), Synechococcus (OTU IV, V) and
Microcystis (OTU VIII). Due to technical problems, it is not known if any Eau d’Heure
blooms was toxic.
For BLOOMNET samples, DGGE revealed also that the most dominant bloom formers were Microcystis, Planktothrix and Anabaena/Aphanizomenon. Planktothrix was found at significant lower temperatures and at significant higher concentrations of nitrate in comparison to Anabaena and Aphanizomenon. A clone library of Parc des Sources (Woluwé, Brussels), where microcystin was detected, was dominated by
Planktothrix (OTU III) sequences and a few Aphanizomenon (OTU I).
The geographic scope of this study has been biased towards recreational and fishing ponds in Flanders, as the majority of samples came from that region. When tested for toxigenicity, 79 % of these samples showed the presence of two genes involved in the synthesis of microcystins, and of the 61 samples tested by HPLC (including 46 with both mcy genes), 25 indeed contained measurable amounts of these cyanotoxins. Thirteen out of the twenty-one lakes with measurable microcystins should be closed for recreation, using the threshold value of a French directive. In Wallonia and Brussels, sporadic blooms also showed some toxicity, but not enough analyses could be carried out.
KEYWORDS: algal blooms, cyanotoxins, nutrients, meteorological conditions, cyanobacteria, diversity, detection, early-warning, mcy genes, 16S rRNA
SPSD II - Part 2 - Global change, Ecosystems and Biodiversity 9
I
NTRODUCTIONAlgal blooms, mass developments of algae and cyanobacteria floating at the surface of waterbodies, have become a recurrent and increasingly important phenomenon in freshwaters worldwide over the last decades. These nuisance blooms, and in particular those dominated by cyanobacteria, represent major potential hazards for human and animal health, and interfere in various negative ways with the use of surface waters for e.g. drinking water supply, recreation, irrigation, fisheries. While in other European countries, initiatives have been taken to monitor algal blooms in surface waters, there was a striking lack of knowledge of incidence and nature of algal blooms in Belgian surface waters. The participants in BBLOOMS, as well as other research groups, had recently accumulated evidence suggesting that water blooms, particularly by toxic cyanobacteria, may be a common phenomenon in Belgian surface waters, with still uncertain consequences for public and ecosystem health.
The B-BLOOMS project associated Belgian research groups from three universities (Universities of Liège, Gent and Namur) having expertise in taxonomy and ecology of phytoplankton, as well as in molecular diversity of cyanobacteria. The first general objective of BBLOOMS was to document the extent, nature (genotypic diversity, identification of toxins), the phenology and ecology of nuisance blooms in Belgium. In other words, this two-year program was primarily proposed to make a first assessment of the extent of cyanobacterial blooms in Belgium and of the potential threat for the surface water resources. As cyanobacterial blooms are known to develop in specific environmental conditions (most blooms develop in stratified eutrophic “standing” water bodies), the project incorporated the development of predictive models: is it possible, from easily monitored environmental conditions, to predict where and when potentially toxic cyanobacteria blooms could occur, i.e. to set an early-warning system from environmental monitoring? Third, as the problem may well appear as being real, B-BLOOMS also puts an emphasis on the development of tools for detecting potentially harmful algal blooms in Belgian surface waters, which could be used later on to set up a country-wide monitoring network. Companies and agencies involved in the management and exploitation of freshwater resources were involved from the beginning, both in a user committee following the study and as members of a network (BLOOMNET) designed for sampling phytoplankton blooms in various freshwater bodies.
Notably, at the start of this project, there was no Belgian laboratory where routine measurements of microcystins by HPLC could be conducted. Therefore, during the course of the project, the laboratory of Namur has developed this methodology and carried out some analyses at the end of the project. However, Belgium is still missing facilities to analyse other cyanotoxins (neurotoxins) in water
SPSD II - Part 2 - Global change, Ecosystems and Biodiversity 10
samples and to identify cyanotoxins in tissues of animals, in case of massive bird and fish kills.
In this report, we have addressed the following specific questions in a multi-disciplinary manner:
1) What is the extent and phenology of nuisance blooms in multiple-use Belgian surface waters?
2) What is the taxonomic diversity of bloom-forming algae, particularly cyanobacteria, on the basis of traditional and genetic tools? Which markers, based on classical (microscopy, pigments) and molecular methods (genomic sequences) can be used to easily and quickly estimate whether the organisms are potentially toxic?
3) What is the toxin concentration in the samples? Are these values higher than guideline values proposed in other countries and by WHO?
4) Which are the environmental conditions related to triggering of nuisance blooms in selected model systems? How can these parameters be used as a basis for the development of models for the prediction of future blooms?
State-of-the art on cyanobacteria blooms
Algal nuisance blooms : what are they and what is their ecology?
Algal BLOOMS are made by proliferations of algae that form visible masses and scum covering the water surface. In the marine environments, eukaryotic microalgae like dinoflagellates, raphidophytes, haptophytes and diatoms cause important health, environmental and socio-economic problems. In freshwaters, the bloom-formers are generally cyanobacteria (often named ‘blue-green algae’) though cases of toxic blooms of dinoflagellates in freshwater have been observed (Rengefors 2001). It is estimated that 40 to 70% of cyanobacterial blooms release toxins in the water. In addition to this hazard, negative effects include also the aesthetic problems (discolouration, production of scum), the release of malodorous compounds like geosmin, the clogging of filters used for drinking water, and the anoxia due to intense oxygen consumption. Toxic cyanobacteria have been reported in surface waters used for recreational activities and drinking water supply in almost all European countries. At the international level, cyanotoxins were found at least in 57 countries on 5 continents (Chorus & Bartram 1999, Codd et al. 1999). Though the list of cyanobacterial genera including toxin-producing members is expected to increase, the most frequent producers in our regions belong to the planktonic genera
Microcystis, Nostoc, Anabaena, Nodularia, Aphanizomenon, Cylindrospermopsis, Gloeotrichia and Planktothrix. However, different strains of the same species, or
different samples of one bloom may vary in toxin production (Codd et al. 1999). Cyanobacterial toxins, or cyanotoxins, have caused animal poisonings (e.g.
SPSD II - Part 2 - Global change, Ecosystems and Biodiversity 11
livestock, waterfowls, pets) and problems for recreation and production of safe drinking water.
According to their effects on health, cyanotoxins are divided into hepatotoxins (liver damaging, tumor promoting: microcystins, nodularins, cylindrospermopsins), neurotoxins (nerve damaging: anatoxin-a, anatoxin-a(S), saxitoxins), and dermatotoxins (dermatitis: aplysiatoxins, lyngbyatoxins). Microcystins are the most common cyanotoxins worldwide. They are specific inhibitors of the eukaryotic protein phosphatases 1 and 2A.
Main exposure routes are the drinking water, the inhalation and swallowing of water during sports (e.g. swimming, kayak) and showering, and irrigation of crops (Codd et al. 1999). Recognizing the importance of these compounds, the World Health Organisation (WHO 1997) has proposed a Guideline Value of 1.0 µg/L for microcystin-LR in drinking water (Chorus & Bartram 1999). An exceptional case of direct exposure happened when haemodialysis using water from a reservoir containing blooming cyanobacteria was fatal to 60 Brazilian patients (Jochimsen et al. 1998). More frequent, though unrecognized, are probably health problems related to bathing and sporting in waters where cyanobacteria are blooming. Recently, the death of an american teenager was hypothesized, after autopsy, to be due to cyanobacteria producing anatoxins (Stewart et al. 2006a, http://www.jsonline.com/story/index.aspx?id=167645). In Belgium, this might be the most relevant risk for the population, especially children and teenagers who might swallow water when swimming and playing. The WHO guidelines include three levels of alert for recreational waters: 1) low probability of adverse health effects from waters with 20,000 cyanobacterial cells/mL or 10 μg chlorophyll a/L (if cyanobacteria are dominant); 2) moderate probability of adverse effects from waters with 100,000 cells/mL or 50 μg chlorophyll-a/L; and 3) high probability of adverse effects from contact with and/or ingestion/aspiration of cyanobacteria at scum-forming densities (WHO 2003). To address the problem in more direct manner, a French recommendation of the circular DGS/SD7a-N°2003-270 of 4 June 2003 gives a value of 25 µg/L microcystin-LR to forbid the access for bathing in recreation waters. Epidemiological studies are unfortunately still rare. A recent cohort study in Florida and Australia showed that subjects exposed to high levels of cyanobacteria in recreational waters were more likely to report symptoms after such exposure than subjects exposed to low levels of cyanobacteria. Respiratory symptoms were most evident, but of low severity. However, no cyanotoxins could be measured in the majority of the studied water bodies (Stewart et al. 2006b). Thus, more studies are needed to better assess the risks linked to exposure to cyanobacterial blooms and toxins.
The chemical structures of harmful compounds range from cyclic peptides, alkaloids to lipopolysaccharides. The cyclic peptides are the most stable toxins and
SPSD II - Part 2 - Global change, Ecosystems and Biodiversity 12
are quite resistant to heat, hydrolysis and oxidation. In general, treatments to eliminate cyanobacteria and toxins are expensive and must be thoroughly tested to avoid creating even more toxic compounds (EPA 2001).
Cyanobacterial bloom formation in fresh water bodies usually require a combination of environmental conditions, among which high nutrient loading, low N:P
ratio, high pH (low CO2), water column stability and long water residence time are
key factors (Maberly et al. 1994, Reynolds 1998).
In addition to the formation of proliferations, the question of the variability of toxin production by the cells is of key importance to determine the concentration of the toxin finally available in the environment. Field studies have shown that the same factors that influence cyanobacterial growth (light and nutrients) also influence the microcystin dynamics (in function of cyanobacterial biomass). Laboratory cultures with isolated strains have shown that the microcystin contents of cyanobacteria could vary by a factor 2-3 in response to environmental conditions, but there was a large variability between different strains of Microcystis (Kardinaal & Visser 2005). Toxic and non-toxic Microcystis strains grown with variable nitrogen and phosphorus concentrations showed different growth rates and toxin productions and it was concluded that high levels of nitrogen and phosphorus in freshwaters may favour the growth of toxic strains over non-toxic ones (Vézie et al. 2002).
Identification of bloom-forming cyanobacteria: classic taxonomy and genetics The identification is a first hint that a toxin-producing taxon is present, but it is only the first step in the assessment of toxicity. Indeed, from the same bloom, toxic and non-toxic strains can be isolated but there is little information about factors that regulate such ratio. One strain may produce one or more cyanotoxins, and their productions are influenced in various proportions by environmental factors such as phosphate, nitrate, light, pH, T° (Utkilen & Gjolme 1992, Vézie et al. 2002). However, Kurmayer et al. (2002) noted that some morphotypes were less likely to be toxigenic. Indeed, morphotypes identified as Microcystis wesenbergii did not contain the mcyB gene, and only 17% of M. ichthyoblable did. So, there are probably cases where a careful determination of the morphology can be useful to predict the microcystin production, but this possibility must be still tested on a large scale. Moreover, the size (and thus the age) of the colonies seem to be important. Indeed, it was also demonstrated that the proportion of microcystin-producing colonies depended on colony size, with larger colonies producing more often microcystins (Via-Ordorika et al. 2004).
Molecular tools have been introduced to alleviate the shortcomings of morphological identification of cyanobacteria. Indeed, the latter may be confused by the morphological plasticity of the organisms and disagreements between taxonomic schemes and authors. Moreover, the morphological and genotypic diversity generally
SPSD II - Part 2 - Global change, Ecosystems and Biodiversity 13
do not coincide (Lyra et al. 2001, Wilmotte1994, unpublished). For toxin-producing cyanobacteria, the molecular taxonomic markers generally used included the 16S rRNA, the spacer between the genes encoding the 16S and 23S rRNA, cpcBA,
rpoC1, rbcLX and nifH (Otsuka et al. 1999, Beltran & Neilan 2000, Baker et al. 2001,
Dyble et al. 2002, Gugger et al. 2002, Rantala et al. 2004). They generated useful information and novel insights on the phylogeny and geographic distribution of the studied taxa. This is why this project has combined morphological and molecular approaches. With this combination of tools, the information obtained on the identification and quantification of cyanotoxins can be put in the right context, and relations between the samples, their physico-chemical features, the taxa, and the toxins can be examined.
Analysis and toxicity assessment of cyanotoxins
In the early studies, the mouse bioassay was used to determine the toxicity of cyanobacterial bloom samples. Several alternative bioassays and methods are now available to screen the toxicity of samples and quantify toxins. For example, the protein phosphatase inhibition assay (PPIA) is a sensitive and specific test to detect cyanobacterial hepatotoxins (microcystins and nodularins) (Ward et al. 1997). This method is well suited to discriminate the toxic samples but as it gives a measure of the total hepatotoxin concentration, it has to be complemented by an analytical method, such as HPLC analysis with diode array detector. More sophisticated and costly methods include GC-MS, MALDI-TOF, NMR and ELISA (Blaha & Marsàlek 2000, Fastner et al. 2001).
Genetic markers of toxins production
Microcystins, the cyclic heptapeptide hepatotoxins are the most common cyanobacterial toxins worldwide and are mainly produced by the freshwater cyanobacteria Anabaena, Microcystis, Planktothrix and Nostoc. There are more than 70 isoforms known at present, with various toxicities (Codd et al. 2005a). These cyclic peptide toxins are products of non-ribosomal peptide/polyketide synthesis. The microcystin synthetase gene clusters have been characterized from Microcystis,
Anabaena and Planktothrix (Dittmann & Börner 2005). Microcystin synthetase genes
(total size 55 kb including the modification genes) code for peptide synthetases, polyketide synthetases, and modification enzymes which assemble microcystins. The
mcy gene cluster assembly consists of 10 bidirectionally arranged genes that reside
in two operons (mcyA-C and mcyD-J) in Microcystis aeruginosa. In Anabaena 90, the genes are also transcribed from a bidirectional promoter region, whereas in
Planktothrix, all genes except mcyT seem to be transcribed unidirectionnally. PCR
primers have been designed, that enable the specific and sensitive detection of several peptide synthetase genes (mcyA, mcyB, mcyC) (Baker et al. 2001, Tillett et
SPSD II - Part 2 - Global change, Ecosystems and Biodiversity 14
al. 2001, Nonemann & Zimba 2002) in Microcystis strains and water samples. More recently, Rantala et al. (2004) have determined the sequences of mcyE, mcyD and
mcyA of Nostoc, Anabaena, Planktothrix and Microcystis. These authors also
suggested that the genes encoding the nodularin synthetase (found in Nodularia
spumigena) are derived from those encoding the microcystin synthetase. In addition,
putative genes have been found for cylindrospermopsin, a potent hepatotoxin produced by Cylindrospermopsis raciborskii, and species of Anabaena and
Aphanizomenon. On this basis, specific PCR primers have been designed (Schembri
et al. 2001).
Use of models to predict harmful algal blooms
Simulation and prediction of cyanobacteria blooms has been approached with several mathematical models (Patterson et al. 1994, Reynolds & Irish. 1997, Wallace & Hamilton 2000). The Artificial Neural Network (ANN) models can be applied successfully for predicting the composition of algal assemblages and the occurrence of blooms. For instance, a ANN model developed for the lake Kasumigaura (Japan) was able to predict the blooms of three algal and cyanobacterial taxa, but failed for
Oscillatoria (Wei et al. 2001). Recknagel et al. (1997) succeeded in predicting cell
abundance of three major cyanobacteria genera in three lakes, located in Japan and in Finland. Therefore the development of predictive tools for potentially and actually toxic blooms seems possible, provided a data base containing data from adequate monitoring of the relevant factors is constructed.
The situation in Belgium at the start of B-BLOOMS
In 2003, there was recently accumulated evidence from Belgian surface waters that recurrent nuisance blooms were probably widespread. In Flanders, toxic Microcystis samples had been investigated by van Hoof et al. (1994). In Wallonia, the first microcystin-producing bloom was found in a pond near Liège (Wirsing et al. 1998) but several eutrophic reservoirs used for recreation and drinking water supply were potential sites for the development of toxic cyanobacteria. For instance, a study started in 2002 has detected a “blue-green” bloom (Aphanizomenon flos-aquae) in the lake of Falemprise (Hainaut), where swimming is allowed (Descy et al. unpublished). These scattered data suggested that nuisance algal blooms might be widespread in Belgian freshwaters, but the risks had never been assessed and the ponds and reservoir management simply ignored this risk.
During the B-BLOOMS project, in 2005, Willame et al. warned that in 64 blooms from Southern Belgium, Luxembourg and Northern France, 53% of the samples contained measurable amounts of microcystins.
Given the worldwide and European level initiatives to monitor blooms, it is crucial that this expertise is also developed for Belgian surface waters. The
SPSD II - Part 2 - Global change, Ecosystems and Biodiversity 15
standards used in EC directives (e.g. CD 98/83/EC) are generally based on the WHO’s guidelines (e.g. 1 µg/L microcystin-LR drinking water). So, in the future, it will be mandatory to dispose of the adequate methodologies to measure the cyanotoxin concentrations in drinking water and to determine the efficiency of water treatment processes. Not only drinking water but also recreational waters should be monitored. In 2003, there was no Belgian laboratory which had yet developed routine analytical methods for cyanotoxin analysis.
Components of the B-BLOOMS project
The project was based on environmental monitoring, screening and analysis of algal samples for pheno- and genotypic identification of nuisance algae, detection and identification of cyanobacterial toxins, and development of a model for prediction of nuisance blooms.
Two types of samples were studied. The first one came from 4 reference lakes (Blaarmeersen lake in Flanders and three pre-dam lakes of Eau d’Heure in Wallonia) that were monitored intensively for 2 years. The second set of samples was sporadic and consisted of bloom samples brought by scientists and members of BLOOMNET. BLOOMNET was a first attempt to build a network of persons able to inform us about the development of blooms and, ideally, able to take samples for us and process them for our analyses. Therefore, we have produced a bilingual video about sampling and further handling of samples for B-BLOOMS’ analyses. The persons who contributed to BLOOMNET were mainly employees of environmental administrations and ministries (Vlaamse Milieu Maatschappij [VMM], Institut Bruxellois de Gestion de l’Environnement [IBGE], Région Wallonne [RW], Police de l’environnement...) and members of associations linked to water activities (fishermen, bird watchers, etc). This network also has contributed to raise the awareness of water managers, to better estimate the situation and the global incidence of blooms. The purpose of the network was to store all information in a database (BLOOMBASE), so that it could be used to construct a predictive ANN model (BLOOMODEL).
Molecular markers for taxonomic identifications were used to determine the genotypes in local samples in order to test and improve the specificity and sensitivity of molecular tools for bloom characterization and monitoring. The toxigenicity (presence of mcy genes, revealed by PCR) was used to screen the samples and select those that would be subjected to more costly and time-consuming analyses (PPIA assay and HPLC) for the toxins themselves. These two analyses were carried out by a sub-contractor (CRITT-BioIndustries, France) and at the end of the project, by the laboratory of Namur.
SPSD II - Part 2 - Global change, Ecosystems and Biodiversity 17
M
ATERIAL AND METHODS1. Monitoring of reference lakes in Wallonia and Flanders
1.1. The reference lakes: the 3 pre-dam lakes of Eau d’Heure and Blaarmeersen
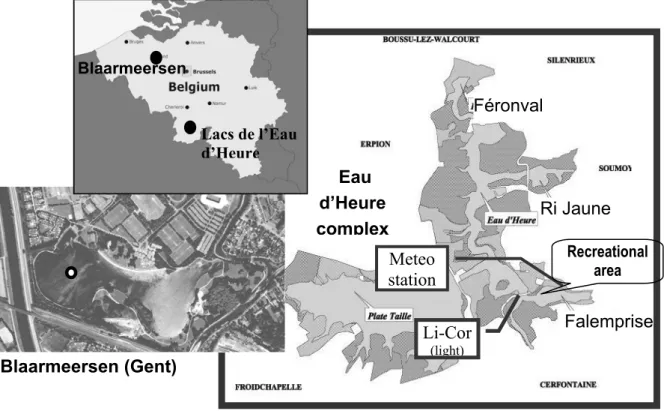
In Wallonia, the 3 eutrophic pre-dam lakes of the Eau d’Heure complex have been sampled in 2003 and 2004 as reference lakes for the B-BLOOMS project, while the Blaarmeersen lake was chosen in Flanders and sampled during the same period (figure 1).
In addition to the opportunity of exploiting data from a relatively dense monitoring program, the 3 pre-reservoirs of the Eau d’Heure complex were selected because they are eutrophic lakes prone to stratification where algal blooms were likely to occur. They are also important recreation sites in Wallonia, where few water bodies are accessible to the public for recreational activities (swimming, boating, fishing). One of these lakes (Falemprise) is an official swimming area, submitted to microbiological control according to the existing EC directive. However, despite the potential risks for the human population linked to the possibility of toxic cyanobacteria
development, phytoplankton in these 3 lakes was not monitored by the Walloon
authorities.
Similarly, Lake Blaarmeersen was chosen as reference site for Flanders because of its high socio-economical value (recreation) to the local community and because it was found susceptible to the development of surface blooms due to eutrophication. Surface blooms of cyanobacteria (Anabaena sp.) had already been observed in summer (June 1998).
1.1.1. Description of the Eau d’Heure lakes
The building of the Eau d’Heure dams started in 1971 and ended up in 1979. They are situated in the Eau d’Heure valley, between Cerfontaine and Silenrieux, about 20 km south of Charleroi (figure 1). The complex comprises 5 water bodies: the two main ones are related to the two main dams of Plate Taille and Eau d’Heure; the three others are pre-dams reservoirs of Falemprise, Ri Jaune and Féronval, built at the origin to limit the daily level fluctuations. They are also now devoted to several recreational and touristic activities. The whole complex represents 72 km of banks and a surface area of 600 ha. The pre-dam lakes are fed by rivers draining agricultural areas and receiving treated domestic sewage (see Verniers & Sarmento 2004 for details).
Nutrient inputs come mainly from agriculture and livestock, reach the lakes
through surface and groundwater, and result in substantial eutrophication of the lakes. The water and ecosystem quality is particularly degraded in Falemprise and
SPSD II - Part 2 - Global change, Ecosystems and Biodiversity 18
Féronval, classified as poly-eutrophic lakes, while Ri Jaune is considered as meso-eutrophic. In the last 20 years, eutrophication has increased in the 3 lakes (Dehavay 1981, Verniers & Sarmento 2004). Cyanobacterial blooms have been observed in several occasions in the three pre-dam lakes (Verniers & Sarmento 2004).
1.1.2. Description of lake Blaarmeersen
Lake Blaarmeersen is a temperate, monomictic lake situated at the outskirts of the city of Gent in between the river Leie, the Watersportbaan, a canal, created in 1955, to improve water sports and the Ringvaart, another canal (figure 1). It is composed of two basins. It has a maximal length and width of 800 and 250 m, respectively, and a maximal depth of 15 m. The lake is fed only with rain and groundwater but connections with the Leie and the Ringvaart exists to remove some water in excess. It was created between 1974-1976. The sand was used to create a small hill (38 m), which served as an outdoor ski station. From 1982 onwards, the lake is used for recreation purposes (swimming, sailing, fishing and diving).
The biological and chemical parameters from the early history of this lake are well documented in a study of Geysen & Coppejans (1985). At that time the lake
contained alkaline, oligotrophic water with low densities and diversity of phytoplankton and a well developed vegetation of macrophytes. In summer 2003, an extensive vegetation of Nitellopsis obtusa, a very rare macrophyte, which was believed to be extinct in Belgium, was rediscovered in this lake.
Figure 1: Reference lakes : in Flanders, lake Blaarmeersen (Gent), and in
Wallonia, lakes of Féronval, Ri Jaune and Falemprise, in the Eau d’Heure complex
Eau d’Heure complex Féronval Ri Jaune Falemprise Meteo station Li-Cor (light) Recreational area Blaarmeersen (Gent) Lacs de l’Eau d’Heure Blaarmeersen
SPSD II - Part 2 - Global change, Ecosystems and Biodiversity 19
1.2. Sites, sampling occasions and measurements
In Wallonia, the 3 pre-dam lakes of the Eau d’Heure complex have been sampled weekly from February/March to mid-September and then every second week till mid-October/November, at the maximal depth position in each lake (figure 1). The B-BLOOMS project also benefited from the sampling and results obtained in the framework of the “Eau d’Heure Project” (Verniers & Sarmento, 2004).
Phytoplankton samples of Lake Blaarmeersen were taken fortnightly (2003, n = 17) or monthly (2004, n = 11) between February 2003 and December 2004 on two depths (1 m and 8 m), with a vertical point water sampler, at a fixed position in the lake where the water depth is maximal.
In Flanders as in Wallonia, on each sampling occasion, measurements for obtaining vertical profiles of temperature, oxygen, pH and conductivity were carried out. Water transparency was measured with a Secchi disk, and light penetration was also measured using underwater and surface PAR sensors.
At Eau d’Heure, a meteo station was installed at the “Relais de Falemprise” (Eau d’Heure complex) (figure 1) for continuous recording of air temperature, rain, and wind during the sampling period. A Li-Cor system was also installed for recording surface and underwater light, with a 15 min. logging time.
Water samples were taken at different depths in all lakes studied by means of a Van Dorn bottle for nutrient and biotic (phytoplankton, molecular, toxins) analyses, in the epilimnion. Sampling was designed in each lake taking into account the conditions of the water column, which was usually stratified from spring to mid-autumn. Zooplankton samples were taken with a Schindler trap equipped with a 63 µm mesh size plankton net, in the epilimnion. In Blaarmeersen, in summer, the hypolimnion was also sampled. In Eau d’Heure lakes, zooplankton was sampled every second sampling day (once a month) in 2003, and on each sampling occasion in 2004. In Blaarmeersen, zooplankton was sampled fortnightly in 2003 (but monthly in winter) and monthly in 2004.
2. Screening of Belgian lakes for algal blooms by the BLOOMNET
network
The contacts we had for implementing BLOOMNET (workshop and personalized contacts) resulted in different agreements for collaboration and collection of samples.
In 2004, an agreement of monitoring of recreational waters in Wallonia was taken with the Division Générale des Ressources Naturelles et de l’Environnement (DGRNE), Division of water – “Direction des Eaux de Surface” . Monitoring and conditioning of BLOOMNET samples was carried out by the Société Wallonne Des Eaux (SWDE). In addition, other contacts were made occasionally, whenever blooms
SPSD II - Part 2 - Global change, Ecosystems and Biodiversity 20
were noticed, at the initiative of the B-BLOOMS teams or by diverse people from universities, institutes, administration and natural reserves. In Flanders, most of the samples were taken by the UGent team and some by BLOOMNET (Vlaamse Vereniging van Hengelsportverbonden [VVHV], Provinciale Visserij Comissie [PVC], Vlaamse Milieu Maatschappij [VMM], Instituut voor Natuur- en Bosonderzoek [INBO] and the BELSPO MANSCAPE project) and came from a wide variety of surface waters, most of them relatively small (fishing and urban ponds)
3. Pigment analysis
In Wallonia, High Performance Liquid Chromatography (HPLC) analyses have been carried out on algae samples, both for reference lake monitoring and BLOOMNET samples. Water samples were processed as in Descy et al. (2005), allowing estimating chlorophyll a (Chl a) biomass of Chlorophytes, Chrysophytes, diatoms, Cryptophytes, dinoflagellates and cyanobacteria T1 and T2 expressed in Chlorophyll a equivalents. Although the distinction of the two types of cyanobacteria was based solely on pigment composition, cyanobacteria T1 corresponded usually to coccoid forms (unicells or small colonies) while cyanobacteria T2 corresponded mostly to larges colonies or filaments. In Flanders, only total algal biomass (Chlorophyll a) was determined by HPLC analysis of acetone extracts obtained as described above.
4. Microscopic identifications
For Blaarmeersen, phytoplankton counts were made under microscope at 400 X, generally at the generic level for non-cyanobacteria and at the species level for cyanobacteria, and converted into biomass. For Eau d’Heure lakes, relative abundance of cyanobacterial species compared to total cyanobacterial biomass (from HPLC) were determined, while global phytoplankton composition was coded in 5 abundance classes.. For BLOOMNET samples, at least specific counts of cyanobacteria were carried out and pictures of taxa were taken.
5. Zooplankton countings and filtration rates
For Eau d’Heure lakes, individuals have been counted under inverted microscope at 100 X (till reaching at least 100 individuals of the dominant taxa). Adult crustaceans and rotifers were identified at the species level, copepods were classified in cyclopoids and calanoids while nauplii were simply counted. Filtration rates were estimated from taxa abundances and mean body length (30 measurements per cladoceran and copepod species, 10 per rotifer species, once a month), using the general formulas of Knoechel & Holtby (1986). For Blaarmeersen, adult cladocerans and rotiferans were counted at the species or genus level and copepods were classified in cyclopoids and calanoids, nauplii and copepodites.
SPSD II - Part 2 - Global change, Ecosystems and Biodiversity 21
6. Studies of the genotypic diversity of bloom-forming
cyanobacteria
6.1. Sampling and DNA extraction
A portion (generally 100 to 400 ml) of the sample was filtered through 0.2 µm Supor filters (Pall Life Science, USA) for molecular analysis, except for lake Blaarmeersen where GSWP-filters were used, and immediately frozen. The Supor filters were conserved in 2 ml lysis buffer (40 mM EDTA, 400 mM NaCl, 0.75 M sucrose, 50 mM Tris (HCl; pH 8.3). The filters were kept frozen at -20°C before analyses.
DNA was extracted from the filters as described by Zwart et al (1998) for Blaarmeersen lake and as described by Boutte et al. (2006) for Eau d’Heure lakes and the additional bloom samples. The DNAs were exchanged between the laboratories of Gent and Liège to enable further analyses based on the same DNA. 6.2. Denaturating Gradient Gel Electrophoresis (DGGE)
16S rRNA gene sequences were amplified using the nested PCR protocol of Zwart et al. (2005). DGGE was essentially performed as described by Muyzer et al. (1993). Equal amounts of PCR products were loaded onto 8% (w/v) polyacrylamide gels (1 mm thick, in 1× TAE [20 mM Tris acetate (pH 7.4), 10 mM acetate, 0.5 mM disodium EDTA]). The denaturing gradient contained 35-60% denaturant [100% denaturant corresponded to 7 M urea and 40% (v/v) formamide]. Electrophoresis was performed for 16 h at 75 V and the temperature was set at 60°C. Finally, the gels were stained with ethidium bromide and photographed on a UV transillumination table with a CCD camera. The most important bands were cut out, purified by DGGE and sequenced. A BLAST search was done to find the most related organisms. Furthermore, the profiles were aligned using the program Bionumerics 3.0 (Applied Maths BVBA, Kortrijk, Belgium). The software performs a density profile through each lane, detects the bands and gives a value to the band intensity. A matrix was compiled based upon the relative contribution of individual bands to the total band signal in each lane. The statistical programs Primer 5 (Clarke & Gorley 2001) and Statistica 6.0 (StatSoft, Inc., 1995) were used to analyse the cyanobacterial community structure.
6.3. Construction of clone libraries
Five samples were used for the construction of clone libraries: Falemprise (01/07/03), Féronval (19/08/03), Blaarmeersen (18/07/03, 1 m depth), Ri Jaune (31/08/04), and one additional BLOOMNET pond (Parc des Sources, Woluwé, Brussels on 22/07/04) DNA of the samples was amplified and cloned as described by Boutte et al. (2005). However, for the first three samples, the forward primer was 16S27F (Taton et al. 2003). Each positive clone was sequenced using primer 1092R
SPSD II - Part 2 - Global change, Ecosystems and Biodiversity 22
(Houzrek et al. 2005). Sequencing reactions were carried out using an ABI Prism system 377 (PE Applied Biosystems, USA) by the company Genome Express (France). Sequences were manually corrected and the chimera were identified with CheckChimera (Cole et al., 2007) and removed.
An alignment was constructed with ClustalW (Thomson et al. 1994) and edited manually with BioEdit (Hall 1999). When duplicate sequences were present, only one was chosen as representative and the number of copies was indicated between brackets. The most similar sequence was found by the option ‘Sequence Match’ of the Ribosomal Database Project (Cole et al. 2007) and added to the alignment, as well as the outgroup Escherichia coli. A phylogenetic analysis was carried out with the construction of a Neighbor-joining tree on a distance matrix corrected with the formula of Jukes and Cantor, using the software TREECON (Van de Peer & De Wachter 1994). Trees were constructed for each clone library as well as for the global dataset. The latter tree was also used for the delineation of OTUs (groups of sequences sharing more than 97% similarity) by DOTUR (Schloss & Handelsmann 2005).
7. Molecular studies of diversity of cyanotoxin genes and design of
tools for monitoring toxins
The samples that were sent to the sub-contractor CRITT-BioIndustries for measurements of microcystins were selected on the basis of the detection of mcyB and mcyE genes.
7.1. mcyE/B detection
DNA of samples was used for PCR reactions with primers mcyF1/mcyR1 and
mcyF1/mcyR2 as described by Nonneman & Zimba (2002) which amplify a fragment
of 320 bp inside the mcyB gene of Microcystis, and with primers mcyE-F2/mcyE-R4
as described by Rantalaet al. (2004) which amplify a fragment of 810 – 812 bp inside
the mcyE genes of several genera (Microcystis, Planktothrix, Anabaena, Nostoc). 7.2. RFLP of mcyE: fast assessment of the identity of the toxin-producer
The mcyE amplicon was submitted to a digestion with the restriction enzyme
AluI. The enzyme was chosen with the tool ‘Restriction analysis of DNA’ on the
website http://insilico.ehu.es/restriction/ as it generated different banding patterns for
Planktothrix, Anabaena and Microcystis. For the latter, two profiles are possible. The
fragments were separated by electrophoresis is a 2% agarose gel (HR agarose, Biotools, Spain) in TAE for 55 mins at 110 V. The gel pictures were digitalized and the size of bands was determined with the software GelCompar 2 (Applied Maths, Belgium).
SPSD II - Part 2 - Global change, Ecosystems and Biodiversity 23
8. Determination and measurement of toxins
8.1. Handling of samples for microcystins measurements
The samples were handled differently in Flanders and Wallonia. In Blaarmeersen, depending on the bloom density, some scum material (50-250 ml) was taken in a sterile Falcon tube or concentrated on a phytoplankton net (mesh size 10 µm). In all cases, 1 L-samples were taken to the laboratory to collect the algal material on filters. For the Eau d’Heure lakes and the few Walloon BLOOMNET samples, there was no concentration of the algal samples in the field and the water samples were taken to the laboratory for filtrations. In the laboratory, 5 to 250 ml of water were filtered on GF/C filters (Whatman, USA), till the filters were clogged. The filters were folded in two, wrapped in aluminium foil, and frozen at –20°C in the laboratory. Three to four filters were obtained for each sample.
In Flanders, bloom samples (n = 104) from BLOOMNET were collected in the littoral zone with a bucket from which sub-samples for microscopical enumeration and toxin analysis were taken (in general not concentrated). In a few cases, tubes were filled directly from the scum layer. In the laboratory, scum samples and concentrated samples were all lyophilized in Petri dishes with a Lyotrap freeze-drying machine (LTE Scientific LTD.) overnight (about 12 hours). Before freeze-drying, the volume of the samples was noted. Afterwards, the material was weighted, put in Falcon tubes and stored in a deepfreeze at –20°C.
During transport to CRITT-BioIndustries for toxin analyses, the material was
kept frozen on dry ice. For the transport from Gent to Namur, it was maintained
refrigerated.
8.2. Measurements of microcystins at CRITT-BioIndustries (Toulouse, France)
Both protein phosphatase (PP2A) inhibition assay and measurement of microcystins by HPLC-DAD were carried out. For PP2A and HPLC-DAD, ca 40 mg of lyophilized biomass (or each filter) was extracted three times in methanol/water (75:25) with sonication. The extracts were pooled, filtered (0.2 µm pore diameter), evaporated under nitrogen flux and the dry extract was dissolved in 500 µL of methanol/water (20:80).
For the PP2A assay, the extracts were incubated with phosphatase and the colorless substrate, para-nitrophenyl phosphate. In function of the intensity of the yellow color measured by spectrophotometry at 405 nm, the quantity of inhibitor present was estimated, expressed as equivalent microcystin-LR. This molecule (Alexis Biochemicals, USA) was used to calibrate the test.
The microcystins-LR and -RR were measured by HPLC-DAD. HPLC was carried out according to the method of Lawton et al. (1994). The column Symmetry
SPSD II - Part 2 - Global change, Ecosystems and Biodiversity 24
C18 (5-150 x 3.9 mm, 5 µm) was used (Waters, USA) with a water/acetonitrile
gradient, both acidified with 0.05 % TFA (trifluoroacetic acid). The HPLC instrumentation was a Dionex system (USA) with a ASI-100 sample injector, a P680 pump and a UVD 340U detector. The chromatograms were evaluated at 238 nm. The threshold for quantification was 5 µg/g of dry matter.
8.3. Measurements of microcystins at FUNDP
Samples were extracted either from material collected on filters, or from bulk bloom samples, with 80 % methanol. These extracts were evaporated by centrifuge evaporation at 35˚C and redissolved with 100 % methanol. Extracts were kept at -20˚C until the assay or the HPLC analysis were carried out.
Both protein phosphatase (PP1) inhibition assays and measurements of microcystins by HPLC-DAD were carried out. The PP1 assay was adapted from the colorimetric method of Heresztyn & Nicholson (2001). Protein phosphatase 1 activity was determined by spectrophotometric measurement of para-nitrophenol from the substrate para-nitrophenyl phosphate.
Prior to HPLC analysis, the extracts were purified using hydrophilic-lipophilic balanced cartridges Oasis HLB (Waters, USA), following Rapala et al. (2002). HPLC analysis of the toxins was carried out according to Lawton et al. (1994). The HPLC instrumentation consisted of a Waters system (USA) with Model 600 solvent pump, Model 717 plus autosampler, and a Model 996 photodiode array detector. Chromatograms were evaluated at 238 nm. Analyses were performed on a
Symmetry C18 column (250 x 4.6 mm I.D., 5 μm, Waters) with a water/acetonitrile
gradient, both acidified with 0.05 % v/v TFA. Microcystin standards (MC-LR, MC-RR and MC-YR) were purchased from Alexis Biochemicals (USA) and standard solutions were prepared with 100 % methanol. The detection limit for lyophilized biomass was ca 5 µg/g of dry matter.
8.3. Analyses of anatoxin-a at CRITT-BioIndustries (Toulouse, France) 40 mg of lyophilized biomass was suspended in 1.5 ml of acetic acid (0.05 M), vortexed 5 times 1 min with glass beads and centrifuged. This extraction was repeated 3 times. All supernatants were pooled and filtered (0.2 µm pore diameter) and stored frozen at –20°C till analysis. The measurement was realised by HPLC-DAD. The instrumentation was the same as for the microcystin measurements. Chromatograms were evaluated at 227 nm. Analyses were performed on a
Symmetry C18 column (5-150 x 3.9 mm, 5 µm, Waters) with a gradient of NaH2PO4
4.5 mM + H3PO4 0.5 mM (pH 3.5)/acetonitrile. The standard was anatoxin-A fumarate
SPSD II - Part 2 - Global change, Ecosystems and Biodiversity 25
9. Data processing: multivariate analyses and artificial neural
network
9.1. Prediction of cyanobacteria in Eau d’Heure pre-dam lakes
Data from 2002 to 2004 from the pre-dam lakes of Eau d’Heure were gathered in the final data processing. From measured variables, new descriptors were calculated that could be useful for the prediction of cyanobacteria bloom occurrence (Table 1). Data were validated, and whenever necessary, missing values were interpolated.
Table 1 – Environmental variables taken into account for global analyses of data from the 3
pre-dam lakes of Eau d’Heure (multivariate analyses and Artificial Neural Network).
Variables Codes
Soluble reactive phosphate (µg P-PO43- l-1) SRP
Silica (mg Si l-1) Si
Inorganic dissolved nitrogen [NO3-, NO2-, NH4+] (µgN l-1) DIN
Total phosphorus [SRP, Ppart.] (µgP l-1) TP
Total nitrogen [NO3-, NO2-, NH4+, Npart.] (µg N l-1) TN
Particulate carbon (µg C l-1) Cpart
Photic depth (m) Zeu
Solar radiation (average on the period 11h-14h of the day ; µEm-2s-1) I0
Temperature of the epilimnion (°C) TempE
Dissolved oxygen (%) O2
pH (mean of the epilimnion) pH
Conductivity (mean of the epilimnion ; µS cm-1) Cond
Mixing depth (m) Zm
Photic depth vs. mixing depth Zeu/Zm
Number of days with stratification NJS
Photoperiod (h) Photop
Air Temperature (average on the week prior to sampling ; °C) TempO Difference between maximum and minimum air temperature of the week (°C) Dif temp Relative humidity (average on the week prior to sampling ; %) Hum
Wind speed of the day prior to sampling (ms-1) VVJP
Wind speed (average on the 7 days prior to sampling ; m s-1) WS_7j
Wind speed (average on the 3 days prior to sampling ; m s-1) WS_3j
Number of days without a wind of 4.3 m s-1 or higher NJV<4.3
Number of days without a wind of 5.0 m s-1 or higher NJV<5.0
Rain (sum of the week ; mm) Précip
Number of large cladocerans (ind l-1) N_Gclado
Number of small cladocerans (ind l-1) N_pClado
SPSD II - Part 2 - Global change, Ecosystems and Biodiversity 26
Number of cyclopoids copepods (ind l-1) N_Calan
Number of nauplii (ind l-1) N_Naupl
Number of rotifers (ind l-1) N_Rotif
Number of total zooplankton (ind l-1) N_tot
Filtration rate of the large cladocerans (% j-1) F gd Clado
Filtration rate of the small cladocerans (% j-1) F pt Clado
Filtration rate of the calanoids copepods (% j-1) F Cala
Filtration rate of the cyclopoids copepods (% j-1) F Cyclo
Filtration rate of the nauplii (ml j-1) F Naupl
Filtration rate of the rotifers (% j-1) F rotif
Total filtration rate (% j-1) F tot
9.1.1. Multivariate analyses
Prior to analyses, data were transformed in order to fit as far as possible with a normal distribution. Data processing was carried out using Principal Component Analysis (PCA) and Detrended Correspondence Analysis (DCA), with the Canoco v.4.0 (ter Braak & Smilauer 1998) and the ADE softwares (Chessel et al. 2004). In order to explore relationships between environmental variables and phytoplankton composition, canonical correspondence analyses (CCA) were performed. The biological data matrices included either algal group biomasses (from HPLC analyses; 210 observations) or cyanobacterial species relative composition (116 observations). The environmental data matrix comprised the physical and chemical descriptors, from lake water column and meteorological measurements. A second environmental data matrix included also zooplankton numbers and filtration rates. In this last case, the number of observations was lower, owing to the lower number of zooplankton data (109 and 96 observations, for matrices corresponding to algal groups and relative abundances, respectively).
9.1.2. Artificial Neural Network
Artificial Neural Network models (ANNs) were employed to predict cyanobacterial biomass (expressed in Chlorophyll a equivalents) from environmental variables (see Table1). ANNs have proved to be efficient in ecological modelling (Lek & Guégan 1999, Lek et al. 2004) and especially in predicting phytoplankton succession (Olden 2000). The output variables were either total cyanobacterial biomass, or cyanobacteria T1 and T2 biomass.
We used a supervised ANN (Lek & Guégan 1999) with a back propagation algorithm (Rumelhart et al. 1986). The architecture of the network consists of input, hidden and output layers with a one-way flow of information. The input layer of neurons represents the independent environmental variables (Table 1) and the output layer is a single neuron that represents the dependent variable (i.e. cyanobacteria biomass). The number of neurons of the hidden layer (10) and the
SPSD II - Part 2 - Global change, Ecosystems and Biodiversity 27
number of iterations for the back-propagation algorithm (500) were selected to optimize the accuracy of the model and minimize trade-off between network bias and variance. To standardize the scale of measurement, independent variables were centred and reduced to range between 0 and 1.
Models were validated by the leave-on-out cross-validation test (Efron 1983). This test consists in training k ANN models (i.e. k=number of observations), each time leaving out one observation, and using only the omitted observation to test prediction capabilities of the model. Model predictive efficiency was assessed using regression analysis and especially the correlation coefficient between the observed and estimated cyanobacteria biomass. Finally, the contributions of the environmental variables to the ANN models were determined by using the connection weight procedure (Olden & Jackson 2002, Olden et al. 2004). This ANN application was conducted in collaboration with F. Leprieur, University Paul Sabatier, Toulouse (France).
SPSD II - Part 2 - Global change, Ecosystems and Biodiversity 29
RESULTS
AND
DISCUSSION
1. Monitoring of the pre-dam lakes of the “Eau d’Heure” complex
1.1. Cyanobacterial blooms in Eau d’Heure lakes: data analysis and prediction modelsCyanobacterial blooms were regularly observed in the Eau d’Heure lakes during this study. They comprised various taxa, the most important being
Aphanizomenon flos-aquae, which was particularly well developed in Lake
Falemprise. In the other lakes, blooms were generally composed of several coccoid taxa. Details on abiotic conditions and phytoplankton successions can be found in Verniers & Sarmento (2004). Here we focus on the data analysis and on the development of prediction models of cyanobacteria blooms.
1.1.1. Multivariate analyses
The DCA on algal groups and cyanobacteria taxa (not shown) showed the distinction between lakes, with cyanobacteria T2, and mainly Aphanizomenon, more characteristic of Falemprise, while cyanobacteria T1, with Aphanothece,
Aphanocapsa, Coelosphaerium and Cyanogranis liberia appeared more associated
with Ri Jaune.
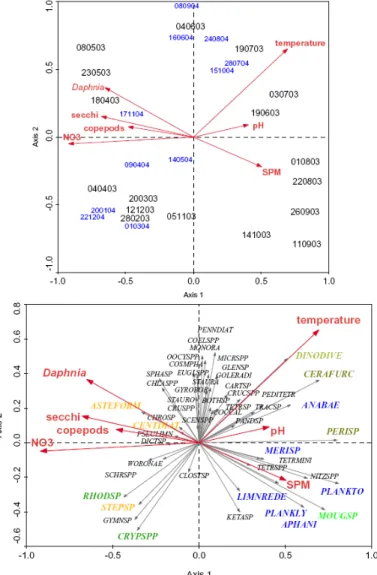
The PCA did not distinguish the years but clearly showed a temporal seasonal gradient (figure 2). As expected, wind speed was higher in spring, as were dissolved and total nitrogen concentrations. The lakes were well oxygenated in late spring, presenting lower values in autumn, at the time of deepening of the mixing layer. A well illuminated mixed layer was characteristic of early summer, while number of days without strong winds is maximal at the end of summer. Lakes were slightly discriminated according to trophic status (not shown).
As shown in figure 3, variables of importance for phytoplankton composition are related to season and stratification (axis 1: temperature, photoperiod, days without high wind), and to nutrient concentrations (axis 2). Environmental conditions favouring cyanobacteria T1 and T2 differed: both developed at high temperature and stable stratification, but T1 appeared when SRP was relatively low and DIN relatively high, contrary to T2 which developed at higher SRP concentrations but at low DIN. When considering zooplankton (not shown), the number of large cladocerans seemed associated with T2, while high filtration rates of small cladocerans were associated with T1 cyanobacteria. Nevertheless, those results are to be taken with caution due to the small size of data matrices when considering zooplankton.
Project EV/34 “Algal blooms: emerging problem for health and sustainable use of surface waters (B-BLOOMS)
SPSD II - Part 2 - Global change, Ecosystems and Biodiversity 30
Figure 2: PCA on environmental variables (above, without zooplankton) from the 3 pre-dam
lakes of Eau d’Heure, from 2002 to 2004. Below: Projection of centroids of months (all years and lakes together).
SRP Si DIN TN TP Cp Zeu Io TempE O2mg O2%pH Cond Zm Zeu/Zm NJS Photop TempO diftemp Hum WS_7j WS_3j VVJP NJV.4.3 NJV.5.0 Rain Temporal gradient SRP Si DIN DIN TN TN TP Cp Zeu Io TempE O2mg O2%pH Cond Zm Zeu/Zm NJS Photop TempO diftemp Hum WS_7j WS_3j WS_3j VVJP VVJP NJV.4.3 NJV.5.0 Rain Temporal gradient Temporal gradient d = 2 2 3 4 5 6 7 8 9 11 10 d = 2 2 2 3 3 4 4 5 5 6 6 7 7 8 8 9 9 11 11 10 10 SRP Si DIN TN TP Cp Zeu Io TempE O2mg O2%pH Cond Zm Zeu/Zm NJS Photop TempO diftemp Hum WS_7j WS_3j VVJP NJV.4.3 NJV.5.0 Rain Temporal gradient SRP Si DIN DIN TN TN TP Cp Zeu Io TempE O2mg O2%pH Cond Zm Zeu/Zm NJS Photop TempO diftemp Hum WS_7j WS_3j WS_3j VVJP VVJP NJV.4.3 NJV.5.0 Rain Temporal gradient Temporal gradient d = 2 2 3 4 5 6 7 8 9 11 10 d = 2 2 2 3 3 4 4 5 5 6 6 7 7 8 8 9 9 11 11 10 10
SPSD II - Part 2 - Global change, Ecosystems and Biodiversity 31
Figure 3: CCA ordination biplots of the algal groups (dots) at the 3 pre-dam lakes of Eau
d’Heure for the growing season of 2002 to 2004. Arrows indicate the environmental variables; legend as in table 1.
1.1.2. Prediction through Artificial Neural Network
Prediction of total cyanobacteria biomass (expressed in Chl a equivalent) gave good results: regression between predicted and observed values, carried out through
leave-one-out method, reached a correlation coefficient of 0.95 (data not shown).It is
to be noted that the position of the highest observed value, out of the regression line, is to be related to the leave-one-out validation method: when removed from the data matrix, this value is difficult to be predicted by the model as it is out of the data range. The contribution of variables to the prediction is shown on figure 4, e.g. low values of TN contribute for 10.3% to cyanobacteria biomass, while high TP contributes for 9.7%. The highest contributions are from chemical and meteorological variables. When considering only the 10 variables contributing for at least 5%, the predicted values reached a correlation of 0.94, when compared to observed values (not shown)
When predicting separately cyanobacteria T1 and T2, the correlations of the relationship between predicted and observed biomass were 0.93 and 0.95, respectively (not shown). It is interesting to note, in this case, the varying contribution
of the variables according to the cyanobacterial type (figure 4). As already seen in
the CCA, the predictive model confirms the role of light for determining the biomass
NJV<4.3 TP SRP Cond TN DIN TempO Photop Axe 1 -0.8 -0.6 -0.4 -0.2 0.0 0.2 0.4 0.6 0.8 Ax e 2 -0.8 -0.6 -0.4 -0.2 0.0 0.2 0.4 0.6 0.8 CyanoT2 Dino CyanoT1 Diat Crypto ChrysoEugleno Chla
Chloro
29.5%
SPSD II - Part 2 - Global change, Ecosystems and Biodiversity 32
of the cyanobacteria T1, while nutrients are the best predictors for cyanobacteria T2; both types need stable stratification and high temperature. Again it is interesting to note that the best predictors are limnological or meteorological variables, which can be monitored easily.
Figure 4: Contribution of variables to the prediction of (A) cyanobacteria T1 biomass, and (B)
cyanobacteria T2 biomass, in the 3 pre-dam lakes of Eau d’Heure, for the growing season 2002 to 2004.
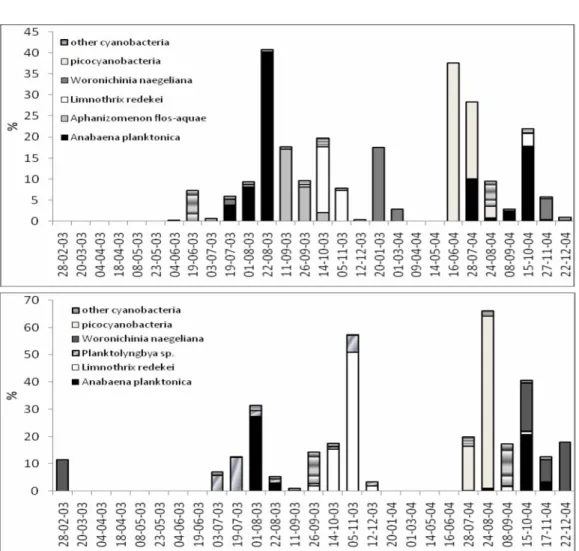
1.3. Monitoring of Lake Blaarmeersen
1.3.1. The phytoplankton dynamics in Lake Blaarmeersen
Highest concentrations of dissolved nutrients were observed in autumn and winter when organic matter became mineralised and the water column was mixed till the bottom. During summer, dissolved nutrients became depleted in the epilimnion.
In comparison with historical data from 1983 (Geysen & Coppejans 1985), the amount of nutrients has increased, and this has led to a higher algal productivity, also reflected in the pH data which has increased of 1 unit in general. The phytoplankton species composition has also changed over time. Taxa which are more typical for eutrophic conditions became more abundant or replaced the original flora. In general, the abiotic changes were favouring cyanobacteria and green algae.
0% 2% 4% 6% 8% 10% 12% 14% 16% Io Ze u Te m pE NJ V < 4. 3 NJ V < 5. 0 W S _7j Zm di f te m p SR P TN P hot op W S _3j TP TP /T N NJ S Si Pr éc ip Hu m VVJ P Z eu/ Z m Te m pO C ond 0% 2% 4% 6% 8% 10% 12% 14% 16% Si TP TN Pr éc ip VVJ P NJ V < 4. 3 Te m pE di f te m p Io P hot op TP /T N Zm Hu m W S _3j NJ S C ond W S _7j NJ V < 5. 0 Te m pO Zeu Z eu/ Z m SR P A B
SPSD II - Part 2 - Global change, Ecosystems and Biodiversity 33
A redundancy analysis (RDA, figure 5) including as explanatory variables nitrate concentration, temperature, Daphnia abundance, Secchi-depth, suspended particulate matter (SPM), cyclopoid copepod abundance and pH explained almost 61 % of the variance of phytoplankton data. Mainly seasonality separates the samples.
Figure 5: RDA biplots of phytoplankton data (samples at top, species at bottom) and
forward-selected explanatory variables for axes 1 (eigenvalue 0.219) and 2 (eigenvalue
0.098).
Winter and spring samples are positioned at the left of the ordination diagram and summer and autumn samples on the right. The summer samples are positively correlated with temperature, pH and SPM, spring and winter samples are positively related with Secchi-depth, nitrate and grazers (Daphnia and cyclopoid copepods).
Fast-growing cryptophytes (Rhodomonas, Cryptomonas) and diatoms
(Stephanodiscus), and large colonial diatoms (Asterionella) dominate in spring, during the clear water phase. This typical spring clear water phase, visible when the amount of SPM was lowest and Secchi depth and euphotic depth were maximal, was most probably induced by the high grazing pressure on phytoplankton by large