Venus O
2
nightglow observations with VIRTIS/Venus
Express
A. Migliorini (1), G. Piccioni (1), J.C. Gérard (2), T. Slanger (3), R. Politi (1), M. Snels (4), F. Nuccilli (1), and P. Drossart
(5)
(1) IAPS-INAF, Rome, Italy, (2) LPAP, University of Liège, Liège, Belgium, (3) MPL, SRI International, Menlo Park, CA, (4) ISAC-CNR, Rome, Italy, (5) LESIA, Observatoire de Paris, France ([email protected])
Abstract
The oxygen nightglow emissions in the visible spectral range are known since the early observations with the Venera spacecrafts. Recent observations with the VIRTIS instrument on board Venus-Express allowed to re-detect the Herzberg II system of O2. In particular, the (0-7), (0-8), (0-9), (0-10), and (0-11) bands of the Herzberg II system have been observed in the limb data. These bands peak at about 95 km, with a mean total integrated intensity of about 200 kR. Moreover, 3 bands of the Chamberlain system, centred at 0.56 µm, 0.605 µm, and 0.657 µm were also detected.
For the first time, the O2 nightglow emissions were investigated simultaneously in the visible and in the IR spectral range, reporting a good agreement of the peak altitude values for the Herzberg II and the O2(a1Δg-X3Σ-g) band.
Finally a 1-D atmospheric model was applied in order to interpret our results. The model, starting from realistic O and CO2 vertical distribution, allows to well reproduce the observed profiles for the O2 systems both in the visible and IR spectral ranges.
1. Introduction
The first observation of the c-X Herzberg II and
A0-a Chamberlain systems of the O2 was performed
by the Venera 9 and 10 spacecraft [1,2]. It was subsequently confirmed after laboratory experiments [3,4].The Herzberg II sequence of bands was recently observed using the visible channel of VIRTIS (Visible and InfraRed Thermal Imaging Spectrometer), the imaging spectrometer on board the European mission to Venus, Venus-Express [5]. A total of 128.4 kR was reported by Garcia-Munoz et colleagues for the summed intensity of bands ν”= 6-11. Due to the weakness of these bands, the vertical profile was not derived in the available data, but it was pointed out that the emission intensity was stronger at about 95±1 km height, as shown on figure
4 in the paper by [5]. About the Chamberlain system, there is no indication about the altitude where the maximum emission occurs.
An extension of the previous work by Garcia-Munoz
et colleagues [5] about the detection of the O2
nightglow emissions in the Venus atmosphere is provided in the present work, by using VIRTIS/Venus Express data, acquired during a recent observing campaign at limb.
2. Results
For each of the detected Herzberg II bands, the integrated radiance was obtained, by considering the wavelength ranges 0.45-0.46 µm for the (0-7) transition, 0.48-0.5 µm for the (0-8), 0.526-0.53 µm for the (0-9), 0.56-0.57 µm for the (0-10), and the range 0.61-0.615 µm for the (0-11) bands respectively. The continuum was estimated from adjacent bands and subtracted in each case. Spectra were selected in altitude in the range 90-120 km, for each acquired VIRTIS image, and divided into 2-km bins. Spectra in each altitude bin were averaged and displayed versus altitude.
The tangent profiles were then fitted with a Gaussian curve at first order to derive the peak altitude and the full width at half maximum (FWHM). On average, the tangent altitude is close to 95 km for the 5 bands, with a FWHM ranging from 7 to 9 km.
The same procedure was applied to the detected Chamberlain bands, in order to study the vertical profile of these emissions. The maximum of emission is observed above 100 km.
The results about the Herzberg II bands are in great agreement with the atmospheric O2(a1Δg-X3Σ-g) bands in the IR range [6]. A statistical investigation reveals that their emission is maximum at 95.0 ±2.4 km [6] in limb view.
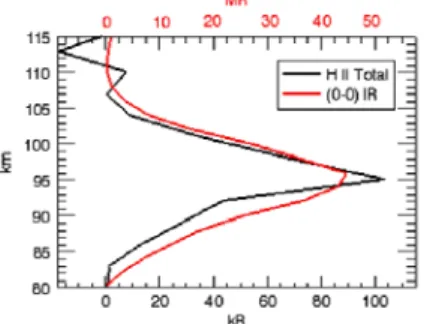
In figure 1 a comparison between the simultaneous observations of the O2 nightglow in the visible and IR is shown, for the limb image acquired on 04-03-2007. The intensity of the emission in the visible is reported on the bottom x axis, while the value for the EPSC Abstracts
Vol. 7 EPSC2012-472 2012
European Planetary Science Congress 2012 c
IR (0-0) band is reported in the top x axis. A good agreement for the peak altitude at limb is shown in the analyzed case.
Figure 1: Profile of O2 Herzberg II system compared to the (0-0) (a1Δ
g-X3Σ-g) band in the IR range (limb image acquired by VIRTIS on 04-03-2007). A good agreement in the altitude peak is found.
A 1-D model was applied to the VIRTIS data [7]. It considers the density distribution of CO2 and oxygen retrieved from Venus Express measurements, with SPICAV and VIRTIS [8] respectively. The results are encouraging, as the model allows to well reproduce VIRTIS observations of the emissions both in the visible and IR spectral ranges.
3. Conclusions
We discussed the properties of the O2 Herzberg II and Chamberlain band systems, observed in the Venus atmosphere by VIRTIS/Venus Express.
The presented results allow to improve our knowledge about the minor species in the Venus atmosphere. With the information coming from the vertical profiles of these band systems, we have a great improvement of the knowledge of the vertical structure and hence of the dynamical properties of the night side atmosphere of Venus.
With the 1-D model, applied to our data, we are able to better understand the upper mesosphere of Venus.
Acknowledgment
The authors thank ESA, ASI, and all the national agencies which support the Venus Express project. The research was funded by ASI (ASI grant ASI-INAF I/050/10/0).
References
[1] Krasnopolskii, V.A., Krysko, A.A., Rogachev, V.N., Parshev, V.A., 1977. Spectroscopy of the night-sky luminescence of Venus from the interplanetary spacecraft Venera 9 and 10, Cosmic Research, 14, p. 687-692. [2] Krasnopolsky, V.A., 1983. Venus spectroscopy in the 3000-8000 Å region by Veneras 9 and 10, in Venus, edited by D.M. Hunten et al., pp. 459-483, Univ. of Ariz. Press, Tucson.
[3] Lawrence, G.M., Barth, C.A., Argabright, V., 1977. Excitation of the Venus night airglow, Science, 195, p. 573-574.
[4] Slanger, T.G., 1978. Generation of O2/c 1Sigma u-, C 3Delta u, A 3Sigma u+/ from oxygen atom recombination, J.Ch.Phys, 69, p. 4779-4791.
[5] Garcia-Munoz, A., Mills, F.P., Slanger, T.G., Piccioni, G., Drossart, P., 2009. Visible and near-infrared nightglow of molecular oxygen in the atmosphere of Venus, JGR, 114, E12002, doi: 10.1029/2009JE003447
[6] Piccioni, G., Zasova, L., Migliorini, A., Drossart, P., Shakun, A., Garcia Munoz, A., Mills, F.P., Cardesin-Moinelo, A. 2009. Near-IR oxygen nightglow observed by VIRTIS in the Venus upper atmosphere, JGR, 114, E00B38, doi: 10.1029/2008JE003133.
[7] Gérard, J.C., Soret, L., Migliorini, A., Piccioni, G., and Drossart, P., 2012. The oxygen nightglow emissions of Venus: Vertical distribution and role of collisional quenching, EGU meeting, 23-28 April 2012.
[8] Soret, L., Gérard, J.C., Montmessin, F., Piccioni, G., Drossart, P., Bertaux, J.L., 2012. Atomic oxygen on the Venus night side: Global distribution deduced from airglow mapping. Icarus, 217, p. 849-855.