HAL Id: hal-00327817
https://hal.archives-ouvertes.fr/hal-00327817
Submitted on 24 Mar 2003HAL is a multi-disciplinary open access
archive for the deposit and dissemination of sci-entific research documents, whether they are pub-lished or not. The documents may come from teaching and research institutions in France or abroad, or from public or private research centers.
L’archive ouverte pluridisciplinaire HAL, est destinée au dépôt et à la diffusion de documents scientifiques de niveau recherche, publiés ou non, émanant des établissements d’enseignement et de recherche français ou étrangers, des laboratoires publics ou privés.
Rarity of upper-tropospheric low O3 concentration
events during MOZAIC flights
W. A. H. Asman, M. G. Lawrence, C. A. M. Brenninkmeijer, P. J. Crutzen, J.
W. M. Cuijpers, P. Nédélec
To cite this version:
W. A. H. Asman, M. G. Lawrence, C. A. M. Brenninkmeijer, P. J. Crutzen, J. W. M. Cuijpers, et al.. Rarity of upper-tropospheric low O3 concentration events during MOZAIC flights. Atmospheric Chemistry and Physics Discussions, European Geosciences Union, 2003, 3 (2), pp.1631-1650. �hal-00327817�
ACPD
3, 1631–1650, 2003 Rarity of upper-tropospheric low O3 concentration events W. A. H. Asman et al. Title Page Abstract Introduction Conclusions References Tables Figures J I J I Back CloseFull Screen / Esc
Print Version Interactive Discussion
c
EGU 2003
Atmos. Chem. Phys. Discuss., 3, 1631–1650, 2003 www.atmos-chem-phys.org/acpd/3/1631/
c
European Geosciences Union 2003
Atmospheric Chemistry and Physics Discussions
Rarity of upper-tropospheric low O
3
concentration events during MOZAIC
flights
W. A. H. Asman1, M. G. Lawrence1, C. A. M. Brenninkmeijer1, P. J. Crutzen1, J. W. M. Cuijpers2, and P. N ´ed ´elec3
1
Max-Planck-Institute for Chemistry, Atmospheric Chemistry Division, P.O. Box 3060, 55020 Mainz, Germany
2
Royal Netherlands Meteorological Institute (KNMI), P.O. Box 201, 3730 AE De Bilt, The Netherlands
3
Laboratoire d’A ´erologie (UMR CNRS/UPS 5560) OMP, Universit ´e Paul Sabatier, 14 Avenue Edouard Belin, 31400 Toulouse, France
Received: 8 February 2003 – Accepted: 17 March 2003 – Published: 24 March 2003 Correspondence to: W. A. H. Asman ([email protected])
ACPD
3, 1631–1650, 2003 Rarity of upper-tropospheric low O3 concentration events W. A. H. Asman et al. Title Page Abstract Introduction Conclusions References Tables Figures J I J I Back CloseFull Screen / Esc
Print Version Interactive Discussion
Abstract
Only a few previous observations of very low O3 concentrations in the upper tropo-sphere are available. The aim of this study was to examine the rich MOZAIC data set for more. Flights with at least 25 4 s averaged concentrations less than 8 ppbv at pressures lower than 500 hPa measured using commercial aircraft within the MOZAIC
5
project have been analysed. There are eleven flights that fulfill these conditions (ex-cluding artefacts as discussed below), representing about 0.001% of all measurements during the analyzed period August 1994–December 1997. The low O3events occurred over Southeast Asia, Africa, Brazil and the sea area 200 km east of Florida (US) and were all likely to be associated with transport of air masses from tropical sea areas.
10
These low concentration events occur in the upper troposphere during periods with generally low concentrations. They are not only found over sea, but also over land at pressure levels as low as 179 hPa.
1. Introduction
O3 is central to the oxidizing capacity of the troposphere and is an intensively studied
15
trace gas. For that reason it is important to know and understand the atmospheric dis-tribution of O3. In polluted areas emissions of NOxand hydrocarbons lead to in situ O3 production. In the marine boundary layer far from anthropogenic and biomass burning sources, however, concentrations of NOxare so low that O3is destroyed (Singh et al., 1996). Kley et al. (1996) found not only low concentrations in the marine boundary
20
layer in the equatorial Pacific, but also extremely low concentrations in the upper tro-posphere. While the photochemical lifetime of O3in the tropical marine boundary layer is less than 1 week, it increases rapidly with height to about 1 month at 6 km and 1 year at 10 km (Kley et al., 1996; Lawrence, 1996). For that reason one can expect that sometimes air parcels containing little O3formed in the tropical marine boundary layer
25
ACPD
3, 1631–1650, 2003 Rarity of upper-tropospheric low O3 concentration events W. A. H. Asman et al. Title Page Abstract Introduction Conclusions References Tables Figures J I J I Back CloseFull Screen / Esc
Print Version Interactive Discussion
c
EGU 2003
areas without large changes in concentration, even to mid-latitude areas (Davies et al., 1998). Other possible explanations of very low upper tropospheric O3 concentrations are catalytic destruction of O3 by reactive iodine and bromine species that originate from the marine boundary layer (Kley et al., 1996; Platt, 2000) or O3 destruction as-sociated with the dissolution and dissociation of HO2 in cloud droplets or possibly on
5
the surface of ice particles followed by reaction with O3 (Kley et al., 1996). The last possibility may explain that low upper tropospheric O3 concentrations are sometimes associated with cirrus clouds (Reichardt et al., 1996).
Up to date there has been little systematic information about low O3concentrations in the upper troposphere. The aim of this paper is to make use of the extensive upper
10
tropospheric O3 observations collected by the MOZAIC project to see how frequently low O3levels are encountered in the upper troposphere and to investigate their origin. Within the MOZAIC project (“Measurements of Ozone and Water Vapour by Airbus In-service Aircraft”; Marenco et al., 1998;http://www.aero.obs-mip.fr/mozaic/) automated measurements are made on board five commercial aircraft. The aircraft are measuring
15
the O3 concentration, relative humidity and temperature as a function of the pressure and the geographical position. Very recently also CO and NOxmonitors were installed on board of some of these aircraft. The aircraft are based in Europe and have in the period studied (August 1994–December 1997) being flying to North America (46% of the flights), South America (18%), Africa (6%), Southeast Asia (13%) and China and
20
Japan (16%).
2. Instrumentation
The instrumentation consists of an O3 monitor and a relative humidity/temperature monitor. The inlet for O3 is at 7 cm distance from the skin, towards the front of the aircraft, and is well outside above the aircraft’s boundary layer. It consists of a 6 mm
25
stainless steel tube that is coated on the inner side with teflon. The inlet system is peri-odically checked, cleaned or replaced to prevent destruction of O3by deposits collected
ACPD
3, 1631–1650, 2003 Rarity of upper-tropospheric low O3 concentration events W. A. H. Asman et al. Title Page Abstract Introduction Conclusions References Tables Figures J I J I Back CloseFull Screen / Esc
Print Version Interactive Discussion
in the tube. Pumps are used to pressurise the air to cabin pressure (700 hPa at cruise altitude). A dual beam UV photometer with two separate absorption cells and detectors is located in the electronic compartment within the aircraft and is used to measure O3 (Thermo-Electron, Model 49-103). The response time is 4 s. The photometers operate 180◦ out of phase, i.e. when the first cell contains the zero concentration, the second
5
cell contains the sample or reference concentration and vice versa. The measure-ments are corrected for variations in the light intensity and for variations in pressure and temperature. The detection limit of the system is 2 ppbv and the overall precision is ±(2 ppbv+ 2% of the measured concentration). At cruise level the outside temper-ature is of the order of −50◦C and the pressure is about 200 hPa. When the air used
10
for O3 measurements is brought to cabin conditions (700 hPa, 15◦C) it attains a very low relative humidity due to the large temperature difference. The travel time from the inlet to the O3 sensor is at maximum 2 s at cruise altitude, which strongly limits the possible O3destruction in the line. Zero O3air for the calibration is obtained by leading cabin air over a filter that destroys O3. O3containing air for calibration is generated by
15
a uv lamp. Before takeoff, about every 2 h during the flight and after landing, reference concentrations of 0, 80 and 500 ppbv O3 are measured in order to obtain information on potential drift of the instrument. Recalibration of the instruments in the laboratory shows that only in exceptional cases an instrument drift of more than 1% per year is observed. Detailed information on the O3 measuring system and procedures can be
20
found in Thouret et al. (1998).
The relative humidity and temperature are measured in situ outside the aircraft in a compact airborne sensing device AD-FS2 (Aerodata, Braunschweig, Germany). The sensing elements in this device consist of a capacitative sensor with a hydroactive polymer film (Humicap-H from Vaisala, Finland) and temperature sensor (Pt100
re-25
sistor) and are mounted in an appropriate housing (Model 102 BX, Rosemount Inc., Aerospace Division, USA) with its own inlet (Helten et al., 1998). The signals are fed into a microprocessor-controlled transmitter unit (HMP230, Vaisala, 1993) and trans-ferred to the MOZAIC computer on board the aircraft. The relative humidity and the
ACPD
3, 1631–1650, 2003 Rarity of upper-tropospheric low O3 concentration events W. A. H. Asman et al. Title Page Abstract Introduction Conclusions References Tables Figures J I J I Back CloseFull Screen / Esc
Print Version Interactive Discussion
c
EGU 2003
temperature are calculated from the signals of the sensors. Due to the strong speed reduction in the sensor housing the sampled air is heated by adiabatic compression. The signals are corrected for this effect according to procedures described by Helten et al. (1998). Relative humidity values in excess of 100% are occasionally observed. These are most likely caused by a partial or complete evaporation of hydrometeors due
5
to the adiabatic heating in the sensor housing.
3. Observed low O3concentration periods
MOZAIC measurements from August 1994–December 1997 were examined (7500 flights of on the average about 7 h, or 1000 times around the earth at the equator). We excluded measurements in the lower troposphere by selecting only events with a
10
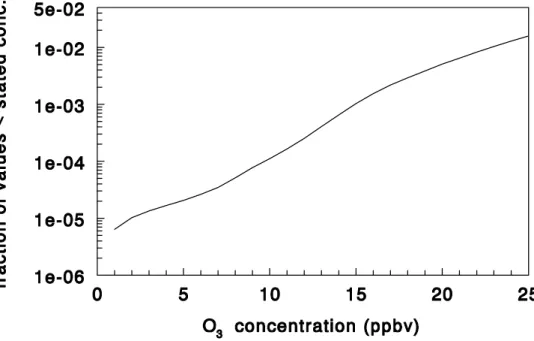
pressure lower than 500 hPa. On the average about 90% of the measurements were taken at pressure levels lower than 500 hPa. It was found that 2.3% of the concentra-tions at pressure levels lower than 500 hPa were less than 26 ppbv, 0.005% were less than 8 ppbv and 0.002% were less than 5 ppbv. Figure 1 shows the fraction of the O3 concentrations at pressure levels lower than 500 hPa which are lower than threshold
15
concentrations of 1 to 25 ppbv; the fraction depends nearly log-linearly on the threshold concentration. It should be noted here, that these statistics include very short periods with low concentrations as well as low concentrations that are caused by artefacts that are discussed below.
What we are interested in are not events with accidental low concentrations, but
20
events with consistently low concentrations during part of the flight, enabling a meteo-rological analysis of this low concentration period. The number of data in the MOZAIC database is so large that not all events with concentrations less than 26 ppbv can be analysed in detail. Minimum modelled concentrations computed for the tropical Pacific upper troposphere are 5 ppbv (Lawrence et al., 1999) and the precision in the MOZAIC
25
O3 measurements is ±2 ppbv at this concentration. To find a reasonable number of flights that could be analysed we experimented with different selection criteria. We
ACPD
3, 1631–1650, 2003 Rarity of upper-tropospheric low O3 concentration events W. A. H. Asman et al. Title Page Abstract Introduction Conclusions References Tables Figures J I J I Back CloseFull Screen / Esc
Print Version Interactive Discussion
finally selected a reasonable number of flights when we chose flights with at least 25 concentration measurements integrated over 4 s below 8 ppbv at pressures below 500 hPa. Measured concentrations of 8 ppbv are still very low and not very different from the reported lowest modelled concentrations of 5 ppbv. We have analysed the data for the period August 1994 to December 1997, for which we also had access
5
to back trajectories. The analysis was for that reason restricted to this period. The selection criteria are to some extent arbitrary, so we could e.g. also have chosen a level of 10 ppbv or a minimum of 10 low concentrations measurements and we would then have to analyse many more events. Not all the selected flights showed periods with consecutive low concentrations. During some flights the concentrations showed
10
high-frequency variations around the 8 ppbv level. These flights were excluded. During other flights there was more than one period with low concentrations and the number of measurements during all these periods was at least 25. Moreover, some events were excluded for which no good humidity and temperature measurements were available for the low O3 concentration part of the flight or for which the concentrations
appar-15
ently were set to 0 ppbv or flights that showed other artefacts, such as a drop the the O3 concentration to low levels during the adjustment following O3 spikes of the type that is discussed in Suhre et al. (1997) . In all 11 flights with low O3 concentrations were selected at the end, of which the low concentration part represents 0.001% of the measurements.
20
To interpret the measurements, five-day 3-D back-trajectories were calculated for 2-minute intervals for each low concentration period and for a period of 1 hr before and after it (Scheele et al., 1996). This can show whether the low concentration period could be associated with changes in the origin of the air mass. A length of five days was chosen for the back- trajectories. Longer period back trajectories are more uncertain
25
and even with five day back trajectories some care has to be taken in particular in convective regions. The data used in the trajectory calculations were 6-hourly data at a 1 by 1 degree spatial resolution from the ECMWF MARS archive. These trajectories describe the effects of convection at a larger scale realistically, but fail in resolving the
ACPD
3, 1631–1650, 2003 Rarity of upper-tropospheric low O3 concentration events W. A. H. Asman et al. Title Page Abstract Introduction Conclusions References Tables Figures J I J I Back CloseFull Screen / Esc
Print Version Interactive Discussion
c
EGU 2003
effects of local convection.
In one case images from the stationary METEOSAT satellite for visible light (VIS; 0.5–0.9 µm), infrared (IR; 10.5–12.5 µm) and water vapour (WV; 5.7–7.1 µm) were used to obtain additional information. The resolution of the images is about 5 km (for IR and WV) and 2.5 km (for VIS) at the subsatellite point, but a lower resolution at other
5
points. Each 30 min a new image is retrieved, which leads to a relatively high temporal resolution (EUMETSAT, 1999).
Detailed information on the 11 flights is presented below, in Table 1 and in Fig. 2. The geographical area mentioned first below is the area where the low concentration event occurred. Unless otherwise indicated the back-trajectories before and after the low
10
concentration event came from about the same pressure level over the same area. Al-though one criterion for the selection of the events was that the pressure should be less than 500 hPa during some events the low O3concentration starts at pressures higher than 500 hPa. In such cases the highest pressure at which the low O3concentrations occurred is mentioned.
15
3.1. Event 5010501 – Sea area 200 km east of Florida (USA)
The low concentration area was encountered while ascending from Miami at a pressure level of 643 hPa. It continued up to 474 hPa (a layer of about 2200 m). The horizontal extension of the area was about 70 km. The relative humidity was often higher than 100%, indicating the presence of clouds, but there was no relation between the O3
20
concentration and the relative humidity. The back-trajectory came over Caribbean sea areas at pressure levels of 500–850 hPa.
3.2. Event 6010206 – Inland Eastern Brazil, 150 km from the coast
The aircraft was leaving from Sao Paulo and from 929 hPa (the lowest height at which measurements are available) up to a pressure level of about 395 hPa (about 7000 m
25
ACPD
3, 1631–1650, 2003 Rarity of upper-tropospheric low O3 concentration events W. A. H. Asman et al. Title Page Abstract Introduction Conclusions References Tables Figures J I J I Back CloseFull Screen / Esc
Print Version Interactive Discussion
of the time. The relative humidity was higher than 100%, indicating the presence of clouds. The back-trajectories indicated that the air came over inland Brazil during the past five days at pressure levels of 400–850 hPa. It is likely that the trajectories more than 5 days back came over the Pacific Ocean.
3.3. Event 6022804 – Inland Eastern Brazil, 15 km from the coast
5
There were two periods with low concentrations. The low concentrations of the first period were observed at pressure levels of 619–453 hPa. The horizontal distance trav-elled during this low concentration period was about 70 km and the vertical distance about 2300 m. The relative humidity was higher than 100% from 687–442 hPa, in-dicating the presence of clouds at about the same pressure interval as the low O3
10
concentrations were observed. The second period occurred at pressure levels of 399– 391 hPa and at a relative humidity of 35–40%. The horizontal distance travelled during this low concentration period was about 13 km and the vertical distance about 130 m. During the first period back-trajectories came at very low speed over sea and further backwards over land at pressure levels of 450–550 hPa. During the second period the
15
trajectory came over the same area at pressure levels of 400–500 hPa. 3.4. Event 6041201 – Sea area east of Thailand and land area of Malaysia
There were three short low concentration periods when the aircraft was flying at cruise level at 217 hPa. The low concentration areas for these periods occurred over dis-tances of 9, 15 and 5 km. The relative humidity was less than 100% during all low
20
concentration periods. During the first two periods back-trajectories came over the Indonesian Archipelago as far as Irian Jaya at pressure levels of 150–250 hPa. Dur-ing the last period the back-trajectories came over Borneo and Celebes (Indonesia) at pressure levels of 200–600 hPa.
ACPD
3, 1631–1650, 2003 Rarity of upper-tropospheric low O3 concentration events W. A. H. Asman et al. Title Page Abstract Introduction Conclusions References Tables Figures J I J I Back CloseFull Screen / Esc
Print Version Interactive Discussion
c
EGU 2003
3.5. Event 6062101 – Malaysia
The aircraft was flying at a cruise altitude of 217 hPa when the low concentration area was encountered and its extension was about 30 km. The relative humidity was less than 100%. The back-trajectories came over the sea area east of Malaysia over the southern Philippines and the sea area east of the Phillipines at levels of 150–300 hPa.
5
3.6. Event 6062201 – Sea area east of Sumatra (Indonesia)
The aircraft was flying at a pressure level of 357–382 hPa during the event. The hor-izontal extension of the low concentration area was about 12 km and the aircraft had a vertical displacement of about 500 m. The relative humidity was less than 100%. The back-trajectories came over the sea area east of Sumatra, Celebes and Irian Jaya
10
(Indonesia) at levels of 200–900 hPa.
3.7. Event 6062205 – Sumatra (Indonesia)
The low concentration event occurred when the aircraft was descending (369 to 398 hPa). The horizontal extension of the event was about 14 km and the vertical travel distance was about 500 m. The relative humidity was lower than 100%. The
15
back-trajectories came over the sea area east of Sumatra, Celebes at pressure levels of 300–900 hPa. The back-trajectories before the event came over the same area, but the back-trajectory after the event came over the Indian Ocean.
3.8. Event 6062207 – Sea area between Sumatra (Indonesia) and Malaysia
The low concentration area occurred when the aircraft was ascending from 342 to
20
323 hPa. The horizontal extension of the area was about 70 km and the aircraft was ascending about 400 m. The relative humidity was below 100%. The back-trajectories came over the sea area east of Sumatra, Celebes and the sea area north of Irian Jaya at pressure levels of 250–700 hPa.
ACPD
3, 1631–1650, 2003 Rarity of upper-tropospheric low O3 concentration events W. A. H. Asman et al. Title Page Abstract Introduction Conclusions References Tables Figures J I J I Back CloseFull Screen / Esc
Print Version Interactive Discussion
3.9. Event 6082701 – Thailand. Route from Bangkok to Saigon
While ascending a first low concentration area was found at 456–435 hPa (a layer about 600 m thick). During the passage through this layer the aircraft was flying about 8 km in the horizontal direction. The second low concentration area was found when the air-craft was flying at cruise altitude 181–179 hPa and had a horizontal extension of about
5
25 km. During both periods the relative humidity was below 100%. During the first pe-riod with low concentrations the back-trajectories came from the sea area south east of Vietnam at pressure levels of 400–1000 hPa. Before this period the back-trajectories came from the sea area south of India. After this first low concentration period the back-trajectories came from the sea area south east of Vietnam (i.e. no change in
ori-10
gin). During the second period the back-trajectories came over the sea area southeast of Vietnam at pressure levels of 200–900 hPa. Before this low concentration period the back-trajectories came from the same area but go further back to the Bay of Bengal. No change in back-trajectory direction after this low concentration period was observed. 3.10. Event 6082704 – Thailand
15
During event 6082704 the aircraft was flying from Saigon to Bangkok. While ascending the concentrations at pressure levels larger than 500 hPa were often below 8 ppbv. The first low concentration that fulfilled our criteria occurred at pressure levels of 486– 376 hPa (a layer of about 2000 m thick). During the passage through this layer the aircraft was flying about 60 km in the horizontal direction. The second low concentration
20
period occurred when the aircraft was flying at altitudes between 217 and 215 hPa. The horizontal extension of this area was about 6 km. The third low concentration area occurred when the aircraft was flying at cruise altitude at 197 hPa and it had a horizontal extension of 15 km. The distance between the centre of this low concentration area and the centre of the second low concentration area of event 6082701 was about 30 km.
25
During all periods the relative humidity was almost always below 100%. The back-trajectories during the first period came over the sea area southeast of Vietnam and
ACPD
3, 1631–1650, 2003 Rarity of upper-tropospheric low O3 concentration events W. A. H. Asman et al. Title Page Abstract Introduction Conclusions References Tables Figures J I J I Back CloseFull Screen / Esc
Print Version Interactive Discussion
c
EGU 2003
then back to the sea area north of Sumatra (Indonesia) at pressure levels of 400– 800 hPa. For the second period the back-trajectories came over the sea area south east of Vietnam at pressure levels of 200–500 hPa. For the third period the trajectories came also over the sea area south east of Vietnam at pressure levels of 200–600 hPa. The events 6082701 and 6082704 are in fact the same event monitored during the
5
flights from Bangkok to Hanoi and back on the same day. The geographical coordinates for the flight trajectories are very similar. The geographical position of the second low concentration period of event 6082701 is almost the same as the geographical position of the second period of event 6082704, but there is a difference in pressure level (179 hPa for event 6082701 and 197 hPa for event 6082704).
10
3.11. Event 7053105 – Zambia
During this flight the aircraft was at cruise altitude at a pressure level of 262 hPa when the low concentration event occurred, but the aircraft had started to change to a new cruise altitude to 238 hPa when the low concentration area was encountered. When the low concentration area was left the pressure was reduced to 255 hPa. The area
15
occurred when the aircraft was moving about 25 km in the horizontal direction and about 200 m up. Shortly before the change in height occurred, the aircraft had also changed flight direction, but it does not look like as does the pilot was trying to avoid an adverse situation, because the flight trajectory was not changed back to the original one. The turbulence had not increased much during the low concentration event. The
20
air temperature was about −39◦C. The relative humidity was very low (about 1%) and satellite images indicate a temperature of the surface of about 15◦C (infrared channel) and −22◦C (water vapour channel). The water vapour channel mainly observes wa-ter vapour and a temperature of −22◦C indicates that low clouds were present. The back-trajectories followed the route Atlantic Ocean, South America and the Pacific at
25
pressure levels of about 200–250 hPa. The low concentration period was associated with a change in flight level from a pressure of 262 hPa to 238 hPa level.
ACPD
3, 1631–1650, 2003 Rarity of upper-tropospheric low O3 concentration events W. A. H. Asman et al. Title Page Abstract Introduction Conclusions References Tables Figures J I J I Back CloseFull Screen / Esc
Print Version Interactive Discussion
4. Discussion and conclusions
Air masses with at least 25 O3 concentrations, integrated over 4 s, with values less than 8 ppbv at pressures below 500 hPa were hardly encountered during the MOZAIC flights from August 1994 to December 1997 (about 0.001% of the measurements at pressures lower than 500 hPa). As the low concentration events are really rare no
5
general conclusions can be drawn on the frequency of occurrence of low concentration events as a function of the geographical position and pressure level. This emphasizes the uniqueness of the low concentration events.
The low O3 events, characterized by generally low concentrations, was in 10 out of 11 cases associated with 5-day back-trajectories that came over (sub)tropical sea
10
areas. They all occur in tropical or subtropical areas. This suggests transport of air masses from tropical sea areas where low O3 concentrations have been found (Kley et al., 1996). During the other event (6010206) the back-trajectory was likely to come from the Pacific Ocean more than five days before the low concentration area was encountered.
15
It is, however, not so that the O3 concentration is always very low if the air comes over a tropical sea area. This is illustrated by the fact that the trajectories before and after the low concentration events in most cases came over the same sea area, but had higher concentrations. This points towards a stochastic event such as deep convection as the cause of the low O3events.
20
Low O3 events occurred often in Southeast Asia, but also events in Africa, Brazil and the southeast of Florida (USA) were observed. The number low O3events differs from year to year, but this may be due to variations in the destinations of the aircraft. They do not only occur over sea, but also over land. Low concentration events were not only observed close to the selected maximum pressure level of 500 hPa, but also
25
at pressure levels as low as 179 hPa. The horizontal extent of the low concentrations areas at cruise altitude varied from 5 to 30 km. During ascent and descent layers with low concentrations were encountered that were at least 100–600 m thick. During
ACPD
3, 1631–1650, 2003 Rarity of upper-tropospheric low O3 concentration events W. A. H. Asman et al. Title Page Abstract Introduction Conclusions References Tables Figures J I J I Back CloseFull Screen / Esc
Print Version Interactive Discussion
c
EGU 2003
flights 6062101, 6062201, 6062205, 6062207 that occur at almost the same time in adjacent areas (Sumatra, Malaysia), low concentration areas were observed in areas that are 400 to 1000 km apart and at pressure levels varying from 217 to 370 hPa. The associated back-trajectories came from about the same sea area near Indonesia. It cannot be excluded that they are part of one large low concentration area, but this
5
cannot be concluded from the available measurements.
During some low O3events the relative humidity was less than 100%. This indicates that the low O3 concentration in these cases is not caused by destruction of O3 by reaction with ice particles at the moment of observation, but it cannot be excluded that this process has played a role during transport of the air mass.
10
Given the large number of flights and the geographical spread of the routes flown, we conclude that low O3 concentration events as defined here are exceedingly rare. It should be noted, however, that only the MOZAIC aircraft that were flying to South America (12% of the flights) came over the tropical Atlantic, while aircraft going to southeast Asian destinations crossed over tropical sea areas only for a small fraction
15
of the time. There were no flights across the tropical Pacific. It is also worthwhile to note that the low concentrations in the upper troposphere reported by Kley et al. (1996) were measured by balloon-borne O3sondes at a pressure level of about 100 hPa, which is much lower than the lowest pressure level during the MOZAIC low O3events reported here (197 hPa). So it might well be that low O3concentrations occur more often than
20
reported here, but at lower pressure levels than aircraft are cruising.
Acknowledgement. M. Helten, Forschungszentrum J ¨ulich, Germany is gratefully
acknowl-edged for detailed information on the relative humidity instrumentation. G. Athier, Laboratoire d’A ´erologie, Toulouse, France is acknowledged for making the data available in an easily ac-cessible way. EUMETSAT, Darmstadt is gratefully acknowledged for supplying METEOSAT
25
images. The authors acknowledge the MOZAIC project that is funded by the European Com-munities, CNRS, Forschungszentrum J ¨ulich, University of Cambridge, and M ´et ´eo-France and supported by EADS Airbus and the Airlines: Air France, Deutsche Lufthansa, Sabena, and Austrian Airlines who carry free of charge the MOZAIC instruments. This work was supported in part by the German BMBF project 07ATC02.
ACPD
3, 1631–1650, 2003 Rarity of upper-tropospheric low O3 concentration events W. A. H. Asman et al. Title Page Abstract Introduction Conclusions References Tables Figures J I J I Back CloseFull Screen / Esc
Print Version Interactive Discussion
References
Davies, W. E., Vaughan, G., and O’Connor, F. M.: Observation of near-zero ozone concentra-tion in the upper troposphere at mid-latitudes, Geophys. Res. Lett., 25, 1173–1176, 1998. EUMETSAT: The Meteosat archive, users handbook, issue 2.1, EUMETSAT, Darmstadt,
Ger-many, 1999.
5
Helten, M., Smit, H. G. J., Str ¨ater, W., Kley, D., N ´ed ´elec, P., S ¨oger, M., and Busen, R.: Calibra-tion and performance of automatic compact instrumentaCalibra-tion for the measurements of relative humidity from passenger aircraft, J. Geophys. Res., 103, 25643–25652, 1998.
Kley, D., Crutzen, P. J., Smit, H. G. J., V ¨omel, H., Oltmans, S. J., Grassl, H., and Ramanathan, V.: Observations of near-zero ozone concentrations over the convective Pacific: Effects on
10
air chemistry, Science, 274, 230–233, 1996.
Lawrence, M. G.: Photochemistry in the tropical pacific troposphere: studies with a global 3D chemistry-meteorology model. Ph.D. thesis Georgia Institute of Technology, Atlanta, USA, 1996.
Lawrence, M. G., Crutzen, P. J., and Rasch, P. J.: Analysis of the CEPEX ozone data using a
15
3D chemistry-meteorology model, Q. J. R. Meteorol. Soc., 125, 2987–3009, 1999.
Marenco, A., Thouret, V., N ´ed ´elec, P., Smit, H., Helten, M., Kley, D., Karcher, F., Simon, P., Law, K., Pyle, J., Poschmann, G., Von Wrede, R., Hume, C., and Cook, T.: Measurement of ozone and water vapor by Airbus in-service aircraft: The MOZAIC airborne program, an overview, J. Geophys. Res., 103, 25 631–25 642, 1998.
20
Platt, U.: Reactive halogen species in the mid-latitude troposphere – recent discoveries, Water Air Soil Pollut., 123, 229–244, 2000.
Reichardt, J., Ansmann, A., Serwazi, M., Weitkamp, C., and Michaelis, W.: Unexpectedly low ozone concentration in midlatitude tropospheric ice clouds: A case study, Geophys. Res. Lett., 23, 1929–1932, 1996.
25
Scheele, M. P., Siegmund, P. C., and van Velthoven, P. F. J.: Sensitivity of trajectories to data resolution and its dependence on the starting point: in or outside a tropopause fold, Meteorol. Appl., 3, 267–273, 1996.
Singh, H. B., Gregory, G. L., Anderson, B., Browell, E., Sachse, G. W., Davis, D. D., Craw-ford, J., Bradshaw, J. D., Talbot, R., Blake, D. R., Thornton, D., Newell, R., and Merrill, J.:
30
Low ozone in the marine boundary layer of the tropical Pacific Ocean: photochemical loss, chlorine atoms, and entrainment, J. Geophys. Res., 101, 1907–1917, 1996.
ACPD
3, 1631–1650, 2003 Rarity of upper-tropospheric low O3 concentration events W. A. H. Asman et al. Title Page Abstract Introduction Conclusions References Tables Figures J I J I Back CloseFull Screen / Esc
Print Version Interactive Discussion
c
EGU 2003
Suhre, K., Cammas, J.-P., N ´ed ´elec, P., Rosset, R., Marenco, A., and Smit, H. G. J.: Ozone-rich transients in the upper equatorial Atlantic troposphere, Nature, 388, 661–663, 1997.
Thouret, V., Marenco, A., Logan, J. A., N ´ed ´elec, P., and Grouhel, C.: Comparisons of ozone measurements from the MOZAIC airborne program and the ozone sounding network at eight locations, J. Geophys. Res., 103, 25695–25720, 1998.
ACPD
3, 1631–1650, 2003 Rarity of upper-tropospheric low O3 concentration events W. A. H. Asman et al. Title Page Abstract Introduction Conclusions References Tables Figures J I J I Back CloseFull Screen / Esc
Print Version Interactive Discussion
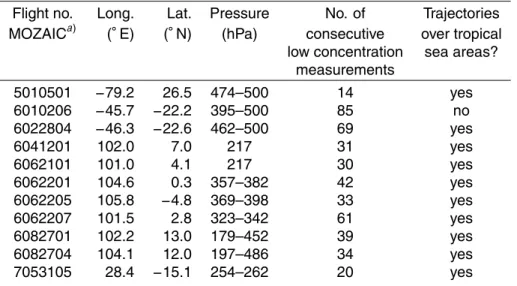
Table 1. Position of low O3 concentration events during events with generally low concentra-tions
Flight no. Long. Lat. Pressure No. of Trajectories MOZAICa) (◦E) (◦N) (hPa) consecutive over tropical
low concentration sea areas? measurements 5010501 −79.2 26.5 474–500 14 yes 6010206 −45.7 −22.2 395–500 85 no 6022804 −46.3 −22.6 462–500 69 yes 6041201 102.0 7.0 217 31 yes 6062101 101.0 4.1 217 30 yes 6062201 104.6 0.3 357–382 42 yes 6062205 105.8 −4.8 369–398 33 yes 6062207 101.5 2.8 323–342 61 yes 6082701 102.2 13.0 179–452 39 yes 6082704 104.1 12.0 197–486 34 yes 7053105 28.4 −15.1 254–262 20 yes a)
First digit: year (e.g. 5= 1995), next four digits are month, and day within the month and the last two digits is the flight numbers on that particular day.
ACPD
3, 1631–1650, 2003 Rarity of upper-tropospheric low O3 concentration events W. A. H. Asman et al. Title Page Abstract Introduction Conclusions References Tables Figures J I J I Back CloseFull Screen / Esc
Print Version Interactive Discussion
c
EGU 2003
Fig. 1. Fraction of measured O3concentrations less than a stated concentration for pressure levels lower than 500 hPa.
ACPD
3, 1631–1650, 2003 Rarity of upper-tropospheric low O3 concentration events W. A. H. Asman et al. Title Page Abstract Introduction Conclusions References Tables Figures J I J I Back CloseFull Screen / Esc
Print Version Interactive Discussion
c
EGU 2003
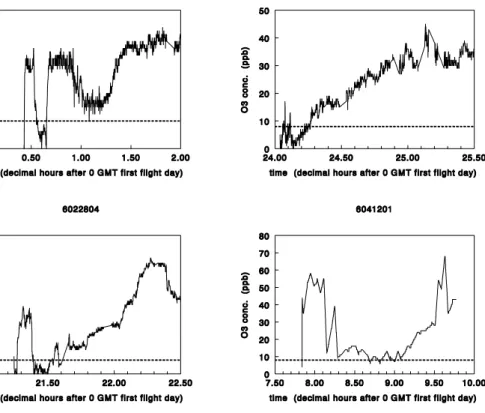
Figure 2. O
3concentration vs. time for low O
3events during flights with generally
low concentrations. The dashed line indicates the 8 pbbv level. The data presented
start some time before and end sometime after the low concentration event. For that
reason they may include measurements taken at pressures higher than 500 hPa. The
flight number is indicated above the graphs.
Fig. 2. O3concentration vs. time for low O3events during flights with generally low concentra-tions. The dashed line indicates the 8 pbbv level. The data presented start some time before and end sometime after the low concentration event. For that reason they may include mea-surements taken at pressures higher than 500 hPa. The flight number is indicated above the graphs (to be continued on next pages).
ACPD
3, 1631–1650, 2003 Rarity of upper-tropospheric low O3 concentration events W. A. H. Asman et al. Title Page Abstract Introduction Conclusions References Tables Figures J I J I Back CloseFull Screen / Esc
Print Version Interactive Discussion
c
EGU 2003
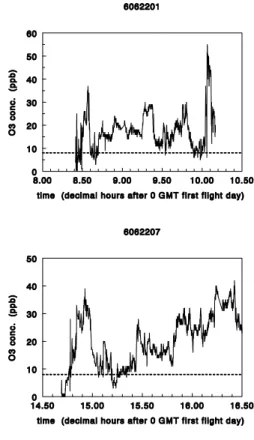
Figure 2. O
3concentration vs. time for low O
3events during flights with generally
low concentrations. The dashed line indicates the 8 pbbv level. The data presented
start some time before and end sometime after the low concentration event. For that
reason they may include measurements taken at pressures higher than 500 hPa. The
flight number is indicated above the graphs.
ACPD
3, 1631–1650, 2003 Rarity of upper-tropospheric low O3 concentration events W. A. H. Asman et al. Title Page Abstract Introduction Conclusions References Tables Figures J I J I Back CloseFull Screen / Esc
Print Version Interactive Discussion c EGU 2003