HAL Id: hal-00296384
https://hal.archives-ouvertes.fr/hal-00296384
Submitted on 27 Nov 2007
HAL is a multi-disciplinary open access
archive for the deposit and dissemination of
sci-entific research documents, whether they are
pub-lished or not. The documents may come from
teaching and research institutions in France or
abroad, or from public or private research centers.
L’archive ouverte pluridisciplinaire HAL, est
destinée au dépôt et à la diffusion de documents
scientifiques de niveau recherche, publiés ou non,
émanant des établissements d’enseignement et de
recherche français ou étrangers, des laboratoires
publics ou privés.
O3 during the southern hemispheric biomass burning
season in 2003
T. von Clarmann, N. Glatthor, M. E. Koukouli, G. P. Stiller, B. Funke, U.
Grabowski, M. Höpfner, S. Kellmann, A. Linden, M. Milz, et al.
To cite this version:
T. von Clarmann, N. Glatthor, M. E. Koukouli, G. P. Stiller, B. Funke, et al.. MIPAS measurements
of upper tropospheric C2H6 and O3 during the southern hemispheric biomass burning season in 2003.
Atmospheric Chemistry and Physics, European Geosciences Union, 2007, 7 (22), pp.5861-5872.
�hal-00296384�
www.atmos-chem-phys.net/7/5861/2007/ © Author(s) 2007. This work is licensed under a Creative Commons License.
Chemistry
and Physics
MIPAS measurements of upper tropospheric C
2
H
6
and O
3
during
the southern hemispheric biomass burning season in 2003
T. v. Clarmann1, N. Glatthor1, M. E. Koukouli2, G. P. Stiller1, B. Funke3, U. Grabowski1, M. H¨opfner1, S. Kellmann1, A. Linden1, M. Milz1,*, T. Steck1,**, and H. Fischer1
1Forschungszentrum Karlsruhe, Institut f¨ur Meteorologie und Klimaforschung Karlsruhe, Germany
2Laboratory of Atmospheric Physics, Physics Department, Aristotle University of Thessaloniki, Thessaloniki, Greece. 3Instituto de Astrof´ısica de Andaluc´ıa CSIC, Granada, Spain
*now at: Institutionen f¨or Rymdvetenskap, Lule˚a Tekniska Universitet, Kiruna, Sweden **now at: Kepler Gymnasium, Ulm, Germany
Received: 26 July 2007 – Published in Atmos. Chem. Phys. Discuss.: 15 August 2007 Revised: 24 October 2007 – Accepted: 13 November 2007 – Published: 27 November 2007
Abstract. Under cloud free conditions, the Michelson
Inter-ferometer for Passive Atmospheric Sounding (MIPAS) pro-vides measurements of spectrally resolved limb radiances down to the upper troposphere. These are used to infer global distributions of mixing ratios of atmospheric constituents in the upper troposphere and the stratosphere. From 21 October to 12 November 2003, MIPAS observed enhanced amounts of upper tropospheric C2H6(up to about 400 pptv) and ozone (up to about 80 ppbv). The absolute values of C2H6, how-ever, may be systematically low by about 30% due to uncer-tainties of the spectroscopic data used. By means of trajec-tory calculations, the enhancements observed in the southern hemisphere are, at least partly, attributed to a biomass burn-ing plume, which covers wide parts of the Southern hemi-sphere, from South America, the Atlantic Ocean, Africa, the Indian Ocean to Australia. The chemical composition of the part of the plume-like pollution belt associated with South American fires, where rainforest burning is predominant ap-pears different from the part of the plume associated with southern African savanna burning. In particular, African sa-vanna fires lead to a larger ozone enhancement than equa-torial American fires. In this analysis, MIPAS observations of high ozone were disregarded where low CFC-11 (below 245 pptv) was observed, because this hints at a stratospheric component in the measured signal. Different type of vege-tation burning (flaming versus smouldering combustion) has been identified as a candidate explanation for the different plume compositions.
Correspondence to: T. von Clarmann
1 Introduction
Long-lived products of biomass burning are intercontinen-tally transported and form large plume-like structures which are visible over months. The Atmospheric Chemistry Ex-periment (ACE) has measured CO, C2H6, HCN and C2H2 during the 2004 and 2005 southern hemispheric biomass burning seasons (Rinsland et al., 2005; Coheur et al., 2007). The Measurements Of Pollution In The Troposphere (MO-PITT) experiment has provided evidence of enhanced tro-pospheric CO in the outflow regions of African and South American forest fires during the 2003 southern hemispheric biomass burning season as recently published by Edwards et al. (2006). The Michelson Interferometer for Passive At-mospheric Sounding (MIPAS) instrument provides a com-plementary dataset of this episode, namely upper tropo-spheric C2H6 and ozone volume mixing ratios in October– November 2003. These data contribute additional informa-tion on tropical latitudes which are not as well covered by the ACE instrument, and adds to the knowledge of the chem-ical composition of the polluted air detected by MOPITT. C2H6is a direct biomass burning product generated predom-inantly by smouldering combustion (Lobert and Warnatz, 1993), while O3is a secondary biomass burning product gen-erated by photochemistry in the presence of NOx. To our knowledge, our data are the first global upper tropospheric C2H6data set which also densely covers tropical latitudes.
While the term “plume” typically is associated with the outflow of a single source, in the context of biomass burn-ing this term is occasionally used also for contiguous out-flow patterns of multiple sources (e.g. Chatfield et al., 2002). The latter authors also use the terms “global plume” or “megaplume”. For simplicity, we use the term “plume” also in the context of multiple sources in this paper.
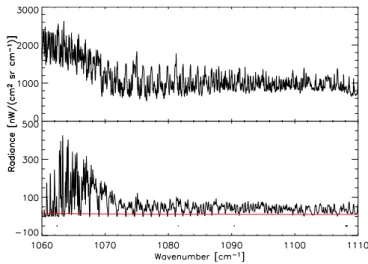
Fig. 1. MIPAS spectrum in the wavenumber range where C2H6 is analysed, measured at 13.0◦S, 37.2◦E on 21 October 2003, 10.06 km tangent altitude (upper panel). The lower panel is the C2H6signal, determined by subtracting a calculated spectrum with zero C2H6in the target altitude region (8–12 km) from the best fit-ting calculated spectrum. Microwindows are indicated as horizontal bars. The horizontal red line is the noise equivalent spectral radi-ance of a single spectrum.
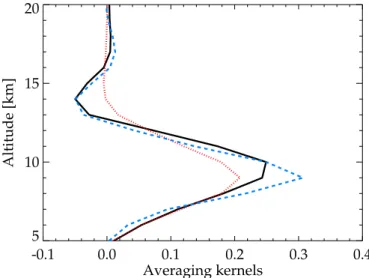
Fig. 2. Rows of averaging kernels at 9 km altitude for C2H6(black, solid), O3 (red, dotted), and CFC-11 (blue, dashed) for a profile measured on 21 October 2003 at 13.0◦S, 37.2◦E.
2 MIPAS observations
MIPAS (Michelson Interferometer for Passive Atmospheric Sounding) is part of the instrumentation of the Environ-mental Satellite (Envisat) which was launched into its sun-synchronous polar orbit on 1 March 2002. It is a limb emis-sion spectrometer designed primarily for measuring strato-spheric trace species from space (Fischer et al., 2007). Nevertheless, under cloud-free conditions it also provides
information on upper tropospheric trace species. MIPAS was operational from July 2002 to March 2004 with full specifi-cation, in particular 0.05 cm−1 spectral resolution in terms of full width at half maximum (apodised with the “strong” Norton and Beer (1976) function). During each of the 14.4 orbits per day MIPAS recorded 78 limb sequences of emis-sion spectra, amounting at about 1000 observations per day from pole to pole. Full global coverage is achieved after 3 days. Data presented here were recorded from 21 October to 12 November 2003, during Envisat orbits 8573 to 8931. The data analysis reported in this paper relies on the ESA-provided so-called level-1B data product version 4.59 which includes calibrated phase-corrected and geolocated radiance spectra (Nett et al., 1999). Spectra containing cloud signal were identified using a method suggested by Spang et al. (2004) and have been excluded from further analysis. The general strategy and formalism of the retrieval is discussed in detail by von Clarmann et al. (2003). In the following we restrict the discussion to specific issues of the retrieval of up-per tropospheric C2H6and ozone.
2.1 Ethane (C2H6)
Data presented in this paper are version V2 C2H6 1. Fea-tures in spectra of tangent altitudes of 33 km and lower have been analysed for C2H6. Its abundances are retrieved from theν9fundamental emissions in the spectral region of 780– 868 cm−1. In order to blank out regions with low C2H6signal and large signal of other species, 30 so-called microwindows have been selected within the analysis window (Fig. 1). In-terfering species in this spectral region are O3, H2O, HNO3, ClONO2, CFC-11, ClO, N2O5, HNO4, CFC-12 and SF6, for which pretrieved values were used, i.e. mixing ratios re-trieved in a preceding analysis step from the same set of spectra but usually different microwindows. The interferents PAN and CCl4were considered on the basis of climatological profiles, which is justified because their radiance contribution within the microwindows chosen is low. A retrieved C2H6 profile has three to four degrees of freedom (i.e. independent pieces of information, calculated as the trace of the averag-ing kernel matrix, c.f. Rodgers, 2000), of which, at tropical geolocations where the tropopause is as high as 17 km, ap-proximately three characterize the troposphere. Typical sin-gle profile total retrieval errors, i.e. noise and parameter er-rors excluding spectroscopic data uncertainties, for measure-ments of enhanced tropospheric C2H6vary between about 20 and 50%, depending on altitude, temperature, humidity and actual C2H6 abundances. At all altitudes the error budget is dominated by measurement noise, which, from the lowest tangent altitude actually used up to 18 km, contributes an or-der of magnitude more than all other random error sources together. These other random errors we define are randomly varying errors due to uncertain instrumental or atmospheric parameters which might influence the retrieval, such as in-terfering species. The vertical resolution is about 3 to 4 km
at 9 km altitude, as determined from the row of the averag-ing kernel matrix (Fig. 2). Above approximately 18–20 km, the C2H6signal in the MIPAS spectra is so low that no more useful profile information can be retrieved.
A major issue with respect to the absolute accuracies of the retrieved C2H6 mixing ratios are uncertainties in the spectroscopic data used (Personal communication, J. Van-der Auwera, 2005; J.-M. Flaud, 2006). The line intensi-ties in HITRAN2K (Rothman et al., 2003) which have been used for this analysis are a factor of 2 stronger than those in the GEISA spectroscopic database (Jacquinet-Husson et al., 2003), resulting in a factor of 2 lower mixing ratios. Line in-tensities of a more recent data set, which were not yet avail-able at the time of this study, are about 30 percent smaller than those used here (Vander Auwerra et al., 2007). These uncertainties, however, have no impact on our conclusions since these do not depend on the absolute values retrieved. This makes our analysis robust against any scalar bias, and results can easily be re-scaled for band-intensity correction, which is a commonly used approach in atmospheric spec-troscopy. The recommended correction factor to make our data set comparable to retrievals based on the new spectro-scopic data by Vander Auwerra et al. (2007) is 1.292 for the spectral analysis windows used in this study.
Since the sensitivity of mid-infrared limb emission mea-surements to abundances of species in the troposphere is lim-ited, data recorded between 21 October 2003 and 12 Novem-ber 2003 were averaged in order to increase significance. In the following, we discuss the averaged spatial distributions of C2H6in the upper troposphere, i.e. at 275 hPa, which cor-responds roughly to 9–10 km altitude. At the given altitude resolution of the vertical profiles of 3 to 4 km, assessment of adjacent altitude levels does not provide much additional information.
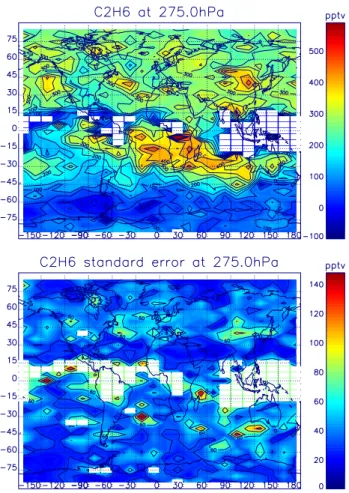
Widespread high C2H6mixing ratios were observed in the northern hemisphere, which is attributed to industrial pollu-tion (Fig. 3). Values of about 200–400 pptv (260–520 pptv after application of the spectroscopic correction) were re-trieved. The background mixing ratio in the southern hemi-sphere was only about 75 pptv (100 pptv after correction). However, there was a plume-like structure reaching from Brazil over the southern tropical Atlantic Ocean, southern Africa, the southern sub-tropical Indian Ocean to Australia and beyond. Here values of 300–400 pptv (390–520 pptv af-ter correction) were observed, which are comparable to those in polluted airmasses in the northern hemisphere. The typi-cal standard error of the mean mixing ratio in a longitude-latitude bin is about 30 pptv (39 pptv after correction). Vol-ume mixing ratios measured by MIPAS are approximately a factor of 2 lower than those measured by ACE during the biomass-burning season 2004 (Rinsland et al., 2005), who used the 2976–2977 cm−1 spectral region. This discrep-ancy is most likely to be attributed to inconsistent spectro-scopic data in these two bands but is by far not removed by application of the spectroscopic correction factor. In situ
Fig. 3. VMR distribution of C2H6at 275 hPa, averaged from 21 October to 12 November 2003 (upper panel). Larger mixing ratios are found in the northern hemisphere, due to industrial pollution. White bins represent data gaps due to cloud coverage. In the south-ern hemisphere a plume-like structure is visible. The lower panel shows the standard error of the mean. Note the different colour scales. White boxes in the standard error plots represent data bins where either no data were available or only one measurement, such that the standard error could not be calculated.
measurements of about 500–700 pptv at 9 km altitude inside biomass burning plumes have been reported by Talbot et al. (1996). Although the latter measurements refer to a period in 1992, they also describe a situation of enhanced vegeta-tion fire activity. While the original MIPAS retrievals reveal a low bias compared both to the in situ measurements and the ACE data, they agree reasonably well with the in situ data after the spectroscopic correction. While these compar-isons of non-coincident data should not be overstressed, there is some indication that the spectroscopic data set by Vander Auwerra et al. (2007) is more reliable than the one included in HITRAN2K.
Fig. 4. MIPAS A band spectrum in the wavenumber range where
O3is analysed. See Fig. 1 for details.
2.2 O3
The ozone distributions presented in this paper are version V2 O3 2, and their retrieval has been described in detail in Glatthor et al. (2006). The microwindows chosen are sit-uated both in the MIPAS A band (685–970 cm−1) and AB band (1020–1170 cm−1) (Fig. 4 and 5). Detailed validation is presented by Steck et al. (2007b). Under tropical enhanced tropospheric ozone conditions, the retrieval has 2 to 3 de-grees of freedom in the troposphere. Typical estimated sin-gle profile retrieval errors are of the order of 50% or more for upper tropospheric background concentrations but are re-duced to reasonable values by averaging over the observation period within latitude-longitude bins (see Sect. 2.1). At tro-pospheric altitudes the error budget is dominated by mea-surement noise, followed by uncertainties in spectral shift and temperature. The altitude resolution at 9 km altitude, as determined from the rows of the averaging kernel matrix (Fig. 2), is about 4 km. The uncertainty of spectroscopic data varies from 2–10%, depending on the particular band and ro-tational quantum number. For the transitions used here, 5% is considered a representative estimate. The standard error of the mean ozone mixing ratio over the analysis period in a latitude-longitude bin of enhanced ozone is of the order of 3 ppbv.
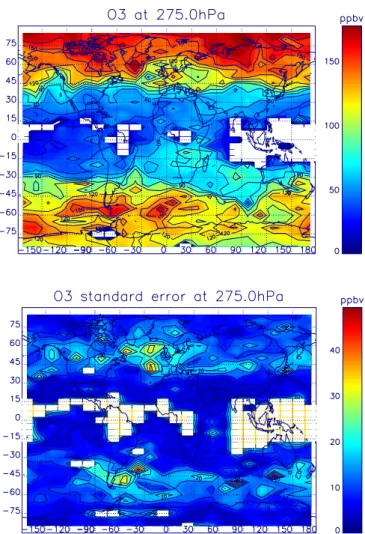
O3abundances at 275 hPa are high towards polar latitudes where stratospheric air is seen (Fig. 6). Towards the trop-ics, values of only 0–50 ppbv were observed both in northern and southern low latitudes. Higher values of up to 80 ppbv are confined to a subset of the latitude-longitude bins where also enhanced C2H6 was observed. No coincident tropo-spheric O3 data from other satellite instruments have been found to compare with. Comparison to tropospheric ozone maps generated with the empirically corrected tropospheric ozone residual (TOR) technique from solar backscattered
Fig. 5. MIPAS AB band spectrum in the wavenumber range where
O3is analysed. See Fig. (1) for details.
ultraviolet (SBUV) data for September through November 1979–2000 (Fishman et al., 2003)(their Fig. 1) reveals simi-larities in the distribution of enhanced O3over the southern Atlantic Ocean, Africa, and Indian Ocean, while their TOR ozone data show enhanced ozone also above South Amer-ica. This difference, however, should not be overstressed, be-cause TOR data also represent the lower troposphere which is not seen by MIPAS, and because the mean distributions are based on different measurement periods, which cover the local biomass burning season differently. In particular, ma-jor fire activities seem to have taken place in Brazil after the MIPAS averaging period.
2.3 CFC-11
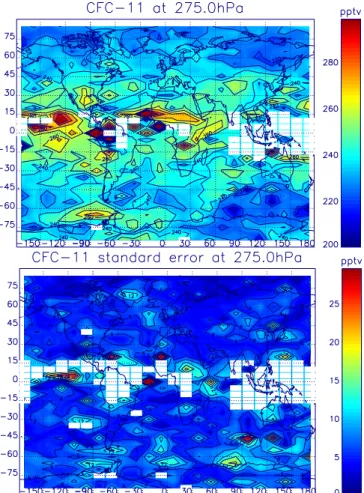
In this study the volume mixing ratio of CFC-11 is used as an indicator to distinguish between tropospheric and strato-spheric air. CFC-11 is retrieved in the 838.0–853.0 cm−1 spectral region, which covers theν4band (Fig. 7). Main in-terfering lines in this region are associated to H2O, HNO3 and COCl2. In order to avoid propagation of uncertainties of a priori knowledge on these species to the CFC-11 profiles, their abundances are joint-fitted in the CFC-11-analysis win-dow. The estimated total retrieval error of tropospheric CFC-11 is only 4–9% except for particularly moist atmospheric conditions where enhanced opacity of the atmosphere due to water vapour emissions or even undetected thin clouds affect the retrieval. Besides this, the main component of the CFC-11 retrieval error is line-of-sight uncertainties, which even outweigh the contribution of measurement noise. The alti-tude resolution is about 3.3 km. The tropical troposphere is characterized by three to four degrees of freedom of the re-trieved CFC-11 profile. A dedicated paper on the retrieval of CFC-11 from MIPAS spectra and validation is in preparation. A global map of CFC-11 at 275 hPa is shown in Fig. 8. The
standard error of the mean value within a latitude-longitude bin typically is around 5 pptv.
3 Southern hemispheric pollution belt
As we will discuss in the following, the enhanced south-ern hemispheric mixing ratios of tropospheric C2H6and O3 are attributed to biomass burning in South America, Africa, Australia and Indonesia. For a similar period, MOPITT measured enhanced CO, which has also been attributed to biomass burning. The CO plume presented by Edwards et al. (2006)(their Fig. 1b) coincides nicely with the region of en-hanced C2H6, PAN (Glatthor et al., 2007), and O3detected by MIPAS.
3.1 Trajectory calculations
In order to assign the detected plume-like belt of polluted air to biomass burning, 12-day forward trajectories have been calculated with the HYSPLIT model (Draxler and Hess, 1997, 1998) (see also:http://www.arl.noaa.gov/ready/ hysplit4.html), based on European Centre for Midrange Weather Forecast (ECMWF) analysis data. At the altitude range of interest, 12 days proved to be sufficient to capture intercontinental transport. Trajectory uncertainties are di-rectionally unbiased for timescales larger than 5 h (Draxler, 1991) and thus are dominated by random errors, which in tendency cancel out when large ensembles are analysed sta-tistically.
The trajectories were initialized at 4500 m altitude for southern African fires and at 2500 m altitude for South Amer-ican, Indonesian and Australian fires. These trajectory alti-tudes comply with the so-called “injection altitude”, i.e. up-per boundary of the mixing layer, which was found typical for biomass fires in these regions by Labonne et al. (2007). However, it should be mentioned that the final trajectory pat-tern varies only marginally with the injection altitude varying between 2500 and 4500 m. Burning areas were identified us-ing daily Tropical Rainfall Measurus-ing Mission (TRMM) Vis-ible and Infrared Scanner (VIRS) satellite data (Giglio et al., 2000). As starting points of plume trajectories locations were selected where clusters of TRMM fire counts were found in the time interval 9 October 2003 to 12 November 2003, i.e. in the observation period of which data are presented here plus an 12-day extension towards earlier days to allow aged plume air to be detected. One trajectory represents approximately 10 fire counts.
Results of the trajectory calculations are shown in Fig. 9, where those parts of the trajectories are included which, dur-ing the averagdur-ing period, fall into the altitude range 7–11 km. Elevated C2H6over the South Atlantic, north of about 25◦S can be attributed mainly to equatorial (15◦S–10◦N) Ameri-can biomass burning, while further south the plume is formed both by equatorial and non-equatorial airmasses. Polluted
Fig. 6. VMR distribution of O3at 275 hPa, averaged from 21 Oc-tober to 12 November 2003 (upper panel). Larger mixing ratios are found at northern and southern latitudes, where stratospheric air is sounded at this altitude. Enhanced tropospheric ozone is observed within the plume. The lower panel shows the standard error of the mean. Note the different colour scales. For more details, see Fig. 3.
air masses over Africa north of about 25◦S are assigned to African vegetation burning. South of 25◦S both African and South American airmasses contribute to the plume. Also the plume over the Indian Ocean is formed by airmasses of var-ious origins, where African sources are predominant in the northern part of the plume.
3.2 Plume tracer C2H6
The bulk of biomass burning plume trajectories, in partic-ular those starting from tropical America and Africa, cov-ers the same geolocations where enhanced C2H6 is seen. C2H6, like other non-methane hydrocarbons, is generated by both flaming and smouldering combustion (Lobert and War-natz, 1993) but larger quantities are produced via smoulder-ing combustion (Crutzen and Andreae, 1990). Its expected
Fig. 7. MIPAS spectrum in the wavenumber range where CFC-11
is analysed. See Fig. 1 for details.
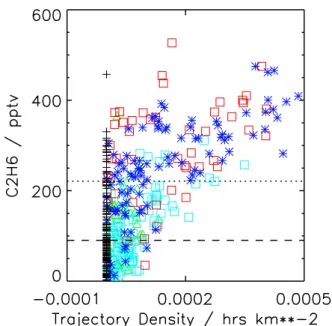
atmospheric lifetime in the upper troposphere is estimated at 100 days (Mauzerall et al., 1998), which is much longer than the episode under analysis. This suggests that, among the available MIPAS data, C2H6is a suitable tracer for plumes of polluted air. In order to define a threshold for plume air, the average value and the standard deviation of the C2H6 mix-ing ratios of all tropical and southern hemispheric (i.e. 15◦N to 90◦S) 5◦×15◦latitude-longitude bins not touched by any of the trajectories was calculated. The average (weighted by the inverse variance of the mean value of each bin) is 90 pptv and is understood to represent the southern hemi-spheric background mixing ratio at 275 hPa. The average plus two standard deviations is 221 pptv and is considered a suitable threshold for plume air (Fig. 10). This threshold re-duces the one-sided risk that background air is misinterpreted as plume air, but does not minimize the complementary risk, i.e. that plume air parcels may remain undetected, in partic-ular in the Pacific area, where presumably more divergent trajectories lead to smaller C2H6mixing ratios.
Certainly our analysis cannot exclude C2H6-loading from other sources than biomass burning. Industrial and megacity emissions could also contribute to enhanced C2H6 mixing ratios. If these sources are situated in the vicinity or in the upwind region of vegetation fire events, they could contribute to the C2H6currently assigned to biomass burning. Analysis of MIPAS data recorded at other times than during the biomass burning season is planned and will help to identify other sources of upper tropospheric C2H6 in the southern hemisphere. This issue seems particularly important to explain some of the data bins over the Pacific Ocean west of Colombia, Ecuador and Peru and is discussed in more depth in Sect. 3.5.
Fig. 8. VMR distribution of CFC-11 at 275 hPa, averaged from 21
October to 12 November 2003 (upper panel). Low values at high latitudes indicate stratospheric air sounded by MIPAS. Particularly high values near the equator most probably are artefacts due to ex-treme moisture or even undetected cloud signal in the spectra, to which the CFC-11 retrieval proves to be particularly sensitive. The lower panel shows the standard error of the mean. Note the different colour scales. For more details, see Fig. 3.
Figure 10 suggests that air polluted by equatorial Ameri-can fires contains somewhat but not signifiAmeri-cantly more C2H6 weighted by trajectory density than air parcels from other vegetation fires. By the term trajectory density we define the number of trajectories touching the bin times the residence time of the air parcel within the bin divided by the area of the bin. The mean ratio of C2H6mixing ratio over trajec-tory density is 10.1±4.3 ppmv ×km2/h for the Amazonian plume, while it is only 8.0±2.4 ppmv×km2/h for the African plume. This ratio of about a factor of 1.26 is somewhat but not significantly lower than that one would expect from emis-sion factors (gram species per kilogram of dry matter burned) presented by Andreae et al. (2001) who report values of 0.5 to 1.9 for tropical forest fires which is the dominating type of vegetation fires in equatorial America. These authors report
Fig. 9. Trajectories starting at geolocations of fire count clusters
in the period from 13 October to 12 November 2003. Colour cod-ing reflects the different startcod-ing points: blue=Africa, red=tropical America, yellow=north America, light blue=southernmost Amer-ica, green=Australia and Indonesia. Only those points of the tra-jectories are shown which fall between 7 and 11 km, i.e. the mea-surement altitude plus/minus approximately half an altitude resolu-tion of the MIPAS measurement. White background shading indi-cates data gaps due to clouds within the MIPAS field of view. Light grey corresponds to C2H6below 216 pptv and indicates air masses outside the plume. Dark grey and black is C2H6 above 216 pptv and represents plume air. Regions within the plume where ozone is above 70 ppbv are shaded black. Obviously high ozone mixing ratios are not distributed equally over the plume.
a C2H6 emission factor for savanna and grassland burning of only 0.32±0.16. This difference is explained by the
re-duced completeness of combustion, which is significantly higher for the flaming combustion predominant in savanna burning than for the smouldering combustion more relevant in tropical rain forest burning (Jain et al., 2006). The differ-ent C2H6loading of polluted air has to be considered when this species is used as plume tracer in any quantitative way. This, however, is not a particular disadvantage of the species C2H6 used as plume tracer here: The same caveat applies to the frequently used tracer CO, whose emission factors are also nearly a factor of two higher for rainforest burning than savanna and grassland fires (Andreae et al., 2001).
3.3 Ozone morphology within the plume
Ozone is an indirect biomass burning product whose main precursors include CO and NOx, which are both directly as-sociated with biomass burning, and whose concentration crit-ically depends on the level of NOx. MIPAS ozone observa-tions vary considerably within the biomass burning plume. In particular, the part of the plume attributed mainly to African savanna fires contains much more ozone compared to the plume of equatorial American biomass burning where rain
Fig. 10. C2H6VMR over trajectory density. Trajectory density is the number of trajectories starting at biomass burning areas which touch a 5◦×15◦ latitude-longitude bin, weighted by the time the trajectory is within the bin. The dashed line represents southern hemispheric background C2H6, the dotted line is the plume thresh-old. Coloured symbols represent plume air. The trajectory origin is colour-coded as in Fig. 9, i.e. light blue squares: subtropical South America; red squares: Equatorial South America; yellow diamonds: North America; dark blue asterisks: Africa; green triangles: Aus-tralia, Indonesia. Black crosses represent air outside the plume.
forest fires are prevailing. In turn, in the outflow region of equatorial American burning over the South Atlantic, no bins with ozone mixing ratios above 70 ppbv are observed except near the coast at about 25◦S, where non-equatorial air-masses also contribute. O3/C2H6 ratios were calculated for each bin inside the plume, where in case of ambiguous origin of air masses the bin was assigned to the source region whose trajectories predominated in terms of number of tra-jectories touching the bin times residence time of the air par-cel within the bin (Fig. 11, upper panel). The mean O3/C2H6 ratio is 225±26 in the African plume but only 175±10 in the Amazonian plume. In the Australian part of the plume high ozone values (above 100 ppbv) are observed, too, but these are attributed to stratospheric signal, as discussed below in Sect. 3.4. It should be noted that bins touched by trajectories from different origin do not necessarily hint at mixing in any physical sense. Instead, numerical mixing can be caused by averaging over the observation period in the case of a non-stationary windfield.
Fig. 11. O3– C2H6scatter plot. Colour coding as in Fig. 9. Upper panel: The O3/C2H6 ratio in the African part of the plume (dark blue asterisks) is higher than that of the tropical American part (red squares). No clear ozone/ethane correlation is evident within the plume. Also the Australian/Indonesian part of the plume (green tri-angles) contains data points of high ozone. Lower panel: As above but data points with CFC-11 below 245 pptv, hinting at stratospheric signal, filtered out.
3.4 Removal of stratospheric signal
High ozone mixing ratios along with low C2H6 values in the Australian part of the plume suggest that the ozone seen at 275 hPa might be affected by a stratospheric ozone sig-nal. The ozone signal at this altitude can be contaminated by stratospheric ozone by two mechanisms of entirely dif-ferent nature: Either stratospheric air could have been mixed or transported into the upper troposphere (c.f. Bremer et al., 2004); or, in the case of a low tropopause, due to the lim-ited altitude resolution of the MIPAS ozone retrievals, strato-spheric ozone could be misinterpreted as upper tropostrato-spheric ozone. In the given context, however, it is not necessary to
distinguish between either of these causes of stratospheric signal, since the effect would be the same: Stratospheric ozone would erroneously be attributed to a biomass burning plume. To determine data bins which are dominated by any of these potentially stratospheric ozone signals mentioned above, we use CFC-11 as a tracer. CFC-11 is a tropospheric species whose mixing ratios rapidly decrease with altitude in the stratosphere. Further, CFC-11 is long-lived and well-mixed in the troposphere and its mixing ratios are not driven by fire events. Its averaging kernels in the tropopause region are of similar width as those of ozone. Therefore, low CFC-11 values hint at a stratospheric ozone signal in the observed data bin.
Indeed some plume bins related to trajectories starting in Australia and extratropical southern America are character-ized by low CFC-11 mixing ratios. This applies to data bins over the Pacific Ocean and the southern Atlantic east of southern Argentina and explains the high O3/C2H6ratios (green and light blue symbols in Fig. 11). Air parcels with CFC-11 mixing ratios below 245 pptv were rejected from further analysis. This particular threshold removed most of the spurious data points with high ozone and low C2H6 mix-ing ratios which are attributed to stratospheric contamination. On the other hand, this threshold left enough data points for statistical analysis. Indeed the lower panel of Fig. 11, which shows the O3/C2H6ratios after application of the CFC-11 fil-ter, includes much less data points with high (possibly strato-spheric) ozone and low C2H6compared to the unfiltered scat-ter plot. Nevertheless, some suspicious data points with high O3and low C2H6remain even after application of the CFC-11 filter, which presumably is not sensitive enough to remove all stratospheric ozone signal. This sub-optimal behaviour of the CFC-11 filter is attributed to its application on bin aver-ages without consideration of the typically nonlinear corre-lation of O3and CFC-11. Therefore, we restrict the further investigation of plume ozone to the tropical American and South African plumes. The contrast between the O3/C2H6 ratios of the Amazonian and African plumes is not substan-tially changed through this data filter: After application of the filter the mean ratios are 214±27 for the African plume and 167±12 for the Amazonian one.
3.5 Discussion
Tropical rain forest fire emissions mostly occur near the in-ner tropic convergence zone and it is obvious that emitted gases can be rapidly transported to the altitudes of interest (i.e. seen by MIPAS) by convection (Greco et al., 1990; An-dreae et al., 2001). For subtropical savanna fire emissions, the situation is not that clear because of predominant subsi-dence of air masses at these latitudes. Certainly, fires provide additional heating at the surface which enhances convection. Nevertheless, during convection colder ambient air is always mixed into the air parcel to be lifted and it is not quite clear, which altitudes can be reached. Chatfield et al. (2002) report
frequent final pollutant injection by cloud convection over southern Africa in September–October 1997. These authors mention both thunderstorm-scale venting as well as synoptic scale venting as mechanisms of uplifting of pyrogenic pol-lution. However, no pyrogenic deep convection has to our knowledge been reported for subtropical conditions with pre-vailing subsidence. Trentmann et al. (2006) state that the na-ture of pyro-convection is not fully understood, and Luderer et al. (2006) have shown that pyroconvection depends largely on the actual background meteorology. Another mechanism of uplifting pyrogenic pollution under the subsiding branch of the Hadley cell into the upper troposphere has been pro-posed by Andreae et al. (2001): The polluted air is trans-ported into the tropics at lower levels and lofted there by deep convection. Typical uplifting mechanisms for African biomass burning plume air are discussed in Chatfield et al. (1998). The area where pyro-polluted air reaches higher al-titudes was identified to be the Congo basin (c.f. Fig. 5e and f in their paper). In our study, we try to appropriately char-acterize the uplifting and transport process by starting the trajectory calculations at the so-called “injection altitude”, an altitude empirically determined by Labonne et al. (2007) and found consistent with the upper edge of the boundary layer. Tests have shown that the final trajectory pattern is quite robust against variation of the assumed injection alti-tude in a range from 2500 to 4500 m. Certainly, our approach misses any subsynoptic uplifting taking place above the mix-ing layer.
Different plume composition may be caused by different type of vegetation burning, different combustion stage, the actual meteorological conditions including illumination and uplifting mechanisms, aging in different chemical environ-ments, mixing etc. The most probable explanation for the lower O3/C2H6ratio in the Amazonian plume is that rainfor-est fires with predominantly smouldering combustion emit more C2H6 than African biomass burning, where flaming grassland and savanna fires are prevailing (Delmas et al., 1999). The use of C2H6mixing ratios to quantify the plume strength then leads to an overestimated Amazonian plume. The differences between equatorial American and African O3/C2H6ratios is fully consistent with the differenct ratios of C2H6/trajectory densitiy and thus suggest equal ozone pro-duction efficiency in both plumes. Consideration of the dif-ferent emission factors as reported by Andreae et al. (2001) may even suggest a more efficient ozone production on the Amazonian part of the plume. The higher ozone mixing ra-tios detected over Africa are attributed to higher trajectory densities.
Different residence time of pyro-polluted air in the lower troposphere with different prevailing chemistry is, apart from different pollutant source strengths of savanna versus rain-forest and smouldering versus flaming combustion, a fur-ther candidate explanation of different mean O3/C2H6 ra-tios. This would suggest that African savanna-fire pyro-polluted air resides longer in the lower troposphere compared
to its Amazonian counterpart. Long lower tropospheric residence times particularly of African pyro-polluted air have been reported by Edwards et al. (2006) and refer-ences therein. Furthermore, additional upper tropospheric ozone can also be produced by lightning-induced NO2 and thus depends on thunderstorm activity along the actual tra-jectories (Staudt et al., 2002; Edwards et al., 2003). In-deed, at regions covered by trajectories associated with African biomass burning events there was higher thun-derstorm activity in October and November 2003 than at those regions covered by trajectories started at equa-torial American forest fires (http://thunder.nsstc.nasa.gov/ query/2003/2003 october.png and http://thunder.nsstc.nasa. gov/query/2003/2003 november.png). No evidence for a re-lation between the mean age of the trajectories falling within a bin and the O3enhancement has been found.
Ziemke et al. (2006)(their Fig. 5b) inferred tropospheric ozone distributions from Aura OMI and MLS measurements, which show an O3plume extending from tropical America in October and November 2004. This either hints at differ-ent meteorological conditions or fire activity in 2003 versus 2004 (a significant interannual variation of CO emissions has been suggested by Gloudemans et al. (2006)) or may be at-tributed to the fact that their data represent the entire tro-posphere while MIPAS data represent the atmosphere above about 7 km.
The C2H6plume over the Pacific Ocean, west of Colom-bia, Ecuador and Peru deserves some further discussion, since in the altitude of region of interest (7–11 km) this re-gion is only sparsely covered with trajectories starting at fire events. Possibly the uplifting processes are not correctly ac-counted for by the trajectory calculations. Another expla-nation would be urban outflow, e.g. from Mexico City or Panama City.
4 Conclusions
Southern hemispheric C2H6 generated by biomass burn-ing reaches similar abundances as northern hemispheric en-hancements. The MIPAS measurements of southern hemi-spheric C2H6 nicely confirm the spatial extension of the biomass burning plume reported by Edwards et al. (2006) and complement the dataset published by these authors, by adding further information on the chemical composition of the plume. The particular advantage of a Fourier transform spectrometer like MIPAS is that it measures different species (here: C2H6, O3, and CFC-11) in the same airmass at similar altitude resolution, which allows a more straightforward in-terpretation compared to analysis of data products from dif-ferent sensors which have difdif-ferent spatial resolution.
African and South American vegetation burning appears to be the major source of southern hemispheric upper tro-pospheric C2H6 during the episode under analysis, since enhanced mixing ratios are confined to regions covered by
trajectories started above fire events. However, a signal of other anthropogenic pollution sources, e.g. from megacities or industrial plants (Talbot et al., 1996) in the vicinity of for-est fires cannot be excluded. The source of enhanced C2H6 over the Pacific Ocean, Galapagos area, is currently under investigation. At least at tropical latitudes where the possi-bility of contamination of the measured signal by a strato-spheric contribution can safely be excluded, upper tropo-spheric ozone enhancements are confined to the pollution belt. Flaming combustion, which is prevailing in southern African fires, is seen on a hemispheric scale to contribute more efficiently to a high upper tropospheric O3/C2H6ratio than smouldering combustion which is typical for the Ama-zonian rain forest. This is explained by the larger C2H6 emis-sion factors of forest fires, which leads to an overestimation of the related plume strength. The final decision on whether the observed differences in ozone production are primarily driven by different trace gas loading in the plume through different types of combustion, or whether they are driven by different prevailing uplifting processes keeping the air in dif-ferent chemical regimes remains somewhat speculative with-out the explicit consideration of small-scale convective pro-cesses in the trajectory calculation, even if the relevant chem-ical processes within the plume are modelled. Further studies on this and related questions will benefit from MIPAS mea-surements of further biomass-burning related species, par-ticularly CO (Funke et al., 2007), PAN and C2H2(Glatthor et al., 2007), and H2CO (Steck et al., 2007a), which confirm the extension of the plume-like pollution belt in the south-ern hemisphere of 2003. C2H6/CO and C2H2/CO ratios can be used to distinguish between pollution from biomass burn-ing and pollution from megacities (Talbot et al., 1996). More generally speaking, the availability of a series of primary and secondary pollutants can be used to better constrain mod-elling of the chemical processes within the plume.
Furthermore, the analysis of data recorded before and af-ter the biomass burning season is planned in order to de-tect other sources of these pollutants, e.g. megacities and industrial plants. A possible improvement of the absolute accuracy of our C2H6 retrievals by use of the most re-cent spectroscopic data will be investigated. Further stud-ies will also include chemistry transport modelling based on the actual meteorological conditions as well as a com-parison of the biomass burning season of different years. The data of this study are available to registered users via http://www.fzk.de/imk/asf/ame/envisat-data/.
Acknowledgements. The authors like to thank S. Chabrillat, S. Turquety, and an unknown reviewer for their insightful com-ments which have helped a lot to improve the paper. ESA has provided MIPAS Level-1B data. Meteorological analysis data used for retrieval calculations were provided by ECMWF. AL and TS have been funded by Helmholtz Gemeinschaft Deutscher Großforschungszentren under Virtual Institute IMACCO, contract number VH-VI-117. SK has been funded by BMBF under contract number 50 EE 0512.
Edited by: L. Carpenter
References
Andreae, M. O. and Merlet, P.: Emission of trace gases and aerosols from biomass burning, G. Biogeochem. Cycles, 15, 955–966, doi:10.1029/2000GB001382, 2001.
Andreae, M. O., Artaxo, P., Fischer, H., Freitas, S. R., Gr´egoire, J.-M., Hansel, A., Hoor, P., Kormann, R., Krejci, R., Lange, L., Lelieveld, J., Lindinger, W., Longo, K., Peters, W., de Reus, M., Scheeren, B., Silva Dias, M. A. F., Str¨om, J., van Velthoven, P. F. J., and Williams, J.: Transport of biomass burning smoke to the upper troposphere by deep convection in the equatorial region, Geophys. Res. Lett., 28, 951–954, 2001.
Bremer, H., Kar, J., Drummond, J. R., Nichitu, F., Zou, J., Liu, J., Gille, J. C., Deeter, M. N., Francis, G., Ziskin, D., and Warner, J.: Spatial and temporal variation of MOPITT CO in Africa and South America: A comparison with SHADOZ ozone and MODIS aerosol, J. Geophys. Res., 109, D12304, doi:10.1029/2003JD004234, 2004.
Chatfield, R. B., Vastano, J. A., Li, L., Sachse, G. W., and Connors, V. S.: The Great African plume from biomass burning, in : Gen-eralizations from a three-dimensional study of TRACE A carbon monoxide, J. Geophys. Res., 103, 28 059–28 077, 1998. Chatfield, R. B., Guo, Z., Sachse, G. W., Blake, D. R., and Blake,
N. J.: The subtropical global plume in the Pacific Exploratory Mission-Tropics A (PEM-Tropics A), PEM-Tropics B, and the Global Atmospheric Sampling Program (GASP): How tropical emissions affect the remote Pacific, J. Geophys. Res., 4278, doi: 10.1029/2001/JD000497, 2002.
Coheur, P., Herbin, H., Clerbaux, C., Hurtmans, D., Wespes, C., Carleer, M., Turquety, S., Rinsland, C. P., Remedios, J., Hauglus-taine, D., Boone, C. D., and Bernath, P. F.: ACE-FTS observation of a young biomass burning plume: first reported measurements of C2H4, C3H6O, H2CO and PAN by infrared occultation from space, Atmos. Chem. Phys., 7, 5437–5446, 2007,
http://www.atmos-chem-phys.net/7/5437/2007/.
Crutzen, P. J. and Andreae, M. O.: Biomass Burning in the Trop-ics, in: Impact on Atmospheric Chemistry and Biogeochemical Cycles, Science, 250, 1669–1678, 1990.
Delmas, R. A., Druilhet, A., Cros, B., Durand, P., Delon, C., La-caux, J. P., Brustet, J. M., Serca, D., Affre, C., Guenther, A., Greenberg, J., Baugh, W., Harley, P., Klinger, L., Brasseur, P. G. G., Zimmerman, P. R., Gr´egoire, J. M., Janodet, E., Tournier, A., Perros, P., Marion, T., Gaudichet, A., Ruellan, H. C. S., Caut-enet, P. M. S., Bouka Biona, D. P. C., Nganga, D., Tathy, J. P., Minga, A., Loemba–Ndembi, J., and Ceccato, P.: Experiment for Regional Sources and Sinks of Oxidants (EXPRESSO): An overview, J. Geophys. Res., 104, 30 609–30 624, 1999.
Draxler, R. R.: The accuracy of trajectories during ANATEX calcu-lated using dynamic model analyses versus rawinsonde observa-tions, J. Appl. Meteorol., 30, 1446–1467, 1991.
Draxler, R. R. and Hess, G. D.: Description of the HYSPLIT 4 modeling system, NOAA Tech. Memo. ERL ARL-224, 24 pp., 1997.
Draxler, R. R. and Hess, G. D.: An overview of the HYSPLIT 4 modelling system for trajectories, dispersion and deposition,
Aust. Meteorol. Mag., 47, 295–308, 1998.
Edwards, D. P., Lamarque, J.-F., Atti´e, J.-L., Emmons, L. K., Richter, A., Cammas, J.-P., Gille, J. C., Francis, G. L., Deeter, M. N., Warner, J., Ziskin, D. C., Lyjak, L. V., Drummond, J. R., and Burrows, J. P.: Tropospheric ozone over the tropical At-lantic: A satellite perspective, J. Geophys. Res., 108, 4237, doi: 10.1029/2002JD002927, 2003.
Edwards, D. P., Emmons, L. K., Gille, J. C., Chu, A., Atti´e, J.-L., Giglio, L., Wood, S. W., Haywood, J., Deeter, M. N., Massie, S. T., Ziskin, D. C., and Drummond, J. R.: Satellite–observed pollution from Southern Hemisphere biomass burning, J. Geo-phys. Res., 111, D14312, doi:10.1029/2005JD006655, 2006. Fischer, H., Birk, M., Blom, C., Carli, B., Carlotti, M., von
Clar-mann, T., Delbouille, L., Dudhia, A., Ehhalt, D., EndeClar-mann, M., Flaud, J. M., Gessner, R., Kleinert, A., Koopmann, R., Langen, J., L´opez-Puertas, M., Mosner, P., Nett, H., Oelhaf, H., Perron, G., Remedios, J., Ridolfi, M., Stiller, G., and Zander, R.: MI-PAS: an instrument for atmospheric and climate research, Atmos. Chem. Phys. Discuss., 7, 8795–8893, 2007,
http://www.atmos-chem-phys-discuss.net/7/8795/2007/. Fishman, J., Wozniak, A. E., and Creilson, J. K.: Global distribution
of tropospheric ozone from satellite measurements using the em-pirically corrected tropospheric ozone residual technique: Iden-tification of the regional aspects of air pollution, Atmos. Chem. Phys., 3, 893-907, 2003,
http://www.atmos-chem-phys.net/3/893/2003/.
Funke, B., L´opez-Puertas, M., Bermejo-Pantale´on, D., von Clar-mann, T., Stiller, G. P., H¨opfner, M., Grabowski, U., and Kaufmann, M.: Analysis of nonlocal thermodynamic equilib-rium CO 4.7µm fundamental, isotopic and hot band emissions measured by the Michelson Interferometer for Passive Atmo-spheric Sounding on Envisat, J. Geophys. Res., 112, D11305, doi:10.1029/2006JD007933, 2007.
Giglio, L., Kendall, J. D., and Tucker, C. J.: Remote sensing of fires with the TRMM VIRS, Int. J. Remote Sens., 21, 203–207, 2000. Glatthor, N., von Clarmann, T., Fischer, H., Funke, B., Gil-L´opez, S., Grabowski, U., H¨opfner, M., Kellmann, S., Linden, A., L´opez-Puertas, M., Mengistu Tsidu, G., Milz, M., Steck, T., Stiller, G. P., and Wang, D.-Y.: Retrieval of stratospheric ozone profiles from MIPAS/ENVISAT limb emission spectra: a sensi-tivity study, Atmos. Chem. Phys., 6, 2767–2781, 2006,
http://www.atmos-chem-phys.net/6/2767/2006/.
Glatthor, N., von Clarmann, T., Fischer, H., Funke, B., Grabowski, U., H¨opfner, M., Kellmann, S., Kiefer, M., Linden, A., Milz, M., Steck, T., and Stiller, G. P.: Global peroxyacetyl nitrate (PAN) retrieval in the upper troposphere from limb emission spectra of the Michelson Interferometer for Passive Atmospheric Sounding (MIPAS), Atmos. Chem. Phys., 7, 2775–2787, 2007,
http://www.atmos-chem-phys.net/7/2775/2007/.
Gloudemans, A. M. S., Krol, M. C., Meirink, J. F., de Laat, A. T. J., van der Werf, G. R., Schrijer, H., van den Broek, M. M. P., and Aben, I.: Evidence for long-range transport of carbon monoxide in the Southern Hemisphere from SCIAMACHY observations, Geophys. Res. Lett., 33, L16807, doi:10.1029/2006GL02804, 2006.
Greco, S., Swap, R., Garstang, M., Ulanski, S., Shipman, M., Har-riss, R. C., Talbot, R., Andreae, M. O., and Artaxo, P.: Rainfall and surface kinematic condition over central Amazonia during ABLE-2A, J. Geophys. Res., 95, 17 001–17 014, 1990.
Jacquinet-Husson, N., Scott, N. A., Ch´edin, A., and Chursin, A. A.: The GEISA spectroscopic database system updated for IASI (di-rect radiative transfer modeling), Atmos. Oceanic Opt., 16, 256– 261, 2003.
Jain, A. K., Tao, Z., Yang, X., Gillespie, C.: Estimates of global biomass burning emissions for reactive greenhouse gases (CO, NMHCs, and NOx) and CO2, J. Geophys. Res., 111, D06304, doi:10.1029/2005JD006237, 2006.
Labonne, M., Br´eon, F., and Chevallier, F.: Injection height of biomass burning aerosols as seen from a spaceborne lidar, Geo-phys. Res. Lett., 34, L11806, doi:10.1019/2007GL029311, 2007. Lobert, J. M. and Warnatz, J.: Emissions from the Combustion Pro-cess in Vegetation, in: Fire in the Environment: The Ecologi-cal, Atmospheric, and Climatic Importance of Vegetation Fires, edited by: Crutzen, P. J. and Goldammer, J. G., John Wiley and Sons Ltd, 15–51, 1993.
Luderer, G., Trentmann, J., Winterrath, T., Textor, C., Herzog, M., Graf, H. F., and Andreae, M. O.: Modeling of biomass smoke injection into the lower stratosphere by a large forest fire (Part II): sensitivity studies, Atmos. Chem. Phys., 6, 5261–5277, 2006, http://www.atmos-chem-phys.net/6/5261/2006/.
Mauzerall, D. L., Logan, J. A., Jacob, D. J., Anderson, B. E., Blake, D. R., Bradshaw, J. D., Heikes, B., Sachse, G. W., Singh, H., and Talbot, B.: Photochemistry in biomass burning plumes and implications for tropospheric ozone over the tropical South At-lantic, J. Geophys. Res., 103, 8401–8423, 1998.
Nett, H., Carli, B., Carlotti, M., Dudhia, A., Fischer, H., Flaud, J.-M., Perron, G., Raspollini, P., and Ridolfi, M.: MIPAS Ground Processor and Data Products, in: Proc. IEEE 1999 International Geoscience and Remote Sensing Symposium, 28 June–2 July 1999, Hamburg, Germany, 1692–1696, 1999.
Norton, H. and Beer, R.: New apodizing functions for Fourier spec-trometry, J. Opt. Soc. Am, 66, 259–264, (Errata J. Opt. Soc. Am., 67, 419, 1977), 1976.
Rinsland, C. P., Dufour, G., Boone, C., Bernath, P., and Chiou, L.: Atmospheric Chemistry Experiment (ACE) measurements of elevated Southern Hemisphere upper tropospheric CO, C2H6, HCN, and C2H2mixing ratios from biomass burning emissions and long–range transport, Geophys. Res. Lett., 32, L20803, doi: 10.1029/2005GL024214, 2005.
Rodgers, C. D.: Inverse Methods for Atmospheric Sounding: The-ory and Practice, World Scientific, 2000.
Rothman, L. S., Barbe, A., Benner, D. C., Brown, L. R., Camy-Peyret, C., Carleer, M. R., Chance, K., Clerbaux, C., Dana, V., Devi, V. M., Fayt, A., Flaud, J.-M., Gamche, R. R., Goldman, A., Jacquemart, D., Jucks, K. W., Lafferty, W. J., Mandin, J.-Y., Massie, S. T., Nemtchinov, V., Newnham, D. A., Perrin, A., Rins-land, C. P., Schroeder, J., Smith, K. M., Smith, M. A. H., Tang, K., Toth, R. A., Vander Auwera, J., Varanasi, P., and Yoshino, K.: The HITRAN molecular spectroscopic database: edition of 2000 including updates through 2001, J. Quant. Spectrosc. Ra-diat. Transfer, 82, 5–44, doi:10.1016/S0022-4073(03)00146-8, 2003.
Spang, R., Remedios, J. J., and Barkley, M. P.: Colour indices for the detection and differentiation of cloud types in infra-red limb emission spectra, Adv. Space Res., 33, 1041–1047, 2004. Staudt, A. C., Jacob, D. J., Logan, J. A., Bacchiochi, D.,
Krish-namurti, T. N., and Poisson, N.: Global chemical model analy-sis of biomass burning and lightning influences over the South
Pacific in austral spring, J. Geopys. Res., 107(D14), 4200, doi: 10.1029/2000JD000296, 2002.
Steck, T., Glatthor, N., von Clarmann, T., Fischer, H., Funke, B., Grabowski, U., H¨opfner, M., Kellmann, S., Linden, A., Per-rin, A., and Stiller, G. P.: Retrieval of global upper tropospheric formaldehyde H2CO distributions from high-resolution MIPAS-Envisat spectra, Atmos. Chem. Phys. Discuss., 7, 13 627–13 652, 2007a.
Steck, T., von Clarmann, T., Fischer, H., Funke, B., Glatthor, N., Grabowski, U., H¨opfner, M., Kellmann, S., Kiefer, M., Linden, A., Milz, M., Stiller, G. P., Wang, D. Y., Allaart, M., Blumen-stock, T., von der Gathen, P., Hansen, G., Hase, F., Hochschild, G., Kopp, G., Kyr¨o, E., Oelhaf, H., Raffalski, U., Redondas Mar-rero, A., Remsberg, E., Russell III, J., Stebel, K., Steinbrecht, W., Wetzel, G., Yela, M., and Zhang, G.: Bias determination and precision validation of ozone profiles from MIPAS-Envisat retrieved with the IMK-IAA processor, Atmos. Chem. Phys., 7, 3639–3662, 2007b.
Talbot, R. W., Bradshaw, J. D., Sandholm, S. T., Smyth, S., Blake, D. R., Blake, N. R., Sachse, G. W., Collins, J. E., Heikes, B. G., Anderson, B. E., Gregory, G. L., Singh, H. B., Lefer, B. L., and Bachmeier, A. S.: Chemical characteristics of continental outflow over the tropical South Atlantic Ocean from Brazil and Africa, J. Geophys. Res., 101, 24 187–24 202, 1996.
Trentmann, J., Luderer, G., Winterrath, T., Fromm, M. D., Textor, C., Herzog, M., Graf, H. F., and Andreae, M. O.: Modeling of biomass smoke injection into the lower stratosphere by a large forest fire (Part I): reference simulation, Atmosp. Chem. Phys., 6, 5247–5260, 2006.
Vander Auwerra, J., Moazzen-Ahmadi, N., and Flaud, J.: Toward an accurate database for the 12 µm region of the ethane spectrum, Astrophys. J., 662, 750–757, 2007.
von Clarmann, T., Glatthor, N., Grabowski, U., H¨opfner, M., Kell-mann, S., Kiefer, M., Linden, A., Mengistu Tsidu, G., Milz, M., Steck, T., Stiller, G. P., Wang, D. Y., Fischer, H., Funke, B., Gil-L´opez, S., and L´opez-Puertas, M.: Retrieval of temper-ature and tangent altitude pointing from limb emission spectra recorded from space by the Michelson Interferometer for Passive Atmospheric Sounding (MIPAS), J. Geophys. Res., 108, 4736, doi:10.1029/2003JD003602, 2003.
Ziemke, J. R, Chandra, S., Duncan, B. N., Froidevaux, L., Bhar-tia, P. K., Levelt, P. F., and Waters, J. W.: Tropospheric ozone determined from Aura OMI and MLS: Evaluation of measure-ments and comparison with the Global Modeling Initiative’s Chemical Transport Model, J. Geophys. Res., 111, D19303, doi: 10.1029/2006JD007089, 2006.