HAL Id: hal-02080771
https://hal.archives-ouvertes.fr/hal-02080771
Submitted on 27 Mar 2019
HAL is a multi-disciplinary open access
archive for the deposit and dissemination of
sci-entific research documents, whether they are
pub-lished or not. The documents may come from
teaching and research institutions in France or
abroad, or from public or private research centers.
L’archive ouverte pluridisciplinaire HAL, est
destinée au dépôt et à la diffusion de documents
scientifiques de niveau recherche, publiés ou non,
émanant des établissements d’enseignement et de
recherche français ou étrangers, des laboratoires
publics ou privés.
Improving headspace-solid-phase microextraction of
3-isobutyl-2-methoxypyrazine by experimental design
with regard to stable isotope dilution gas
chromatography–mass spectrometric analysis of wine
Cécile Prouteau, Rémi Schneider, Yolande Peres-Lucchese, Françoise Nepveu,
Romain Renard, Carlos Vaca-Garcia
To cite this version:
Cécile Prouteau, Rémi Schneider, Yolande Peres-Lucchese, Françoise Nepveu, Romain Renard, et al..
Improving headspace-solid-phase microextraction of 3-isobutyl-2-methoxypyrazine by experimental
design with regard to stable isotope dilution gas chromatography–mass spectrometric analysis of wine.
Analytica Chimica Acta, Elsevier Masson, 2004, 513 (1), pp.223-227. �10.1016/j.aca.2003.11.083�.
�hal-02080771�
OATAO is an open access repository that collects the work of Toulouse
researchers and makes it freely available over the web where possible
Any correspondence concerning this service should be sent
to the repository administrator:
[email protected]
This is an author’s version published in:
http://oatao.univ-toulouse.fr/2324
6
To cite this version:
Prouteau, Cécile
and Schneider, Rémi and Peres-Lucchese, Yolande
and
Nepveu, Françoise and Renard, Romain and Vaca-Garcia, Carlos
Improving
headspace-solid-phase microextraction of 3-isobutyl-2-methoxypyrazine by
experimental design with regard to stable isotope dilution gas chromatography–
mass spectrometric analysis of wine. (2004) Analytica Chimica Acta, 513 (1).
223-227. ISSN 0003-2670
Improving headspace-solid-phase microextraction of
3-isobutyl-2-methoxypyrazine by experimental design with
regard to stable isotope dilution gas chromatography–mass
spectrometric analysis of wine
Cécile Prouteau
a,∗, Rémi Schneider
b, Yolande Lucchese
a, Françoise Nepveu
c,
Romain Renard
d, Carlos Vaca-Garcia
eaENSIACET Laboratoire de Contrˆole, 118 rte de Narbonne 31077 Toulouse Cedex 4, France bITV France, détaché à l ‘INRA-UMR-SPO, 2 place Viala, 34060 Montpellier, France
cLaboratoire Pharmacochimie des Substances Naturelles et Pharmacophores Redox (UMR IRD-UNC-UPS U152),
Faculté des Sciences Pharmaceutiques, Université Paul Sabatier, 35, chemin des Maraˆıchers, F-31062 Toulouse Cedex 4, France
dStation régionale ITV Midi-Pyrénées V’innopˆole Brames-A¨ıgues BP22 81310 Lisle/Tarn, France eENSIACET Laboratoire de Chimie Agro-Industrielle, 118 rte de Narbonne 31077 Toulouse Cedex 4, France
Abstract
To solve problems of sensitivity, repeatability and multi-step extraction related to 3-isobutyl-2-methoxypyrazine (IBMP) determination in wines, a simple method based on the novel combination of solid-phase microextraction and stable isotope dilution assay is presented. Among the parameters that affect this type of extraction, five of them have been optimised since the other parameters have common values or do not require optimisation (e.g. addition of sodium chloride at saturated concentration) and so were fixed. Vial volume, sample volume/vial volume ratio, pH, adsorption time and temperature have been optimised by means of two experimental designs. After extraction, quantification was performed by stable isotope dilution with gas chromatography-tandem mass spectrometry ([2H
2]-IBMP as internal standard). The final
procedure allowed quantification far below IBMP’s sensory threshold (1 ng l−1versus 15 ng l−1) with a 4% standard deviation. This method has
been applied to experimental Fer servadou wines. Comparison of IBMP contents confirmed the efficiency of some viticultural and enological techniques on the herbaceous flavour decrease, such as prior fermentation maceration at high temperature (70 ◦C) and the use of a reflective
carpet on viticultural soil.
Keywords: Solid-phase microextraction; Stable isotope dilution; Experimental design; Wine; 3-Isobutyl-2-methoxypyrazine
1. Introduction
The Fer servadou grape variety (Vitis vinifera cv. Fer
ser-vadou) comes from south-west France. This variety belongs
to the same family as Cabernet Sauvignon. Among its va-rietal key aroma compounds, 3-alkyl-2-methoxypyrazines have been identified, in particular 3-isobutyl-2-methoxypy-razine (IBMP), known for its contribution to the green bell pepper odour. This compound is present at very low
con-∗Corresponding author. Tel.: +33-5-34-61-52-83;
fax: +33-5-34-61-52-53.
E-mail address: [email protected] (C. Prouteau).
centrations (10–50 ng l−1 in wines and up to 80 ng l−1 in grapes) but IBMP has a high odorant potency since its sen-sory threshold was reported to be 10 ng l−1in red wines[1]. To diminish the IBMP concentration, wine makers eval-uated different techniques based on thermolability and photosensitivity of IBMP [2], such as prior fermentation maceration at high temperature or the use of a reflective carpet on viticultural soil. A reliable analysis for IBMP is then needed for evaluating effects of those technical developments and also environmental factors.
Detection of volatiles at low concentrations (ng l−1) re-quires an extraction-concentration step coupled to a very sensitive analytical technique. Several doi:10.1016/j.aca.2003.11.083
tion methods have been used: extraction by cation-exchange resin, liquid–liquid extraction [3] and a method based on headspace-solid-phase microextraction (HS-SPME) after concentration by evaporation [4]. All these extractions are multi-step, time-consuming and laborious. The analy-sis can be performed either by gas chromatography (GC) with nitrogen–phosphorus detection (NPD) (non-labelled internal standard) or by GC-mass spectrometry (MS) using deuterium labelled [2H2]-IBMP. Recently, an attempt to simplify the extraction step to only one, SPME, followed by GC-NPD for analysis encountered sensitivity and re-peatability problems (coefficient of variation = 8–18%) [5]. To solve these problems and also to permit automa-tion, we chose to combine SPME with stable isotope dilution GC. This type of calibration, using deuterium la-belled [2H2]-IBMP as internal standard, is performed by GC-MS/MS.
This combination seems to be appropriate since the two molecules (target and standard) react in the most similar behaviour with the extraction fibre. After optimisation of the SPME conditions, the described method has been applied to wine samples.
2. Experimental 2.1. Reagents
3-Isobutyl-2-methoxypyrazine [24683-00-9] was supplied by Aldrich. The purity of the standard was >99%. The la-belled [2H2]-IBMP was synthesized as described in [6]. Stock solutions of 1 g l−1 were prepared in RP Normapur absolute ethanol (Prolabo), and stored in the dark at +4◦C. To adjust the pH, potassium hydroxide (85% ACS reagent, Aldrich) at 200 g l−1was used.
A wine model solution contained in 1 l of demineralised water 6 g of glycerol (Aldrich), 2.5 g of l-(+)-tartaric acid (Aldrich), 3 g of l-(+)-lactic acid (Fluka), 1 g of potassium phosphate (Aldrich), 11% absolute ethanol (Prolabo), pH adjusted to 3.5.
2.2. SPME procedure
An SPME manual device and 65 mm polydimethylsil-oxane-divinylbenzene (PDMS-DVB) fibres were purchased from Supelco. To prevent contamination, each fibre was con-ditioned and cleaned before and after use by inserting it into the GC injector at the recommended temperature. A visual daily control is assumed (colour, coating state . . . ).
For optimisation, parameters were fixed as mentioned in the experimental design section and as described inTable 1. The final procedure for calibration was as follows: 25 ml of a wine solution was adjusted to the optimum pH (6.6) with potassium hydroxide solution (200 g l−1) and spiked with 10.5 ng l−1[2H2]-IBMP. Ten millilitres of this solution was transferred into a 20 ml vial containing 3 g of sodium
Table 1
SPME optimised parameters values for experimental designa Parameter Previous method
for musts[7] Geometry Adsorption Vs/Vv (ml) 0.5 Variable 0.5 Vv (ml) 20 Variable 20 pH 8.5 8.5 Variable Adsorption temperature (◦C) 40 40 Variable
Adsorption time (min) 240 240 Variable
a Saturated NaCl, magnetic stirring, desorption at 240◦C, 5 min
des-orption time.
chloride and a magnetic stirrer. The vial was immediately capped with a PTFE-faced silicone septum/aluminium crimp cap. The extraction was performed in the headspace over 165 min at 27◦C, with constant stirring.
2.3. Experimental design
Among all the parameters affecting the extraction quality, most have identical values in the published SPME methods. This is the case with salt concentration, which is commonly sodium chloride at saturation, and with magnetic stirring. In the same way, a compromise between desorption time and temperature should be achieved in order to avoid carry-over. Therefore, only five parameters have to be optimised: vial volume (Vv), ratio between the sample volume and vial volume (Vs/Vv), sample pH, adsorption temperature and adsorption time. Instead of studying the five parameters together, this was simplified by dividing them into two groups, by grouping the interdependent parameters.
Vv and Vs/Vv were evaluated together using a two-factor full factorial experimental design. They define the geome-try of the headspace but do not facilitate molecules to pass from aqueous phase to the headspace. Vial volume choice was restricted to 20 and 50 ml. These volumes are different enough and contain a reasonable sample quantity. Vs/Vv ad-viced by the constructor is ca. 75%. This value and a smaller one were selected.Table 2shows the experimental domain. The matrix of the experiments is presented inTable 3.
Table 2
Experimental domain for “geometry” experimental design
Factor Parameter Level −1 Level +1
X1 Vial volume (ml) 20 50
X2 Sample volume/vial volume 0.5 0.75 Table 3
Two-factors full factorial experimental design
Experiment X1 X2
1 −1 −1
2 +1 −1
3 −1 +1
Table 4
Three-factors Doelhert experimental design (13 assays plus 2 centre rep-etitions) Experiment X1 X2 X3 1 0 0 0 2 1 0 0 3 0.5 0.866 0 4 −0.5 0.866 0 5 −1 0 0 6 −0.5 −0.866 0 7 0.5 −0.866 0 8 0.5 0.289 0.816 9 −0.5 0.289 0.816 10 0 −0.577 0.816 11 0.5 −0.289 −0.816 12 −0.5 −0.289 −0.816 13 0 0.577 −0.816 14 0 0 0 15 0 0 0
After the “geometry” experimental design, a second ex-perimental design was planned to evaluate the last three pa-rameters. A three-factor Doelhert design was used and 2 centre points were added to ensure enough degrees of free-dom for experimental error evaluation (Table 4). After attri-bution of parameters to factors according to the number of levels, the experimental domain was determined and listed inTable 5.
Each design was tested with the same fibre on a wine model solution spiked with IBMP at 1 mg l−1. Quality eval-uation was performed through a GC-NPD analysis, by mea-suring of IBMP peak area. The higher the peak area, the bet-ter is the extraction. Data analysis was performed by means of the statistical software Mathcad®(Mathsoft, Cambridge, UK).
2.4. GC analysis
2.4.1. HS-SPME-GC-NPD analysis for HS-SPME optimisation
Since, under same experimental conditions, [2H
2]-IBMP behaved similarly to IBMP, this study was restricted to IBMP only. Chromatographic analysis was performed with a Trace 2000 (Thermofinnigan) equipped with a nitrogen–phosphorus detector (NPD) system. The NPD temperature was 300◦C. The make-up gas was nitrogen flowing at 15 ml min−1. The source current was adjusted to 13 pA and the polarisation tension was fixed at 3.5 V.
Table 5
Experimental domain for Dolhert experimental design
Factor Parameter Level −1 Level 0 Level +1 X1 Adsorption time (min) 60 180 300 X2 Adsorption
temperature (◦C)
30 55 80
X3 pH 6 7.5 9
Detector gas flows were: 1.7 ml min−1 H2, 15 ml min−1 N2and 60 ml min−1air. The carrier gas was hydrogen flow-ing at 1 ml min−1. The injection was done in the splitless mode for 3 min at 240◦C.
The oven temperature was programmed as follows: 50◦C (3 min), then a first ramp (40◦C min−1) to 90◦C, then a second ramp (4◦C min−1) to 140◦C. The final temperature was raised to 230◦C at 20◦C min−1and was maintained for 10 min.
A BPX5 (30 m × 0.32 mm × 0.25 mm) capillary column was used. Data handling was performed by Chromquest soft-ware (Thermofinnigan, Courtaboeuf, France).
2.4.2. HS-SPME-GC-MS/MS for analysis
Analysis was carried out using a Varian Saturn 2000 gas chromatograph-ion trap mass spectrometer (GC-ITMS). A DBWAX-ETR (30 m ×0.25 mm ×0.5 mm) capillary column was used. Desorption was realised in the splitless mode over 5 min at 240◦C, with CO
2cryogenic focussing at the top of the column.
The oven temperature program is the same as already described.
The carrier gas was helium N60 flowing at 1.0 ml min−1. The temperatures of the transfer line and ion trap were 170 and 150◦C, respectively. Detection was performed by elec-tron impact (EI) MS/MS in the multiple reactions monitor-ing mode, with the followmonitor-ing parameters: scan channel 1, parent ion m/z 124 with an isolation window of 1 amu in non-resonant mode, excitation storage 40.7m/z, excitation amplitude of 38 eV; scan channel 2, parent ionm/z 126 with an isolation window of 1 amu in non-resonant mode, exci-tation storage 41.4m/z, excitation amplitude 40 eV. Natural and deuterated IBMP were quantified using the ionsm/z 95 and 97, respectively. The ionsm/z 81, 109, 124 and m/z 81, 109, 126 were used as qualifiers.
2.5. Wine samples
Fer servadou experimental wines were made at the ex-perimental cellar of ITV at Gaillac. They are derived from different plots and from different harvest dates. All samples were stored in dark bottles at +4◦C until analysed.
3. Results and discussion 3.1. Experimental design 3.1.1. Geometric factors
Two vial volumes were tested: 50 and 20 ml. Ratios Vs/Vv of 75 and 50% were also tested. The results are shown in Fig. 1. No modelling was sought. The highest response was tracked and tested to show if it was significantly different from the others.
By means of the Student’st-test and standard deviation (n = 5 on assay 1), the equivalence between answers Y1,
Fig. 1. “Geometry” experimental design results (Yi response = IBMP peak area).
the highest response, and Y2 and Y4, was established. The poor extraction of assay 3 can be explained by the inad-equate configuration of extraction: a long and narrow vial compared to a large volume of sample. Magnetic stirring was not sufficient to homogenise the sample and the headspace was too confined. Among assays 1, 2 and 4, few sample quantity consumer conditions were retained. So extraction will proceed in a 20 ml vial sample filled to 50%.
3.1.2. Adsorption factors
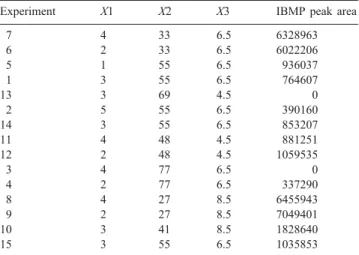
Rising temperatures defined the order of experiments. Data underlined that the temperature domain was too high; in fact the IBMP peak area decreased strongly when the temperature exceeded 48◦C. This can be explained by the thermolability of the molecule and by preferential molecule transfer from fibre to headspace gas phase. That is the reason why experiments 8 and 9 were carried out at 27◦C instead of 62◦C as expected. The results are presented inTable 6.
The area prediction calculated model is given by the following relation: area = 949 503 − 264 033X1 − 3 408 018−1 327 344X3−154 891X1X2−333 265X1X3− 1 414 976X2X3 − 299 017X12 + 3 006 790X22 − 2 759 914X32.
Table 6
Adjusted matrix of Doelhert experimental design presenting results in realisation order
Experiment X1 X2 X3 IBMP peak area
7 4 33 6.5 6328963 6 2 33 6.5 6022206 5 1 55 6.5 936037 1 3 55 6.5 764607 13 3 69 4.5 0 2 5 55 6.5 390160 14 3 55 6.5 853207 11 4 48 4.5 881251 12 2 48 4.5 1059535 3 4 77 6.5 0 4 2 77 6.5 337290 8 4 27 8.5 6455943 9 2 27 8.5 7049401 10 3 41 8.5 1828640 15 3 55 6.5 1035853
Fig. 2. Residues analysis. Evaluation of model adjustment. Points are well distributed on both sides.
Coefficient uncertainties: ±126008; ±124190; ±127481; ±225742; ±222489; ±310260; ±393057; ±206225; ±194143; ±310185.
Several indicators were used to evaluate the model ad-justment: R2 (0.9972), adjusted R2 (0.9922) and residues analysis (Fig. 2). These values shown that the lack of ad-justment is not too large. The model represents satisfactorily the IBMP peak area variations as a function of temperature, pH and adsorption time.
Next, canonical analysis and iso–response curves allowed the optimum conditions to be found. Firstly, stationary point co-ordinates were calculated (−0.38; +0.48; −0.34). This point belongs to the experimental domain, thus an RT-type canonical analysis will be performed. The results of the anal-ysis permit the conclusion that a pH ca. 6.6, 165 min ad-sorption time at 27◦C are the optimal conditions. Compared to previous SPME extractions[4,7], the adsorption time has been considerably reduced without introducing any fastidi-ous and time-consuming sample preparation step.
3.2. Validation
For calibration, linear regression analysis of relative areas versus relative concentrations of [2H2]-IBMP and IBMP was used. The calibration equation based on 5 points (3 repli-cated) is: areaIBMP/area[2H
2]-IBMP=2.02 × [IBMP] + 0.71
(r2=0.9884, n = 15).
Fig. 3. IBMP amount in Fer servadou wines obtained from different harvest dates.
Table 7
IBMP amount in Fer servadou wines obtained from plots where different techniques have been used
Techniques [IBMP] (ng l−1)
Control sample 14
Thin out the leaves under grapes Not detected Prior-fermentation maceration at 70◦C 5
Reflective carpet 5
The limit of detection (LOD) was estimated from the min-imum concentration found in analysed wines. The LOD was calculated on the basis of a signal/noise ratio of 3. The LOD is 1 ng l−1, which is far below the sensory threshold. More accurate precision is not needed. The repeatability (4%) was established from 5 repetitions of an analysis.
3.2.1. Analysis of wine samples
Some Fer servadou wines have been analysed by the new method. Harvest date influence (Fig. 3) and viticultural tech-niques (Table 7) impact on the IBMP amount measured. With a late harvest date the IBMP concentration decrease and can be lower than the sensory threshold. With a late harvest date the IBMP concentration can be lower than the sensory threshold. Therefore, it is interesting not to harvest too early. Furthermore, plots do not have the same “IBMP potential”, it depends on soil and exposure. A sandy soil (La-grave) will warm up quickly and reflect to the grapes ther-mal and luminous energy. This phenomenon favours IBMP degradation. To reflect soil IBMP potential, it would be in-teresting to study Fer servadou plots. It could be used to clas-sify the plots according to their IBMP potential and could influence the plots harvest order. Finally, results confirm the efficiency of the viticultural (preventive) and enological (cu-rative) techniques used.
4. Conclusions
The method’s sensitivity for detection of IBMP is far below the sensory threshold. Moreover the repeatability is lower than expected for SPME extraction (CV ca. 12%), this by the use of stable isotope dilution assay. This latter method seems to fit very well this kind of extraction. The solvent-free method developed will be used in a semi-routine way. It has a lot of applications and will, for example, be very useful to determine the best harvest date according to aroma maturity.
Acknowledgements
This work has been funded by the “Station régionale ITV Midi-Pyrénées” (Gaillac, France). The authors are also grateful to UNICOR and Thermofinnigan for their support.
References
[1] Y. Kotseridis, A. Anocibar Beloqui, A. Bertrand, J.P. Doazan, Am. J. Enol. Vitic. 49 (1998) 44.
[2] D. Roujou de Boubée, Doctoral work, Université Victor Segalen Bor-deaux 2, 2000, p. 170.
[3] M.J. Lacey, M.S. Allen, R.L.N. Harris, W.V. Brown, Am. J. Enol. Vitic. 42 (1991) 103.
[4] C. Sala, M. Mestres, M.P. Marti, O. Busto, J. Guasch, J. Chromatogr. A 953 (2002) 1.
[5] P.J. Hartmann, H.M. McNair, B.W. Zoecklein, Am. J. Enol. Vitic. 53 (2002) 285.
[6] Y. Kotseridis, R. Baumes, G.K. Skrouroumounis, J. Chromatogr. A 824 (1998) 71.
[7] C. Sala, M. Mestres, M.P. Marti, O. Busto, J. Guasch, J. Chromatogr. A 880 (2000) 93.