HAL Id: hal-02064210
https://hal.archives-ouvertes.fr/hal-02064210
Submitted on 11 Mar 2019
HAL is a multi-disciplinary open access
archive for the deposit and dissemination of sci-entific research documents, whether they are pub-lished or not. The documents may come from teaching and research institutions in France or abroad, or from public or private research centers.
L’archive ouverte pluridisciplinaire HAL, est destinée au dépôt et à la diffusion de documents scientifiques de niveau recherche, publiés ou non, émanant des établissements d’enseignement et de recherche français ou étrangers, des laboratoires publics ou privés.
Determination of ethylphenol compounds in wine by
headspace solid-phase microextraction in conjunction
with gas chromatography and flame ionization detection
Marie-Carmen Monje, Christelle Privat, Valérie Gastine, Françoise Nepveu
To cite this version:
Marie-Carmen Monje, Christelle Privat, Valérie Gastine, Françoise Nepveu. Determination of ethylphenol compounds in wine by headspace solid-phase microextraction in conjunction with gas chromatography and flame ionization detection. Analytica Chimica Acta, Elsevier Masson, 2002, 458 (1), pp.111-117. �10.1016/S0003-2670(01)01528-8�. �hal-02064210�
OATAO is an open access repository that collects the work of Toulouse
researchers and makes it freely available over the web where possible
Any correspondence concerning this service should be sent
to the repository administrator:
[email protected]
This is an author’s version published in:
http://oatao.univ-toulouse.fr/23184
To cite this version:
Monje, Marie-Carmen
and Privat, Christelle and Gastine, Valérie and
Nepveu, Françoise Determination of ethylphenol compounds in wine by
headspace solid-phase microextraction in conjunction with gas
chromatography and flame ionization detection. (2002) Analytica Chimica
Acta, 458 (1). 111-117. ISSN 0003-2670
Determination of ethylphenol compounds in wine by headspace
solid-phase microextraction in conjunction with gas
chromatography and :flame ionization detection
Marie-Carmen Monje, Christelle Privat, Valérie Gastine, Françoise Nepveu*
Laboratoire Pharmacophares Redox, Phytochimie et Radiobiologie EA-3030, Université Paul Sabatier, EA-3030, 35 Chemin des Maraîchers, 31062 Toulouse Cedex 4, France
Abstract
Headspace solid phase microextraction (HS-SPME) was investigated as a solvent-free alternative method for the extraction and determination of 4-ethylphenol (EP) and 4-ethylguaiacol (EG) in red wine by capillary gas chromatography with !lame ionization detection (FID) and compared to liquid-liquid extraction.
For HS-SPME, better results were obtained with saturated sodium chloride samples, at 55 'C, nsing a 85 µm polyacrylate fi ber. An absorption time of 40 min was needed to reach the absorption equilibrium for EG. This 40-min duration corresponds to the beginning ofEP equilibrium and was selected for the experiments. In these conditions, the calibration graphs were linear in the range 5-5000 µg 1-1 and the sensitivity was nearly the same for the two compounds. The detection limits were in the low µg 1-1 range. In mode! wine solutions, result obtained with the liquid-liquid extraction method exhibit a linear calibration
between 25 and 10,000 µg 1-1 with a detection limitofl µg 1-1, but, the relative standard deviations oftheEP and EG result in
the low concentration range ( <50 µg 1-1) are higher !han those obtained by HS-SPME (15% compared to 2% for EP and 12% compared to 5% for EG). Taking into account the numerous volatile compounds in wine, HS-SPME is a rapid and valid alter-native technique for use in the determination of ethylphenols at trace levels. - ·
Keywords: Ethylphenols; Red wine; Headspace analysis; Solid phase microextaction; Gas chromatography
1. Introduction
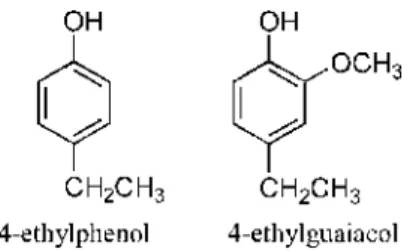
Among the volatile phenols contributing to the aroma of wine, some may be produced by yeasts. For exarnple, Brettanomyces/Dekkera produces 4-ethylphenol (EP) and 4-ethylguaiacol (EG) (Fig. 1) [1-4]. The aroma associated with EP in red wine has been described as "animal"-, "horsy" -, '"barnyard1' -,
"medicinal"-like [5-7] while EG has been described • Corresponding author. Tel.: +33-5-62256869;
fax: +33-5-62256888.
E-mail address: [email protected] (F. Nepveu).
as a "smoky"-, "clove"-like arnma [5,6,8-10]. These volatile phenols are ahnost ubiquitous in red wines but their concentrations vary considerably giving, at higher levels, heavy and undesirable odors. So, winemakers have to control yeast development and understand how winemaking and storage processes may affect the concentration of EP and EG. For this purpose, procedures have to be developed to facilitate rapid wine sarnple analysis both in the laboratory and on-site.
Analysis of volatile compounds such as aromas, pollutants and solvents is a continuous challenge in the food and beverage industries. Although varions
Fig. 1. Structures of 4-ethylphenol and 4-ethylguaiacol.
ques such as gas chromatography (GC), liquid chro-matography (LC) and their combination with mass spectro-metry (MS), can be used for food analysis, most analytical instruments cannot handle the sam-ple matrices directly. Consequently, several multi-extractions, have been developed but they are time-consuming, involve expensive and hazardous sol-vents, and produce low accuracy due to the manual handling. Some of them have been adapted for the determination of volatile phenols in wine. Chaton-an extraction with dichloromethChaton-ane coupled with a
to analyze pentane:diethylether (2:1) extracts of wine containing EG and EP [11]. In both cases, these methods were useful to correlate ethylphenol concentrations with Brettanomyces/Dekkera con-tamination and determine the ethylphenol concen-tration range in a large variety of wine samples [1,2,11].
Recently, headspace solid phase microextraction (HS-SPME) coupled to GC has gained a sturdy repu-previously used for the analysis of volatile com-used to determine aroma compounds in wine but has still not been optimized for ethylphenol determination [11,15,16].
The purpose of this work was to optimize the
through calibration graphs for model wine solutions and through quantitation of volatile phenols in red wine.
2. Experimental
2.1. Reagents
The gases for chromatographic analysis were pur-chased from AGA (Toulouse, France). The
polyacry-late 85 m
France). Ethanol was obtained from SDS (Peypin, France), and 4-ethylguaiacol from Lancaster (Stras-bourg, France). All other reagents were purchased Fallavier, France).
2.2. Preparation of model wine solution and standard solutions
The model wine solution was prepared in distilled water containing 11% (v/v) ethanol, 6 g l 1glycerine, 2.5 g l 1 tartaric acid, 3 g l 1 lactic acid and 1 g l 1 potassium phosphate. The pH of the resulting solution was 3.
A standard stock solution of each volatile phenol (EP, EG and 3,4-dimethylphenol) was prepared by mass at 1000 mg l 1 in the model wine solution. Sec-ondary standard solutions of EP and EG were prepared by dilution of the stock solution in the model wine solution to obtain concentrations of 10 mg l 1. 2.3. Procedure
2.3.1. Calibration
Calibration graphs for EP and EG in the range
g l 1 were plotted in model wine
solu-tions using primary and secondary standard solusolu-tions. 3,4-Dimethylphenol was used as internal standard (IS) for calibration and quantitation of the ethylphe-nol compounds. Its concentration in the sample was
5 mg l 1 for the HS-SPME procedure and 10 mg l 1
2.3.2. Chromatographic analyses
Analyses were carried out on a DANI GC 1000
gas chromatograph equipped with a hydrogen
(30 m 0 32 mm 0 25 m) from Alltech
(Tem-pleuve, France). Nitrogen was used as carrier gas at a
used in the splitless mode (ratio 1:25) and maintained at 250 C. The detector was kept at 250 C. The column program was as follows: initial temperature
40 C at 10 C min 1,
kept at 180 C for 0.5 min, second ramp to 205 C at 3 C min 1, kept at 205 C for 0.5 min, third ramp to 230 C at 10 C min 1, kept at 230 C for 5 min. carrier gas and the GC apparatus to trap oxygen and water present in the nitrogen.
2.3.3. Solid-phase microextraction procedure
5 ml vial containing NaCl (1 g), 3,4-dimethylphenol (5 mg l 1) and sealed with a septum-type cap. HS-SPME was carried out under magnetic stirring. The solutions were heated to 55 C and extracted with a 85
the vial headspace. The compounds were desorbed by
Volatile phenols were extracted from samples acco-rding to the method previously described by Chatonnet and Boidron [5]. First, the IS (3,4-dimethylphenol, 10,000 g l 1) was added to the sample (50 ml). Then 15 g of ammonium sulfate were added and well dis-solved prior to extraction three times with 10, 5 and 2.5 ml of dichloromethane, successively. The com-bined organic extracts were centrifuged (10,000 for 5 min) to break any emulsion, and washed twice with 5% sodium bicarbonate, then extracted twice with 25 and 12.5 ml of 0.5% sodium hydroxyde solu-pH 1 by adding 20% hydrochloric acid, then extracted with 7.5, 2.5 and 2.5 ml of diethyl ether, successively. The combined ether extracts were slowly concentrated to 0.5 ml at room temperature by evaporation under a chromatographic analysis was performed by injecting 1 l of the concentrated extract.
2.4. Statistical analysis
Results are expressed as means S E of n
exper-iments. Statistical comparisons were made using the t-test. The P-value was considered
0 05.
3. Results and discussion
The study and optimization of HS-SPME conditions need about 10 experimental parameters to be taken into consideration. However, there have been numerous papers written on the extraction of semivolatile and volatile molecules from food and beverages, as well as from waters using SPME. These reports allowed us to rationalize the study on selected parameters In preliminary studies, two types of different
po-showed the best results (data not shown) which is in agreement with previous studies [12,13,17]. More-over, two main types of SPME procedures were compared: the headspace (HS) and the direct im-mersion (DI) procedures. In model wine solutions, on the analyte: the HS-SPME procedure is more sensitive for EG whereas DI-SPME seems to be better for EP and IS (data not shown). However, red wine has a very complex matrix and also con-tains non-volatile compounds. For these reasons, we selected the HS-SPME procedure to increase the compared to DI-SPME, as reported in the literature [12,13,15,17].
3.1. Optimization of HS-SPME parameters
The effect of ionic strength on the headspace ethyl phenol quantitation was determined by saturating a sample with NaCl (1 g) under magnetic stirring. Re-sults obtained for EP and EG at 55 C with or without NaCl are shown in Fig. 2. Whatever the compound studied, saturation of the samples with NaCl increased peak areas about four times indicating an increase of well known that supersaturation of the sample with salt is more effective for the extraction of analytes onto decreases the solubility of analytes and thus increases rated with 1 g of NaCl have been used for subsequent experiments.
Fig. 2. Ionic strength effect on HS-SPME of volatile phenols (5 mg l 1 C (extraction time: 40 min). Each result represents the mean ( S.E.) of three independent experiments.
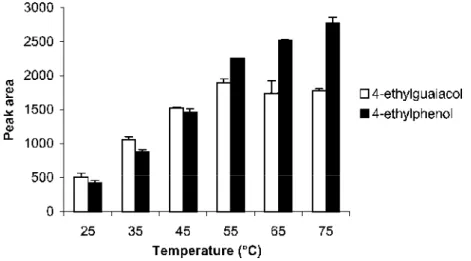
3.1.2. Effect of temperature
HS-SPME is controlled by the equilibria between the sample and the headspace and between the by temperature.
To optimize HS-SPME, the temperature of the so-lution was varied from 25 to 75 C using an absorp-tion time of 40 min. Results concerning EP and EG are shown in Fig. 3. Peak areas of IS exhibited the same variations as EP (data not shown).
Below 55 C, peak areas of volatile phenols creased with the sample temperature indicating an in-crease of the headspace concentration. The peak area of EG was a maximum at 55 C and then decreased while EP and IS peak areas continued to increase with increasing temperature. These different temperature
Fig. 3. Temperature effect on HS-SPME of volatile phenols (2 mg l 1) from a 2 ml model wine solution containing 1 g of NaCl by a
S.E.) of three independent experiments.
effects on volatile phenols could be explained in part by the boiling point of the compounds studied (99 C for EG, 213 C for EP and 227 C for IS). Indeed, the fact that an increase in temperature reduced the re-sponse of the most volatile compound EG indicates At the same time, the responses for the higher boil-ing compounds, EP and IS, increase correspondboil-ing to These observations are in agreement with previous studies with different volatile compounds [16,19,20] and demonstrate that for a complex matrix, selection of an optimum sampling temperature depends strongly on which analytes are of greatest interest or require the greatest sensitivity. Moreover, as reported by Cha-tonnet et al. [2], the EG:EP ratio in red wine is 1:10.
C. Each test compound is dissolved at 2 mg l 1
in a 2 ml model wine solution containing 1 g of NaCl. Each point represents the mean ( S.E.) of three independent experiments.
Considering these data and experimental results, a temperature of 55 C, giving the highest sensitivity for EG, was selected for subsequent experiments.
with stirring
C for the ethylphenol mixtures are shown in Fig. 4. The re-sponses of the compounds are affected by increasing the sampling time from 20 to 80 min corresponding ing [13,15,16]. The equilibrium period required for EG was the shortest (40 min). For EP and IS, the less volatile components of the mixture, increasing the sampling time from 40 to 80 min increased the re-sponse, indicating slower equilibration. However, for EP the increase in response between 40 and 60 min was less than between 20 and 40 min (18% versus 82% increase) indicating the beginning of the equilibration. that in saturated salt solutions, the time required for phenols to reach equilibrium was >60 min [12,13]. In-deed, this is probably due to the slow diffusion of the compounds through a saturated salt solution. Although an absorption time of 40 min is not enough to reach equilibrium for all compounds, it was chosen for the subsequent experiments since it gave the highest sen-sitivity for EG. Moreover, this time was approximately equivalent to that required for a gas chromatographic run.
extraction for the model wine solution
Validation of extraction methods coupled with GC analysis were performed for both EP and EG in the presence of IS with three independent cali-bration graphs. The calicali-bration graphs obtained by
g l 1 (10 data points, 3). These
calibration graphs present the following regression
co-2 0 998
and 0 00025 for EP; 2 0 989 and
0 00024 for EG (where y is the peak area, in arbi-trary units, and x is the concentration, in g l 1). The sensitivity represented by the slopes of the calibration graphs, was nearly the same for EP and EG. When the EP and EG concentrations were 50 g l 1, the R.S.D.
was 6% for EP and 5% for EG ( 3 independent
determinations). When the EP and EG concentrations were 5000 g l 1, the R.S.D. was 3% for EP and 2%
for EG ( 3 independent determinations).
were linear over a higher concentration range
g l 1, nine data points, 3) for EP
and EG. The graphs present the following
regres-2 0 999 and 0 00010 for EP; 2 0 997
and 0 00008 for EG. The sensitivity of the
method (calibration slope) for EP is a little higher than for EG. When the EP and EG concentrations
were 50 g l 1, the R.S.D. was 15% for EP and 12%
for EG ( 3). When the EP and EG
concentra-tions were 5000 g l 1, the R.S.D. was 2% for EP
and 5% for EG ( 3 independent determinations).
Whatever the compounds and methods used, the de-tection limits (signal to noise ratio 3) were in the low g l 1 range.
For EP and EG, the reproducibility of analysis at
50 and 5000 g l 1 were determined ( 3) with
different model wine solutions containing IS. At the lowest concentration, both compounds exhibited lower R.S.D. values within the SPME procedure than 2.5 times less) while the R.S.D. values were similar for the two methods at higher concentrations. It is important to note that all these optimization experiments were done with ethylphenol compounds by the two techniques was then checked in red wine.
extraction for red wine
extraction methods was compared for red wines quantitation. As shown in Figs. 5 and 6, the reten-tion times of EG and EP were 18.3 min for EG and 20.6 min for EP. These values are close to those ob-tained in model wine solutions (data not shown). For a given wine (Wine-1), the EP and EG peaks were
procedure to concentrate volatile phenols. Then, the tion presented fewer peaks than that obtained after HS-SPME.
The ability of both methods to quantify EP and EG was evaluated on two different wines, one rich in ethylphenols (Wine-1), and one poor in ethylphenols (Wine-2). The results are shown in Table 1. Whatever the wine tested and the method employed, the con-centrations determined for EP were similar ( 0 43
in Wine-1 and 0.2 in Wine-2, 3) indicating the
good selectivity of both methods for EP. However, the variability of EP concentration in Wine-2 was higher (3%). For EG concentrations, whereas there was no
(Wine-1). EP: 4-ethylphenol; EG: 4-ethylguaiacol; IS: internal standard.
difference between the two methods for Wine-1 (
0 68, 3) indicating the good selectivity of both
dure showed lower values than HS-SPME ( 0 05,
3) for Wine-2. This can be explained by the
HS-SPME of ethylphenol compounds from red wine (Wine-1). EP: 4-ethylphenol; EG: 4-ethylguaiacol; IS: internal standard.
Table 1
Determination of EP and EG concentrations ( g l 1) in two wines
a Extraction method Wine-1 Wine-2 EP EG EP EG HS-SPME 3536 ( 152) 280 ( 8) 109 ( 2) 56 ( 2) extraction 3350 ( 84) 247 ( 8) 90 ( 15) 36 ( 4)
aConcentrations of EP and EG are expressed as means ( S.E.)
of three independent experiments.
fact that the EG concentration in Wine-2 is close to its lower quantitation limit (25 g l 1) evaluated by note that this quantitation limit was determined in model wine solutions, a less complex matrix than red wine. Moreover, the variability of EG concentration (19%) than HS-SPME (6%).
The important variability of the results obtained by compounds, could be due to the uncontrolled temper-ature of extraction. In this procedure, the volatility of
In contrast, HS-SPME always allows the same tem-perature (55 C) to be used, thus limiting this problem.
4. Conclusions
The HS-SPME procedure is a solvent-free method presenting major advantages: simplicity, rapidity, high sensitivity and small sample volume. The HS-SPME method is appropriate for the quantitative analysis of ethylphenols in red wine even if the gas chro-matograms obtained by HS-SPME present more peaks
HS-SPME method can be combined with an autosam-pler. We are now examining the possibility of develop-ing a fast monitordevelop-ing method for the routine analysis
of volatile phenols in wine for quality management in winemaking.
Acknowledgements
We thank Dr. I. Seiller and the personnel of the Microbiology Department, ENFA (Toulouse, France), for technical assistance and for providing instrumen-tation for chromatography.
References
[1] P. Chatonnet, D. Dubourdieu, J.N. Boidron, M. Pons, J. Sci. Food Agric. 60 (1992) 165.
[2] P. Chatonnet, D. Dubourdieu, J.N. Boidron, Am. J. Enol. Vitic. 46 (1995) 463.
[3] V.L. Singleton, Am. J. Enol. Vitic. 46 (1995) 98.
[4] A. Rapp, G. Versini, Deutsche Lebensmit.-Rundschau 92 (1996) 42.
[5] P. Chatonnet, J.N. Boidron, Sci. Aliments 8 (1988) 479. [6] E.B. Olsen, in: Proceedings of the Wine Industry Workshop,
Geneva, NY, 1994, p. 96.
[7] J.P. Towey, A.L. Waterhouse, Am. J. Enol. Vitic. 47 (1996) 163.
34 (1990) 205.
[9] I. Blank, A. Sen, W. Grosch, Z. Lebensm, Unters. Forsch. 195 (1992) 239.
[10] J.W. Aiken, A.C. Noble, Vitis 23 (1984) 27.
[11] A.P. Pollnitz, K.H. Pardon, M.A. Sefton, J. Chromatogr. A 874 (2000) 101.
[12] K.D. Buchholz, J. Pawliszyn, Environ. Sci. Technol. 27 (1993) 2844.
[13] K.D. Buchholz, J. Pawliszyn, Anal. Chem. 66 (1994) 160. [14] J. Pawliszyn, J. Chromatogr. Sci. 38 (2000) 270.
[15] H. Kataoka, H.L. Lord, J. Pawliszyn, J. Chromatogr. A 880 (2000) 35.
[16] R.S. Whiton, B.W. Zoeckein, Am. J. Enol. Vitic. 51 (2000) 379.
[17] F.J. Santos, M.T. Galceran, D. Fraisse, J. Chromatogr. A 742 (1996) 181.
[18] R.E. Shirey, J. Chromatogr. Sci. 38 (2000) 279.
[19] Z. Zhang, M.J. Yang, J. Pawliszyn, Anal. Chem. 66 (1994) 844A.
[20] J.C. Florez Menendez, M.L. Fernandez Sanchez, J.E. Uria, E. Fernandez Martinez, A. Sanz-Medel, Anal. Chim. Acta 415 (2000) 9.