Beiträge zur Tabakforschung International
Contributions to Tobacco Research
Volume 28 @ No. 5 @ May 2019 DOI: 10.2478/cttr-2019-0004
Comparison of Mainstream Smoke Composition from
CR20 Resin Filter and Empty-Cavity Filter Cigarettes by
Headspace SPME Coupled with GC×GC TOFMS and
Chemometric Analysis *
by
Michał Brokl 1, Valle Morales 1, Louise Bishop 1, Christopher G. Wright 1, Chuan Liu 1, Jean-François Focant 2, James
Nicol 3, Kevin G. McAdam 4
1 Group Research and Development, British American Tobacco, Regents Park Road, Southampton SO15 8TL, UK 2 CART - Chemistry Department, Organic & Biological Analytical Chemistry, University of Liège, Liège, Belgium 3 JTN Consulting Limited, 272 Bath Street, Glasgow, Scotland, G2 4JR, UK
4 McAdam Scientific Ltd., 50 Leigh Rd, Eastleigh, SO50 9DT, UK
SUMMARY
A previously established method based on headspace solid-phase microextraction (HS-SPME) and comprehensive two-dimensional gas chromatography (GC×GC) coupled to time-of-flight mass spectrometry (TOFMS) has been used to evaluate and compare the profiles of semi-volatile com-pounds present in mainstream tobacco smoke particulate matter trapped on glass fibre filters for two types of cigarettes differing only in filter design. In the first ciga-rette, the filter cavity contained approximately 60 mg of a weakly basic macroporous polystyrene resin cross-linked with divinyl benzene and with surface amine functionality (CR20), whereas in the second cigarette, it was empty. Relative quantitative analysis, chemical identification, and chemical grouping allowed the use of both parametric and non-parametric analyses to identify differences in the che-mical composition of the smokes from these cigarettes. The analysis demonstrated that in addition to the selective partial removal of volatile carbonyls and HCN demon-strated previously, CR20 selectively, but incompletely removed 316 compounds from the particulate phase of cigarette smoke, mainly aryl and aromatic hydrocarbons as well as other more volatile species. In contrast, the relative proportion of amines, hydroxylated aromatic compounds and less volatile species was increased in the smoke from
the cigarette containing CR20 in the filter.
Our findings show that high resolution GC techniques combined with mass spectrometry and chemometric approaches are powerful tools for deconvoluting the complexity of combustion aerosols, as well as helping to identify changes in chemical composition resulting from modifications to cigarette designs. [Beitr. Tabakforsch. Int. 28 (2019) 231–249]
KEYWORDS
Solid-phase microextraction (SPME); Comprehensive two-dimensional gas chromatography (GC×GC); Mainstream tobacco smoke particulate phase (PP); Fisher ratio; Chemo-metric analysis
ZUSAMMENFASSUNG
Es wurde eine zuvor entwickelte Methode beruhend auf der Headspace-Festphasenmikroextraktion (HS-SPME) und der umfassenden zweidimensionalen Gaschromatographie (GC×GC) gekoppelt mit der Flugzeit-Massenspektrometrie (TOFMS) eingesetzt, um die Profile schwerflüchtiger Verbindungen in auf Glasfaserfiltern gesammelten
Par-tikeln des Hauptstromrauchs von zwei Arten Zigaretten, die sich nur im Filterdesign unterschieden, zu evaluieren und vergleichen. Bei der ersten Zigarette enthielt der Filterhohl-raum ca. 60 mg eines schwach basischen makroporösen Polystyrolharzes vernetzt mit Divinylbenzol und war aus-gestattet mit einer Aminfunktion der Oberfläche (CR20), bei der zweiten Zigarette war er hingegen leer.
Die relative quantitative Analyse, chemische Identifizier-ung und chemische GruppierIdentifizier-ung ermöglichten den Einsatz sowohl der parametrischen als auch der nicht-parametri-schen Analyse zur Feststellung der Unterschiede in der chemischen Zusammensetzung des Rauchs bei beiden Zigaretten. Die Analyse ergab, dass zusätzlich zur zuvor nachgewiesenen selektiven partiellen Entfernung von flüchtigen Carbonylen und Cyanwasserstoff (HCN), die Aminfunktion CR20 selektiv, aber unvollständig 316 Verbindungen aus der partikulären Phase des Zigaretten-rauchs entfernte, und zwar hauptsächlich aromatische und Aryl-Kohlenwasserstoffe sowie andere stärker flüchtige Spezies. Demgegenüber war der relative Anteil von Aminen, hydroxylierten aromatischen Verbindungen und weniger flüchtigen Spezies im Rauch der Zigarette mit CR20-Funktion im Filter erhöht.
Unsere Ergebnisse zeigen, dass hochauflösende Gaschro-matographietechniken in Kombination mit Massenspektro-metrie sowie chemometrischen Ansätzen leistungsfähige Instrumente zur Dekonvolution der Komplexität von Verbrennungsaerosolen sind und zudem dazu beitragen können, durch Modifikationen des Zigarettendesigns be-dingte Veränderungen der chemischen Zusammensetzung zu erkennen. [Beitr. Tabakforsch. Int. 28 (2019) 231–249]
RESUME
Une méthode précédemment mise au point et fondée sur une micro-extraction sur phase solide dans l’espace de tête (HS-SPME) et sur une chromatographie en phase gazeuse bidimensionnelle (GC×GC) couplée à une spectrométrie de masse à temps de vol (TOFMS) fut utilisée dans le but d’évaluer et de mettre en regard les profils des composés semi-volatiles présents dans les particules de fumée principale de tabac piégées par les filtres en fibre de verre de deux types de cigarettes se différenciant uniquement par la conception distincte de leur filtre. Dans le cas de la première cigarette, la cavité du filtre contenait environ 60 mg d’une résine de polystyrène macroporeuse de faible basicité, croisée au divinylbenzène et présentant une fonction amine de surface (CR20); tandis que la cavité du filtre de la seconde cigarette était vide.
Une analyse quantitative relative, une identification chimique ainsi qu’un regroupement chimique permirent le recours à des analyses à la fois paramétriques et non-paramétriques afin d’identifier les différences de composi-tion chimique des fumées de ces cigarettes. L’analyse apporta la preuve qu’en plus du retrait partiel sélectif des carbonyles volatiles et de l’acide cyanhydrique attesté précédemment, la fonction CR20 permettait, de façon sélective mais incomplète, l’élimination de 316 composés de la phase particulaire de la fumée de cigarette, à savoir principalement les hydrocarbures aryles et aromatiques ainsi que d’autres substances plus volatiles. En revanche, la
proportion relative des amines, des composés aromatiques hydroxylés et des substances moins volatiles était en augmentation dans la fumée de la cigarette contenant la CR20 dans son filtre.
Nos observations démontrent que des techniques de chromatographie en phase gazeuse à haute résolution combinées à la spectrométrie de masse et à la chimiométrie constituent des outils performants de déconvolution de la complexité des aérosols issus de la combustion et contri-buent également à l’identification des modifications de la composition chimique résultant des changements apportés à la conception des cigarettes. [Beitr. Tabakforsch. Int. 28 (2019) 231–249]
INTRODUCTION
Tobacco smoke is an aerosol containing an extremely complex mixture of chemicals. It comprises liquid and/or solid droplets, termed the particulate phase (PP), suspended in a mixture of gases and volatiles, termed the gas and vapour phases (VP). Many semi-volatile compounds partition dynamically between both phases. Most recent estimates indicate that there are more than 6,000 identified compounds in tobacco smoke, and most of these are contained in the particulate phase (1). The chemical mixture comprising cigarette smoke has been classified as a human carcinogen (2, 3), and many of the individual semi-volatile organic compounds (SVOCs) present in whole smoke, such as benzene, ethylbenzene, and styrene, are also known or potential human carcinogens. In a toxicological risk assessment, the gas and vapour phase constituents of tobacco smoke were found to dominate the cancer risk index (4).
As a result, many attempts have been made to selectively reduce toxicants in cigarette smoke (5). Because smoking-related diseases are dose-dependent, the “Committee to Assess the Science Base for Tobacco Harm Reduction” of the Institute of Medicine concluded that “... for many
diseases attributable to tobacco use, reducing risk of disease by reducing exposure to tobacco toxicants is feasible” (6).
Various filter components have been tested for their ability to selectively remove toxicants from tobacco smoke. An increasing number of cigarettes contain porous adsorbents, such as activated carbon (AC), which can remove a broad range of VOCs from smoke via adsorption or physisorption (7–9). Chemisorption, in which filter materials possess active surface chemical reactivity, is also a viable mecha-nism for the selective filtration of volatile components (10–13). BRANTON et al. recently showed that
chemi-sorption is effective for the removal of certain vapour phase toxicants from cigarette smoke. They tested a macroporous, polystyrene based ion-exchange resin (Diaion®CR20,
Mitsubishi Chemical Corporation, Tokyo, Japan; hereafter CR20) with surface amine group functionality as a filter component that might react with volatile compounds such as aldehydes and HCN in mainstream cigarette smoke (13). Characterisation of CR20 revealed a small surface area but extensive surface chemistry, in contrast to coconut-derived AC, which has extensive porosity (8). The surface func-tional groups of the resin beads were characterized by
TOFMS, which showed the presence of distinctive aro-matic signals, surface nitrogen (as CN! ions),
organo-nitrogen groups (e.g., [OCN]! fragment, indicative of
amide/amide-like functionalities; and CxHyN+ signals,
indicative of amine/amine-like groups and ammonium-type species). Thus, CR20 has structural characteristics indicat-ing weak physisorption properties, but sufficient surface functionalities to selectively remove aldehydes and HCN from cigarette smoke. The reductions of aldehydes and HCN were greater than those achieved using AC. 2-Butanone was removed with increasing efficiency by increasing amounts of CR20 in the filter, suggesting a low level of chemisorption by CR20 for this ketone, although the removal of another ketone, acetone, was poor (13). The vapour phase analysis of CR20 filters presented by
BRANTON et al. provided a relatively narrow examination
of changes in smoke chemistry between CR20 and cellu-lose acetate filtered cigarettes (13). As the chemical composition of smoke from the CR20-filtered cigarette is different to a standard cellulose acetate filtered cigarette, it was decided to investigate more fully the associated chemical differences in smoke chemistry. To monitor wider changes in cigarette smoke composition, a comprehensive analytical approach is needed; however, the complexity, number and concentration range of compounds in particu-late phase samples means that an exhaustive analysis is very difficult. As a result, many studies have focused on individual classes of compounds present in tobacco smoke via one-dimensional gas chromatography (1DGC) coupled with time-of-flight mass spectrometry (TOFMS), including several studies on VOCs (14–17).
In the past 20 years, comprehensive two-dimensional GC (GC×GC), in which consecutive separations are performed on two orthogonal column phases (e.g., 18), has been applied to the analysis of more complex solutions, includ-ing food extracts (19) and various fractions of tobacco smoke (20–23). The increased separation capacity of GC×GC-TOFMS, due to consecutive separations, higher-dimensional structure-retention relationships, peak com-pression and improved signal-to-noise ratio (S/N), provide much greater peak capacity and chromatographic selectiv-ity than one-dimensional GC. GC×GC can avoid the need for time-consuming sample preparation procedures via analyte and/or matrix pre-separation (19); however, pro-cessing the relatively large volumes of data obtained using non-targeted comprehensive screening can be very time-consuming.
Most recently, GC×GC-TOFMS has been used for the analysis of the mainstream tobacco smoke particulate phase using liquid extraction and dynamic headspace (DHS) sampling (24, 25). In this study, automated peak finding and mass spectral deconvolution combined with scripting and manual revision of library hits were used to evaluate library search results. In a comparison between solvent extraction and DHS sampling of the smoke particulate phase, the revised peak table contained nearly 1800 and over 900 individual compounds, respectively (24). The two extraction methods were shown to be complementary, leading to only 11% of repeated analytes, and their combi-nation gave rise to a list of almost 2500 individual smoke constituents. In addition, the number of compounds de-tected in each chemical class was significantly higher in the
DHS sampling than in the methanol extraction. Thus, DHS sampling might provide a more comprehensive analytic approach for semi-volatile compounds.
Solid-phase microextraction (SPME) - a rapid solvent-free and sensitive method of extraction based on the sorption of analytes present in a sample or its headspace by a thin film of an extracting phase immobilized over the surface of a fused-silica fibre (26) - has also been used to assess various classes of compounds in cigarette smoke (16, 17, 27–35). In a recent study, headspace SPME GC×GC-TOFMS was optimized via a multivariate response surface strategy for the evaluation of multiple VOCs in mainstream tobacco smoke particulate matter (25). The optimized protocol was used in the analysis of two types of cigarette: one with active charcoal (AC) in the filter, and one with standard cellulose acetate (CA) in the filter. Principal component analysis (PCA) allowed clear differentiation of the two cigarette types, while Fisher ratio analysis (36) allowed identification of compounds responsible for the chemical differences between the cigarette samples. Of 143 com-pounds, 134 analytes were reduced by the active carbon filter, while for 9, the classical cellulose acetate filter was more efficient.
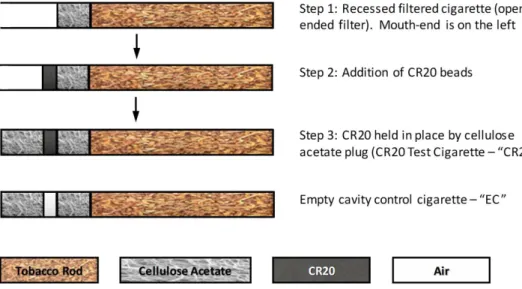
Building on our previous study in which a filter containing CR20 resin was shown to efficiently remove aldehydes and HCN (13), here we have applied the optimised headspace SPME-GC×GC-TOFMS approach (25) to evaluate whether this CR20 resin can substantially reduce multiple semi-volatile compounds in the cigarette smoke particulate phase. Mainstream smoke from a cigarette incorporating a three-segment filter comprising 10 mm of CA at the tobacco rod end, a 4-mm cavity section filled with approxi-mately 60 mg of CR20, and a 13-mm CA section at the mouth end, was compared against smoke from a second cigarette with identical tobacco blend, paper, and dimen-sions but an empty filter cavity (Figure 1).
MATERIALS AND METHODS
CR20
The filter material used in this study, CR20, is a polysty-rene based material cross-linked with divinyl benzene, with surface (primary) amine group functionality, and whose filtration characteristics have been characterised exten-sively (13). The material was prepared using a modified synthesis process, designed to provide a lower odour material (CR20L), and was used in this study in the form of 600-µm diameter beads, 15% moisture content and 0.92 meq/cm3 total exchange capacity. It possesses a
pre-dominantly macroporous structure with some large meso-pores, a BET surface area of 44 m2 g!1 and a pore volume
(at a relative pressure, P/P0, of 0.95) of 0.08 cm3 g!1; it
possesses a broad pore size distribution of 25–900 nm centred at 105 nm with a volume of 1.0 cm3 g!1 and a bulk
density of 0.50 g cm!3. These properties were consistent
with very weak physisorption properties. The resin particle surfaces showed the presence of distinctive aromatic signals, surface nitrogen (as CN! ions), organo-nitrogen
groups, (e.g. [OCN]! fragment, indicative of
Figure 1. Construction of CR20 and EC cigarettes.
amine/amine-like groups and ammonium-type species. It had a maximum basicity of 1.02 mmol g!1 and was more
hydrophobic than activated charcoal. These properties were sufficient to display significant chemisorption towards vapour phase aldehydes and HCN (13).
Cigarettes
Two types of cigarettes differing only in filter design were examined in this study (Figure 1). A 27-mm length, three-segment filter comprising a 10-mm cellulose acetate section at the tobacco rod end, a 4-mm cavity section, and a 13-mm cellulose acetate section at the mouth end was used. In cigarettes coded CR20, the cavity was filled with 60 ± 1 mg of CR20 resin (a weakly basic macroporous polystyrene resin cross-linked by divinyl benzene, with surface amine functionality), while in cigarettes coded EC the 4-mm cavity was left empty. In both cases the cellulose acetate base-material was plasticised with 7% triacetin. Cigarettes CR20 and EC had a circumference of 24.6 mm and were made up of a 56-mm long tobacco rod containing a Vir-ginia style tobacco blend (tobacco rod density of 255 mg cm!3 at a moisture content of 13%). The research
cigarettes were provided by British American Tobacco (Southampton, UK).
Smoking conditions
Smoke samples were produced using a Borgwaldt RM20 rotary smoking machine (Borgwaldt KC, Inc., Richmond, VA, USA). Smoking was conducted according to the relevant ISO standards applying a 35-mL puff of 2 s duration taken every 60 s with no blocking of filter ventila-tion holes (37). Cigarettes were lit using an electric lighter (Borgwaldt KC Inc., Richmond, VA, USA).
Samples
Cigarettes and Cambridge filter pads were conditioned for at least 48 h at 60% relative air humidity and 22 °C prior to analysis (38). After conditioning, for each analysis, five
conditioned cigarettes were smoked and the particulate phase of mainstream smoke (PP) was collected on a Cambridge filter pad (CFP). Smoking was conducted four times for each cigarette, each run producing a separate CFP sample (“Procedural Replicates”). After smoking, the filter pad was cut into quarters and each quarter was placed in a separate 20-mL headspace vial which was sealed and analysed immediately after. Analysis of each both cigarette types therefore each yielded four sample replicates, i.e., Cambridge filter pads containing particulate phase material. The four quarter filters from each CFP constituted technical replicates.
GC analysis
Each sample was analysed by SPME GC×GC TOFMS generating 32 chromatograms in total; 16 each for the CR20 and EC prototype cigarettes, each comprising four replicates, each replicate having four repeats. The instru-ment used was a LECO Pegasus4D (Saint Joseph, MI, USA) equipped with a dual jet modulator and a secondary column oven.
HS-SPME procedures
Headspace SPME extraction conditions were optimized in our previous study (25). The polyacrylate fibre (PA) fibre was conditioned prior to use according to manufacturer’s instruc-tions in a Gerstel (Kortrijk, Belgium) fibre bake out station. An 85-µm Polyacrylate SPME fibre (Sigma Aldrich, Overijse, Belgium) was exposed to the sample headspace for 10 min at 40 °C after a 10-min sample incubation period at 50 °C. The fibre was desorbed in a CIS4 Cooled Injection System (Gerstel, Kortrijk, Belgium) using the following temperature program: isothermal period at !20 °C for 0.5 min, a ramp of 12 °C s!1 to 250 °C and held at 250 °C for
2 min. After desorption the fibre was reconditioned for 40 min at 275 °C to eliminate possible carry-over. 20-mL headspace vials, polytetrafluoroethylene-faced (PTFE) septa magnetic crimp caps, and an automated SPME holder were obtained from Gerstel (Kortrijk, Belgium).
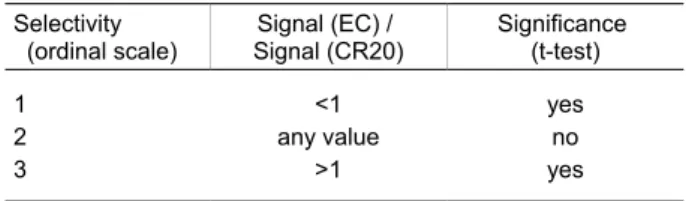
Table 1. Criteria for assignment of ordinal classifications for each analyte. Selectivity (ordinal scale) Signal (EC) / Signal (CR20) Significance (t-test) 1 <1 yes 2 any value no 3 >1 yes
GC×GC setup and analytical conditions
The first dimension (1D) column was a low-polarity 5%
phe-nyl polysilphephe-nylene-siloxane phase (BPX5; 30 m × 0.25 mm i.d. × 0.25 µm film thickness; SGE International, Victoria, Australia) connected by means of a SilTite™ µ-Union (SGE International, Victoria, Australia) to a second dimen-sion (2D) midpolarity Crossbonded® silarylene phase
col-umn exhibiting similar selectivity to 50% phenyl/50% dimethyl polysiloxane (Rxi®-17Sil MS; 1.0 m × 0.15 mm
i.d. × 0.15 µm film thickness; Restek Corp., Bellefonte, PA, USA). The 2D column was installed in a separate oven
located inside the main GC oven, providing more flexible temperature control. The system was equipped with a Gerstel MultiPurpose Sampler (MPS 2XL), SPME option for procedural automation, and the CIS4 Cooled Injection System. The carrier gas was helium at a corrected constant flow rate of 1 mL min!1 and the injector was set to split
mode with split ratio of 1:15.
The main oven temperature program comprised an isother-mal period at 50 °C for 3 min, a ramp of 4 °C min!1 to
220 °C followed by a ramp of 20 °C min!1 to 300 °C and a
final isothermal period at 300 °C for 2.5 min. The second-ary oven was programmed with a 15 °C offset above the primary oven. The modulation parameters consisted of 2 s modulation period (400 ms hot pulse and 600 ms cold pulse time) and a temperature offset of 20 °C above the second-ary oven. Mass spectra were acquired in the range m/z 45–400 at the acquisition rate of 100 spectra sec!1. The ion
source temperature was set at 230 °C and the transfer line temperature was set at 250 °C. The detector voltage was 1500 V and the ionization electron energy (EI source) was set at 70 eV. Data were acquired using LECO Chro-maTOF® software version 4.50.
Data processing
Data processing for multivariate comparison of CR20 and EC cigarettes was performed using the pixel-based software package GC ImageTM version 2.4a3 (Zoex Corporation,
Houston, TX, USA). Image Investigator, part of the GC ImageTM software package, was used to analyze multiple
chromatograms and examine statistical characteristics and trends.
Chromatograms from the 4 technical replicates of each of the 4 procedural replicates of the CR20 cigarette and the 4 technical replicates of each of the 4 procedural replicates of the EC cigarette (a total of 32 chromatograms) were submitted to Image Investigator. The chromatograms were pre-processed by means of background correction, blob detection, and phase shift, and then a cumulative chromato-gram was created by aligning and combining all chroma-tograms into a single image. This image reflected all of the constituents that were present in all samples. Each peak present in this image was delineated, forming regions that were recorded and used to create a template. For each of the peaks, the template matrix recorded retention times in both dimensions (1t
R and 2tR) and a rule expressed in
Computer Language for Identifying Chemicals (CLIC) (39) that specifies both the reference mass spectrum in the template and the required mass spectral match factor that
must be reached when in use. After manual cleaning for column bleed signals, artefacts associated with peak tailing and other system artefacts, a set of 836 regions was created in the template.
Each of the individual HS-SPME GC×GC-TOFMS chromatograms generated by the replicated analyses of both CR20 and EC cigarettes were mapped back to this template and each region defined a feature for each chromatogram. Library searching was carried out using NIST/EPA/NIH Mass Spectral Library (NIST 11) and Wiley Registry of Mass Spectral Data (9th Edition). Linear retention indices
(LRIs) for the first chromatographic dimension were calculated using alkanes present in a sample. Aroma Office
2D (Gerstel, Tokyo, Japan) and its Linear Retention Indices
(LRI) database of over 100,000 entries was used for the manual verification of compound identities when possible.
Dataset preparation
Processing and classification - the chromatography
sponses were normalised to give overall percentage re-sponse within each chromatogram, and thus to allow comparison between experiments. Normalisation adjusts for between-sample differences in total particulate matter and is a standard procedure in analytical methods in which overall sample dilution is not completely controlled. Test for significance - the values for the 4 repeats within each replicate were averaged, and the averages were then compared using a two-sample t-test, with Welch’s correc-tion for unequal variances, and an alpha risk of 0.05.
Ordinal classification - For each analyte the ratio of the
mean % response between the two series was calculated, to give a ratio of normalized signal intensity. Finally, ordinal classifications were assigned for each analyte based on these statistics (Table 1). The ordinal scale was coded so that increasing number corresponds to increasing analyte concentration in the particulate phase from the EC product in comparison to the level in the CR20.
Interrogation of chemical structures - GC-MS provides
chemical assignments via spectral library matching. Both automated look-up and manual intervention approaches were used to identify peaks. Peaks in which identification remained ambiguous after this stage were removed from the data (row-wise deletion). Once chemical identities were established it was possible to use cheminformatics to inter-rogate the chemical features. This allowed classification according to chemical functional groups, in order to
sim-plify further analyses, and to gather data for compound physical parameters (e.g., vapour pressure) using calculated or archived values.
Chemical group classification
Cheminformatics techniques for unsupervised classifica-tion of chemicals are useful to support the assignment of compounds to discrete groups. Discrete groups are desir-able for statistical analysis, because each compound can be given a single classifier that summarises its chemical functionality. This opens a path to using simple regression tools with easily interpretable results.
A common classification approach uses structural keys to produce fingerprints based on chemical maps of each molecule. These fingerprints are long check-lists of differentiating features, with a binary code to indicate if they are present in a molecule. They can be subjected to hierarchical clustering algorithms to split chemical sets into subgroups of similar molecules. A non-trivial step in dealing with tabulated chemical identifiers is to assign structures to the compound names provided. Peak identi-ties were cross-checked with several identifiers, using web-based services, mostly mediated by the Webchem package in the R statistical programming environment. Data were collated into a single spreadsheet containing identities, SMILES representations (containing isomeric information where relevant), CAS numbers and the systematic IUPAC indexing term (InchiKey). The SMILES strings were used to obtain molecular weights, exact masses and water/octanol partition function esti-mates (xlogP) using the RCDK package in R.
Preliminary classification into chemical groups was performed using hierarchical clustering with the RCDK Package. This assigned each chemical with an 881 bit Pubchem structural fingerprint, suitable for building a distance matrix by the Tanimoto method (also called the Jaccard index).
Dissimilarity was assessed using the Ward method. A 15-group classification was chosen, based on visual inspection of the dendrogram. In most cases this was remarkably effective at drawing together chemically similar molecules, but there were a number of mis-matches. The assignments were manually adjusted to give a comprehen-sive 13-group system, which was further collapsed to give an intermediate-resolution 10-group classification, and further condensed to give a 7-group (coarse) classification system.
When adjusting classes, precedence was given to polar and reactive groups: for example, a carbonyl with an alcohol would be classified as carbonyl. The ranking for this was defined as: [unusual misc. groups/acid/amine] > carbonyl > [ester/amide] > alcohol > ether > hydrocarbon. In this manner, chemicals were classed together, according to reactive functional groups, and several polar, minority species were grouped together for simplicity.
Statistical data interrogation methods to identify systematic differences between filter types
Both parametric and non-parametric methods were used to examine the influence of chemical class, physical parameters, and filter selectivity on differences between the particulate phase compositions of smoke from the two cigarettes.
Non-parametric tests - analysis of chemical functionality
The Kruskal-Wallis test offered a robust method to examine differences in the ratio of analyte response across the chemical subgroups. This test compared median scores of subgroups (chemical grouping using the 10-group classifi-cation system); with z-scores to test the significance of the difference in median scores. Mood median test was also used to assess the equality of medians from the smoke constituent populations. The mean for each chemical group was assigned a confidence interval. Any interval that did not contain the overall grand median was regarded as significantly different from the other populations.
• Parametric data modelling - analysis of physical and chemical molecular properties
We explored statistical techniques that included terms for physical parameters, such as volatility. The first dimension retention time (1t
R) was used to represent decreasing
volatility and the second dimension retention time (2t
R) to
represent compound polarity. We also used the estimated water/octanol partition coefficient (xlogP) for each struc-ture, as a proxy for lipophilicity. These continuous vari-ables were used as covariates in the following models.
Linear discriminant analysis (LDA) - a generalization of
Fisher’s linear discriminant was used to identify linear combinations of features to distinguish between the smoke chemistry profiles from the two cigarettes.
Ordinal Logistic Regression - A more comprehensive
model was obtained using the logit link function of ordinal logistic regression. Filtration selectivity was assigned as the response variable, with division into a 3 point ordinal scale as described previously. In this scale, a high number indicates a compound being depleted in the particulate phase of the CR20 product. The first dimension retention time was included as a covariate to represent (decreasing) volatility. The second dimension retention time represented (increasing) polarity. The chemical clusters (10-group classification) were each used as dichotomous variables. Model simplification was by stepwise removal of terms, assessed by inspection of P values and confidence intervals at each stage. Levels of agreement between observed and predicted classifications were described by Somers’ D sta-tistic and Kendall’s tau-a parameter. The analysis was per-formed in Minitab.
Linear Regression - A general linear model was fitted for
the ratio of the analyte intensities between product types, against retention times as continuous independent variables, with the inclusion of the 10-group chemical classification assignments as dichotomous factors. Two-way interactions were included, model simplification was by backwards removal of the least significant terms.
RESULTS
Smoke composition from CR20 and EC cigarettes
The GC oven profile has been described above. The region of interest has a constant temperature gradient. Samples eluted from column 1 between 3.6–39.2 min in this
dimen-Figure 2. Comparison of the chromatograms from CR20 and EC cigarettes. A is a chromatogram of CR20 smoke, B is a chromatogram
of EC smoke and C is a statistical comparison between the two: shaded blobs are compounds less abundant (reduced) in CR20 smoke.
sion. The GC×GC chromatograms from the CR20 cigarette and the EC cigarette are presented in Figure 2, and show the chemical complexity of the analysed smoke constituents in both cases. Retention times for column 1 were found to be reasonably normally distributed. The oven temperature can be considered isothermal for column 2 due to the mo-dulation period of 2 s. Consistent with this the retention times for column 2 were under 1.8 s, but the peak retention time distribution for column 2 was less regular and was positively skewed (Appendix Figures A1a and b). Interrogation of the chemical species in the database showed that the chemical names provided by the GC/MS libraries were generally clear, and could be interpreted. However, chemical nomenclature has inconsistencies between regions and disciplines, and it was a lengthy process to verify many names. Automated look-up services via API requests to databases provided reliable, cross-checked assignments for the majority, but approximately 25% required detailed work to verify assignments, and a number where the chemical assignment was undefined,
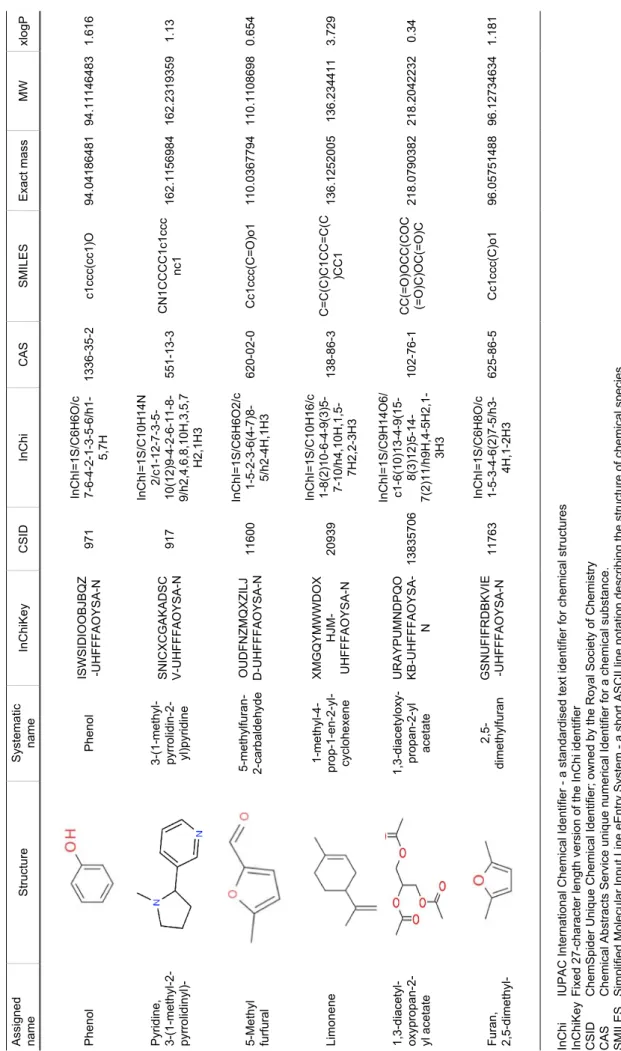
ambiguous or implausible were removed from the data (18 rows). The deleted compounds comprised a small frac-tion of the overall data set. The resulting peak spreadsheet has 128 columns and 818 rows, and includes chemical drawings of all species. Full details are provided in Supple-mentary Information File (online), and an example of the database is provided in Table 2 (see next page).
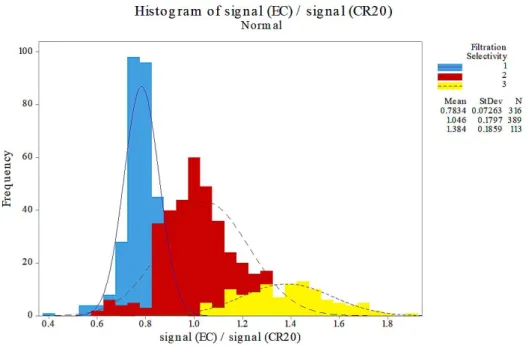
The analytes signal intensities were approximately log-normally distributed, with similar profiles between products (Appendix, Figure A2). Empirical CDF plots also resem-bled lognormal profiles (Appendix, Figure A3). A marginal plot of the signal-to-noise ratio (SNR) for the two products showed that the primary analytical signals were generally equivalent across all peaks, prior to normalisation. The normalised signal intensities for many chemicals were different between cigarette smoke samples, depending on which filter type was used. These differences are repre-sented by plotting the ratio of the signal intensity between the two products, as a histogram in Figure 3. This showed three populations with approximately normal distributions
Table 2. Example of smoke component database, showing compound
identities and structure assignment.
Assigned name Structure Systematic name InChiKey CSID InChi C AS SMILES Exact mass M W xlogP Phenol Phenol ISWSIDIOOBJBQZ -UHFFFAOYSA-N 971 InChI=1S/C6H6O/c 7-6-4-2-1-3-5-6/h1-5,7H 1336-35-2 c1ccc(cc1)O 94.04186481 94.11146483 1.616
Pyridine, 3-(1-methyl-2- pyr
ro lidinyl) -3-(1-methy l-pyr ro lidin- 2-yl) pyr idine SNICXCG AKADSC V-UHFFFAOYSA-N 917 InChI=1S/C10H14N 2/c1-12-7-3-5-10(12)9-4-2-6-11-8- 9/h2,4,6,8,10H,3,5,7 H2,1H3 551-13-3 CN1CCCC1c1ccc nc1 162.1156984 162.2319359 1.13 5-Methyl furfural 5-methylfuran- 2-carbaldehyde OUDFNZMQXZILJ D-UHFFFAOYSA-N 11600 InChI=1S/C6H6O2/c 1-5-2-3-6(4-7)8-5/h2-4H,1H3 620-02-0 C c1ccc(C=O )o1 110.0367794 110.1108698 0.654 Limonene 1-methyl-4-prop-1-en-2-yl- cyclohexene X M GQY MW W D OX HJM-UHFFFAOYSA-N 20939 InChI=1S/C10H16/c 1-8(2)10-6-4-9(3)5- 7-10/h4,10H,1,5-7H2,2-3H3 138-86-3 C=C(C)C1CC=C(C )CC1 136.1252005 136.234411 3.729
1,3-diacetyl- oxypropan-2- yl acetate 1,3-diacetyloxy- propan-2-yl acetate URAYPUMNDPQ O KB-UHFFFAOYSA-N 13835706 InChI=1S/C9H14O6/ c1-6(10)13-4-9(15- 8(3)12)5-14- 7(2)11/h9H,4-5H2,1-3H3 102-76-1 CC(=O)OCC(COC (= O)C)OC(= O)C 218.0790382 218.2042232 0.34 Furan, dimethyl- 2,5-dimethylfuran G S NUFIFRDBKVIE -UHFFFAOYSA-N 11763 InChI=1S/C6H8O/c 1-5-3-4-6(2)7-5/h3-4H,1-2H3 625-86-5 C c1ccc(C)o1 96.05751488 96.12734634 1.181 InChi
IUPAC International Chemical Identifier - a standardised t
ext identifier for chemical structures
InChiKey
Fixed 27-character lengt
h version of the InChi identifi
er
CSID
ChemSpider Unique Chemical Identifier; owned by the Royal S
ociety of Chemistry
CAS
C
hemical Abstracts Service
unique numerical Identifier for a
chemical substance.
SMILES
Simplified Molecular
Inpu
t Line eEntry System - a short A
SCII line notation describing the
structure of chemical species
MW
Molecular
Weight
xlogP
Water/octanol parti
(Appendix, Figure A4). As the basis for an ordinal classifi-cation used in ordinal logistic regression analysis, com-pounds were classified into these three filtration selectivity groups, based on whether the analyte was higher, lower or unchanged between the two different sample types. 316 compounds were identified as being present at higher levels in the EC cigarette smoke particulate than in CR20. 389 compounds showed no significant difference, and 113 compounds were higher from the CR20 cigarette than from EC. These results confirm that the CR20 filter additive selectively, but partially, removes some com-pounds present in the particulate phase of mainstream cigarette smoke.
Chemical classification
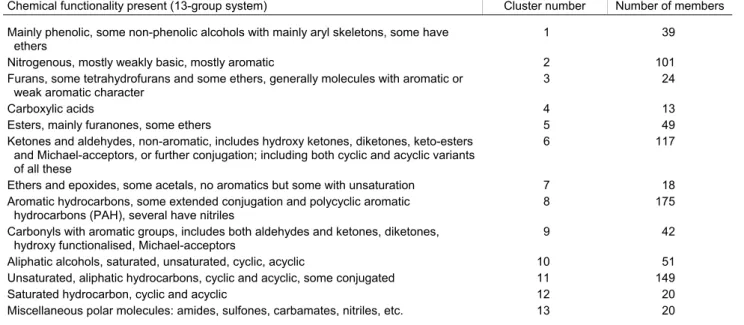
One aim of the study was to identify physicochemical para-meters defining compounds that CR20 removes from par-ticulate phase mainstream smoke in addition to the volatile compounds identified in previous analysis (13). An impor-tant parameter in this exercise is chemical functionality. Compounds identified in the smoke chemistry database were therefore grouped into a number of chemical function-ality clusters. A 13-cluster system (Table 3) was able to represent the range of chemical complexity, without
oversimplification, but had too many factors to use for some methods in Minitab. A 10-group system (Table 4) was devised that, although slightly more simplistic in that it lost a few distinctions between closely related classes, was more suited to the restrictions in the software. A 7-group system (Appendix, Table A1) was explored but was found to be slightly over-simplistic, leading to margin-ally poorer models.
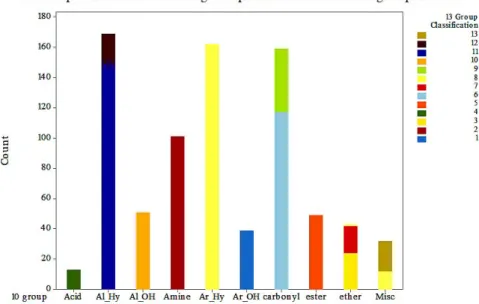
The distribution of the 13 groups within the 10-group classification are presented graphically in Figure 4 using a stacked bar chart. Hydrocarbons were combined, as were carbonyls and ethers. Aromatics with nitriles were shifted to “miscellaneous”. The 7-group classification withdrew any remaining distinction between aliphatic/aromatic character, and shifted acids to the miscellaneous group.
Identification of chemical differences between CR20 and EC smoke particulates - non-parametric analysis
In the Kruskal-Wallis Test (Appendix, Table A2) aliphatic hydrocarbons were identified as having a significant association with a low median value in the CR20 particu-late. Amines and aromatic alcohols were associated with the opposite tendency; a higher level in the particulate from the CR20 product.
Table 3. 13-Group system.
Chemical functionality present (13-group system) Cluster number Number of members
Mainly phenolic, some non-phenolic alcohols with mainly aryl skeletons, some have ethers
1 39
Nitrogenous, mostly weakly basic, mostly aromatic 2 101
Furans, some tetrahydrofurans and some ethers, generally molecules with aromatic or
weak aromatic character 3 24
Carboxylic acids 4 13
Esters, mainly furanones, some ethers 5 49
Ketones and aldehydes, non-aromatic, includes hydroxy ketones, diketones, keto-esters and Michael-acceptors, or further conjugation; including both cyclic and acyclic variants of all these
6 117
Ethers and epoxides, some acetals, no aromatics but some with unsaturation 7 18
Aromatic hydrocarbons, some extended conjugation and polycyclic aromatic hydrocarbons (PAH), several have nitriles
8 175
Carbonyls with aromatic groups, includes both aldehydes and ketones, diketones,
hydroxy functionalised, Michael-acceptors 9 42
Aliphatic alcohols, saturated, unsaturated, cyclic, acyclic 10 51
Unsaturated, aliphatic hydrocarbons, cyclic and acyclic, some conjugated 11 149
Saturated hydrocarbon, cyclic and acyclic 12 20
Miscellaneous polar molecules: amides, sulfones, carbamates, nitriles, etc. 13 20
Table 4. 10-Group system.
Chemical functionality present (10-group system) Simple name Number of members
Alcohols with aromatic groups in molecule, includes phenols Ar_OH 39
Nitrogenous, basic, aliphatic and aromatic Amine 101
Ether, aliphatic and aromatic Ether 43
Carboxylic acids Acid 13
Ester, lactone, furanone, pyranone Ester 49
Carbonyls Carbonyl 159
Aromatic hydrocarbons Ar_Hy 162
Aliphatic alcohols Al_OH 51
Aliphatic hydrocarbons Al_Hy 169
Use of Mood’s median test with the 10-group classification identified acids and aliphatic/aromatic hydrocarbons as having intervals lower than the overall grand median (0.931), and therefore having significantly lower levels in the CR20 aerosol particulate. In contrast, amines and aromatic alcohols were lower in the particulate phase of the EC cigarette (Appendix, Table A3).
These robust tests are useful to gain initial insight into the data, because they rely on few assumptions. However, neither of these tests includes covariates or interaction terms. As discussed above, it is very likely that physical factors such as volatility and polarity/lipophilicity play a role in aerosol filtration.
More sophisticated parametric models were developed, in which chromatographic retention times were used as proxy values to represent volatility (1t
R) and polarity (2tR). We also
examined the estimated water/octanol partition coefficient
(xlogP) for each structure, as a proxy for lipophilicity. These continuous variables were used as covariates in the parametric models described below.
Physicochemical differences between CR20 and EC smoke particulates - parametric models
The ordinal logistic regression model provided an accept-able fit to the data, according to the goodness-of-fit tests. Both tests gave P values above 0.05, supporting the null hypothesis that the data fit the model. The level of concor-dance between observed and predicted classifications was 87.1%, leading to a Somers’ D statistic of 0.74. Kendall’s tau-a shows a positive correlation of 0.45.
The influence of the parameters in the model is given by their proportional odds ratios. For a one-unit increase in dichotomous predictor, i.e., going from 0 to 1, the odds of
Figure 4. Simplified group classifications based on 10 groups and 7 groups in comparison to the full 13-group classification.
moving up the scale of the response are increased by the value of the coefficient for that predictor, if all other vari-ables in the model remain unchanged.
The same applies to the continuous predictors (the covariates); a one-unit increase in covariate brings the indicated change in odds. The covariates were not stand-ardised, so their scales need to be considered: 1t
R has a
max value of around 40 min and 2t
R has a max value
around 1.8 s.
The covariates both had negative coefficients (Appendix, Table A4), indicating that increased retention time was associated with an elevation of levels of chemicals in the CR20 particulate phase compared to the EC cigarette. The categorical amine and aromatic alcohol descriptors both had negative coefficients, with the same interpretation. The coefficients for aliphatic and aromatic hydrocarbons both had positive coefficients, indicating that the presence of these factors was linked to a reduction of the chemicals in the CR20 particulate phase compared to the EC ciga-rette. These trends for chemical classes agree with findings from the non-parametric tests described above. However, inclusion of covariate terms for volatility and polarity means the findings are less susceptible to
con-founding interactions between chemical class and physi-cal parameters.
A linear regression model (Appendix, Table A5) ex-plained less than half of the variation in the response variable, but the residuals showed curvature in the residuals-versus-fit plot (Appendix, Figure A5) which is in breach of the approximations necessary for a general linear model. This was improved slightly by using a Box-Cox transformation, but still raised doubts over the validity of the model coefficients. However, the lack-of-fit term was not significant in the model, and the direc-tional sign of the coefficients had some credence when compared to other models of the data, so the main effects and response contour plot gave some insight.
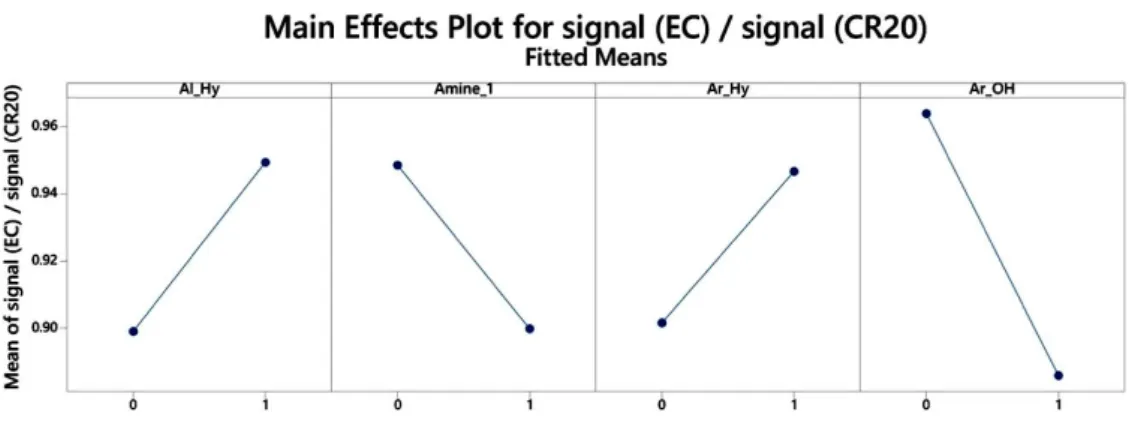
The contour plot in Figure 5 shows that generally the higher the compound polarity and the lower the compound volatility, the higher the proportional level of analyte in the particulate from the CR20 product. This suggests that volatile and non-polar materials are preferentially adsorbed from mainstream smoke by the CR20 product. The main effects plot for the categorical predictors in the model (Figure 6) summarises the directional effects from the chemical subgroups that were significant in the model. The
Figure 5. Contour plot arising from the linear regression analysis.
aromatic and aliphatic hydrocarbons were lower in the CR20 particulate, whereas amines and aromatic alcohols were higher. The directional phenomena identified in this analysis agreed well with the other analytical methods used.
DISCUSSION
This study is, to our knowledge, the first to examine selec-tive sorption of particulate phase compounds in cigarette smoke. Previous studies have focused predominately on removal of gas or vapour phase compounds (e.g., 9, 13). The filter absorbent used in this study, CR20, is a polysty-rene material cross-linked with divinyl benzene, functional-ised with surface primary amine groups. Its surface pore structure is predominantly macroporous with some large mesopores, with a broad pore size distribution of 25–900 nm centred at 105 nm, consistent with very weak physisorption properties. In contrast, it is basic, hydropho-bic and offers significant chemisorption properties for vapour phase aldehydes and HCN (13).
All of the data analysis methods used in the current study identified volatile and low polarity chemicals as being proportionally lower in the particulate phase from the CR20 filtered cigarette. The agreement between the ordinal logistic regression analysis and the non-parametric meth-ods, which rely on very few technical assumptions is encouraging, and points to patterns that can be explained by physically and chemically meaningful phenomena. For example, the selective interactions between CR20 and aryl and aromatic hydrocarbons, and their consequent partial removal from smoke, may be due to hydrophobic (13), van der Waals and pi-pi association forces arising from the polystyrene/divinylbenzene backbone of the CR20 resin. The Moods median test analysis also identified selective reduction in abundance of acids in cigarette smoke, consis-tent with the basic nature of CR20 and previous findings with HCN removal (13). More generally, the primary amines of CR20 resin are strongly nucleophilic and basic, and may potentially lead to amide formation or other reaction modes, including something as simple as salt formation.
The opposite trend was seen for amines, and aromatic hydroxylated compounds. These latter two groups appear to be higher in the particulate phase of the CR20 product. The trend for amino compounds may be due to the CR20 acting as a pH modifier and converting involatile amine salts in smoke to volatile unprotonated forms. This would result in increases of these species in the gas phase. The reason for lack of binding of aromatic hydroxylated species, however, is unclear. Plasticized cellulose acetate filters of the type used in this study have been shown to possess strong selective filtration properties for phenols (40), and potentially the presence of CR20 in the cavity may have interfered with this mechanism producing the observed effect with aromatic hydroxylated species. These data are from the analysis of the particulate phase of cigarette smoke, the phase of total aerosol containing the less volatile components. In principle, the particulate-phase matter can only encounter the filter by impaction (filtra-tion), which is chemically indiscriminate. However, the current study employed headspace sampling of the particu-late phase, which captured only compounds possessing some degree of volatility. The distinction between particu-late phase and gas phase is therefore overly simplistic and
not clear-cut. Semi-volatile species were found in both particulate and gaseous phases and it is not meaningful to draw an absolute distinction between the two phases of smoke. As an illustrative example, water and formaldehyde are both known to be measurable in the particulate phase, although they are both very volatile in fresh smoke. More-over, the tendency for more volatile particulate phase compounds to be selectively removed by CR20 further demonstrates the mobility of some particulate phase compounds, and the importance of vapour diffusion in driving selective removal of cigarette smoke compounds. Our study demonstrates the power of hyphenated analysis techniques such as GC×GC-TOFMS in aerosol research. However, such techniques require time-consuming analysis due to the large volumes of data obtained using non-targeted comprehensive screening. We demonstrated the utility of chemometric approaches in interpreting the data generated by these techniques, but it is also possible to identify opportunities for improvement. For example, although the purity of the GC×GC-TOFMS spectra was generally high, leading to good quality library matches, a number of peaks remained unassigned because they were not present among the MS libraries that were used. Such a situation is not uncommon (41); the acquisition of accurate mass data would be of significant value and should increase the frequency of peak identification. We used cheminfor-matic methods to classify the chemical hits into discrete groups for onward analysis. This is a novel approach in the field of smoke chemistry and offers advantages of analyti-cal simplicity and interpretability. The classification techniques are also tolerant of trivial MS mis-assignments such as incorrect isomer or chain length identification, because they are unlikely to change group assignment. However, as with all analytical approaches, the quality of the output will always be dictated by the quality of the original dataset. A future development would be to use more sophisticated statistical tools, for example artificial neural network quantitative structure-property relationship (QSPR) to model the relationship between chemical finger-prints and filtration behavior.
CONCLUSIONS
Headspace solid-phase microextraction, coupled with GC×GC-TOFMS has been applied to the analysis of mainstream cigarette smoke particulate matter from two types of cigarette differing only in filter construction, in which one cigarette contained 60 ± 1 mg of CR20 resin in the filter cavity, while for the second cigarette, the cavity was empty.
The GC×GC-TOFMS technique (25) identified 429 compounds that differed significantly between mainstream smoke particulate phase from the two types of cigarette, thereby verifying this approach. 316 compounds were identified as being present at higher levels in the empty cavity cigarette than in CR20 and 113 compounds were higher in the smoke of the CR20 cigarette than from EC. 389 compounds showed no significant difference between the cigarettes.
CR20 was previously evaluated for its capacity to remove six aldehydes, HCN, “tar”, nicotine, and CO (13). Its extensive and specific surface functionality were found to make it a good candidate for the selective chemisorption of aldehydes and HCN in cigarette smoke. The present study
has shown that CR20 resin also partially removes more volatile and less polar compounds from the particulate phase of cigarette smoke, and some acids. In contrast, amines and aromatic hydroxylated species were increased in the smoke of CR20 cigarettes relative to empty cavity cigarettes.
Our findings demonstrate that high resolution GC×GC combined with mass spectrometry and chemometric approaches are a powerful tool with which to deconvolute complex combustion aerosols and to identify changes in their chemical composition resulting from modifications to cigarette designs.
REFERENCES
1. Rodgman, A. and T.S. Perfetti: The Chemical Compo-nents of Tobacco and Tobacco Smoke; 2nd Edition,
CRC Press, Boca Raton, FL, USA, 2013. ISBN 9781466515482
2. International Agency for Research Center (IARC): Tobacco Smoke and Involuntary Smoking; IARC Monographs on the Evaluation of Carcinogenic Risks to Humans Volume 83; IARC, Lyon, France, 2004. 3. International Agency for Research Center (IARC):
Personal Habits and Indoor Combustions; IARC Mono-graphs on the Evaluation of Carcinogenic Risks to Humans, Volume 100E, IARC, Lyon, France, 2012. ISBN-13: 978-9283213222
4. Fowles, J. and E. Dybing: Application of Toxicological Risk Assessment Principles to the Chemical Constitu-ents of Cigarette Smoke; Tob. Control 12 (2003) 424–430. DOI: 10.1136/tc.12.4.424
5. Hoffmann, D., I. Hoffmann, and K. El-Bayoumy: The Less Harmful Cigarette: A Controversial Issue. A Tribute to Ernst L. Wynder; Chem. Res. Toxicol. 14 (2001) 767–790. DOI: 10.1021/tx000260u
6. Institute of Medicine, Committee to Assess the Science Base for Tobacco Harm Reduction: Clearing the Smoke: Assessing the Science Base for Tobacco Harm Reduction; edited by K. Stratton, P. Shetty, R. Wallace, and S. Bondurant, National Academies Press, Washington, DC, USA, 2001. ISBN-10: 0-309-07282-4 7. Rouquerol, F., J. Rouquerol, and K. Sing: Adsorption by Powders and Porous Solids; Academic Press, Lon-don, UK, 1999. ISBN 978-0-12-598920-6
8. Branton, P. and R.H. Bradley: Activated Carbons for the Adsorption of Vapours from Cigarette Smoke; Adsorpt. Sci. Technol. 28 (2010) 3–21.
DOI: 10.1260/0263-6174.28.1.3
9. Branton, P., K. McAdam, M. Duke, C. Liu, M. Curle, M. Mola, C. Proctor, and R. Bradley: Use of Classical Adsorption Theory to Understand the Dynamic Filtra-tion of Volatile Toxicants in Cigarette Smoke by Active Carbons; Adsorpt. Sci. Technol. 29 (2011).
DOI: 10.1260/0263-6174.29.2.117.
10. Branton, P.J., A.-H. Lu, and F. Schüth: The Effect of Carbon Pore Structure on the Adsorption of Cigarette Smoke Vapour Phase Compounds; Carbon 47 (2009) 1005–1011. DOI: 10.1016/j.carbon.2008.12.003 11. Reucroft, P.J. and C.T. Chiou: Adsorption of
Cyano-gens Chloride and Hydrogen Cyanide by Activated and Impregnated Carbons; Carbon 15 (1977) 285–290. DOI: 10.1016/0008-6223(77)90031-8
12. Barnes, P.A., M.J. Chinn, E.A. Dawson, and P.R.
Norman: Preparation, Characterisation and Application of Metal-Doped Carbons for Hydrogen Cyanide Re-moval; Adsorpt. Sci. Technol. 20 (2002) 817–833. DOI: 10.1260/02636170260555750
13. Branton, P.J., K.G. McAdam, D.B. Winter, C. Liu, M.G. Duke, and C.J. Proctor: Reduction of Aldehydes and Hydrogen Cyanide Yields in Mainstream Cigarette Smoke Using an Amine Functionalised Ion Exchange Resin: Chem. Cent. J. 5 (2011) 15.
DOI: 10.1186/1752-153X-5-15
14. Charles, S.M., S.A. Batterman, and C. Jia: Composition and Emissions of VOCs in Main- and Side-Stream Smoke of Research Cigarettes; Atmos. Environ. 41 (2007) 5371–5384.
DOI: 10.1016/j.atmosenv.2007.02.020
15. Charles, S.M., C. Jia, S.A. Batterman, and C. Godwin: VOC and Particulate Emissions from Commercial Cigarettes: Analysis of 2,5-DMF as an ETS Tracer; Environ. Sci. Technol. 42 (2008) 1324–1331. DOI: 10.1021/es072062w
16. Ye, Q.: Development of Solid-Phase Microextraction Followed by Gas Chromatography-Mass Spectrometry for Rapid Analysis of Volatile Organic Chemicals in Mainstream Cigarette Smoke; J. Chromatogr. A 1213 (2008) 239–244. DOI: 10.1016/j.chroma.2008.10.063 17. Polzin, G.M., R.E. Kosa-Maines, D.L. Ashley, and C.H.
Watson: Analysis of Volatile Organic Compounds in Mainstream Cigarette Smoke; Environ. Sci. Technol. 41 (2007) 1297–1302. DOI: 10.1021/es060609l
18. Phillips, J.B. and J. Beens: Comprehensive Two-Di-mensional Gas Chromatography: A Hyphenated Me-thod with Strong Coupling Between the Two Dimen-sions; J. Chromatogr. A 856 (1999) 331–347. DOI: 10.1016/S0021-9673(99)00815-8
19. Dallüge, J., M. van Rijn, J. Beens, R.J.J. Vreuls, U.A.T. Brinkman: Comprehensive Two-Dimensional Gas Chromatography with Time-of-Flight Mass Spectromet-ric Detection Applied to the Determination of Pesticides in Food Extracts; J. Chromatogr. A 965 (2002a) 207–217. DOI: 10.1016/S0021-9673(01)01324-3 20. Dallüge, J., L.L.P. van Stee, X. Xu, J. Williams, J.
Beens, R.J.J. Vreuls, and U.A.T. Brinkman: Unravel-ling the Composition of Very Complex Mixtures by GC × GC TOFMS Cigarette Smoke; J. Chromatogr. A 974 (2002b) 169–184.
DOI: 10.1016/S0021-9673(02)01384-5
21. Lu, X., J. Cai, H. Kong, M. Wu, R. Hua, M. Zhao, J. Liu, and G. Xu: Analysis of Cigarette Smoke Conden-sates by Comprehensive Two-Dimensional Gas Chro-matography / Time-of-Flight Mass Spectrometry. Part I: Acidic Fraction; Anal. Chem. 75 (2003) 4441–4451. DOI: 10.1021/ac0264224
22. Lu, X., M. Zhao, H. Kong, J. Cai, J. Wu, M. Wu, R. Hua, J. Liu, and G. Xu: Characterization of Cigarette Smoke Condensates by Comprehensive Two-Dimen-sional Gas Chromatography / Time-of-Flight Mass Spectrometry (GC × GC/TOFMS). Part 2: Basic Frac-tion; J. Sep. Sci. 27 (2004) 101–109.
DOI: 10.1002/jssc.200301659
23. Lu, X., M. Zhao, H. Kong, J. Cai, J. Wu, M. Wu, R. Hua, J. Liu, and G. Xu: Characterization of Complex Hydrocarbons in Cigarette Smoke Condensate by Gas Chromatography-Mass Spectrometry and Comprehen-sive Two-Dimensional Gas Chromatography-Time-of-Flight Mass Spectrometry; J. Chromatogr. A 1043
(2004) 265–273. DOI: 10.1016/j.chroma.2004.05.089 24. Brokl, M., L. Bishop, C.G. Wright, C. Liu, K.G.
McAdam, and J.-F. Focant: Analysis of Mainstream Tobacco Smoke Particulate Phase Using Comprehen-sive Two-Dimensional Gas Chromatography Time-of-Flight Mass Spectrometry; J. Sep. Sci. 36 (2013) 1037–1044. DOI: 10.1002/jssc.201200812
25. Brokl, M., L. Bishop, C.G. Wright, C. Liu, K.G. McAdam, and J.-F. Focant: Multivariate Analysis of Mainstream Tobacco Smoke Particulate Phase by Headspace Solid-Phase Micro Extraction Coupled with Comprehensive Two-Dimensional Gas Chromato-graphy-Time-of-Flight Mass Spectrometry; J. Chroma-togr. A 1370 (2014) 216–229.
DOI: 10.1016/j.chroma.2014.10.057
26. Arthur, C.L. and J. Pawliszyn: Solid Phase Microextrac-tion with Thermal DesorpMicroextrac-tion Using Fused Silica Optical Fibers; Anal. Chem. 62 (1990) 2145–2148. DOI: 10.1021/ac00218a019
27. Clark, T.J. and J.E. Bunch: Quantitative Determination of Phenols in Mainstream Smoke with Solid-Phase Microextraction-Gas Chromatography — Selected Ion Monitoring Mass Spectrometry; J. Chromatogr. Sci. 34 (1996) 272–275. DOI: 10.1093/chromsci/34.6.272 28. Clark, T.J. and J.E. Bunch: Qualitative and Quantitative
Analysis of Flavor Additives on Tobacco Products Using SPME-GC-Mass Spectroscopy; J. Agric. Food Chem. 45 (1997) 844–849. DOI: 10.1021/jf960522r 29. Stanfill, S.B. and D.L. Ashley: Solid Phase
Micro-extraction of Alkenylbenzenes and Other Flavor-Related Compounds from Tobacco for Analysis by Selected Ion Monitoring Gas Chromatography-Mass Spectrometry; J. Chromatogr. A 858 (1999) 79–89. DOI: 10.1016/S0021-9673(99)00796-7
30. Merckel, C., F. Pragst, A. Ratzinger, B. Aebi, W. Bernhard, and F. Sporkert: Application of Headspace Solid Phase Microextraction to Qualitative and Quanti-tative Analysis of Tobacco Additives in Cigarettes; J. Chromatogr. A 1116 (2006) 10–19.
DOI: 10.1016/j.chroma.2006.03.010
31. Yang, S.S., C.B. Huang, and I. Smetena: Optimization of Headspace Sampling Using Solid-Phase Micro-extraction for Volatile Components in Tobacco; J. Chromatogr. A 942 (2002) 33–39.
DOI: 10.1016/S0021-9673(01)01376-0
32. Yang, S.S. and I. Smetena: Determination of Tobacco Alkaloids Using Solid Phase Microextraction and GC-NPD; Chromatographia 47 (1998) 443–448.
DOI: 10.1007/BF02466477
33. Watson, C.H. and D.L. Ashley: Quantitative Analysis of Acetates in Cigarette Tobacco Using Solid-Phase Microextraction and Gas Chromatography-Mass Spectrometry; J. Chromatogr. Sci. 38 (2000) 137–144. DOI: 10.1093/chromsci/38.4.137.
34. Lin, H., Q. Ye, C. Deng, and X. Zhang: Field Analysis of Acetaldehyde in Mainstream Tobacco Smoke Using
Solid-Phase Microextraction and a Portable Gas Chromatograph; J. Chromatogr. A 1198–1199 (2008) 34–37. DOI: 10.1016/j.chroma.2008.05.050
35. Watson, C.H., J.S. Trommel, and D.L. Ashley: Solid-Phase Microextraction-Based Approach to Determine Free-Base Nicotine in Trapped Mainstream Cigarette Smoke Total Particulate Matter; J. Agric. Food Chem. 52 (2004) 7240–7245. DOI: 10.1021/jf049455o 36. Pierce, K.M., J.C. Hoggard, J.L. Hope, P.M. Rainey,
A.N. Hoofnagle, R.M. Jack, B.W. Wright, and R.E. Synovec: Fisher Ratio Method Applied to Third-Order Separation Data to Identify Significant Chemical Components of Metabolite Extracts; Anal. Chem. 78 (2006) 5068–5075. DOI: 10.1021/ac0602625
37. International Organization for Standardization (ISO): ISO 3308:2012 – Routine Analytical Cigarette-Smoking Machine – Definitions and Standard Conditions; ISO, Geneva, Switzerland, 2012.
38. International Organization for Standardization (ISO): ISO 3402:1999 – Tobacco and Tobacco Products – Atmosphere for Conditioning and Testing; ISO, Geneva, Switzerland, 1999.
39. Reichenbach, S.E., V. Kottapalli, M. Ni, and A. Vis-vanathan: Computer Language for Identifying Chemi-cals with Comprehensive Two-Dimensional Gas Chro-matography and Mass Spectrometry; J. Chromatogr. A 1071 (2005) 263–269.
DOI: 10.1016/j.chroma.2004.08.125
40. Dittrich, D.J., R.T. Fieblekorn, M.J. Bevan, D. Rush-forth, J.J. Murphy, M. Ashley, K.G. McAdam, C. Liu, and C.J. Proctor: Approaches for the Design of Reduced Toxicant Emission Cigarettes; SpringerPlus 3 (2014) 374. DOI: 10.1186/2193-1801-3-374
41. Bino, R.J., R.D. Hall, O. Fiehn, J. Kopka, K. Saito, J. Draper, B.J. Nikolau, P. Mendes, U. Roessner-Tunali, M.H. Beale, R.N. Trethewey, B.M. Lange, E.S. Wurtele, and L.W. Sumner: Potential of Metabolomics as a Functional Genomics Tool; Trends Plant Sci. 9 (2004) 418–425. DOI: 10.1016/j.tplants.2004.07.004
Corresponding author: Kevin Gerard McAdam, Ph.D. McAdam Scientific Ltd. 50 Leigh Rd Eastleigh SO50 9DT UK E-mail:[email protected]
Appendix
Appendix Figure A1a. Distribution of 1tR values. Red Line is a normal distribution fit to the data.
Appendix Figure A1b. Distribution of 2tR values.
Appendix Figure A3. Empirical CDF plots of the mean response for the two products.
Appendix Figure A4. Normal distribution of the smoke component ratios from the two cigarettes.
Appendix Table A1. 7-Group system.
Functionality present (7-group system) Simple name Number of members
Alcohols: aryl and aliphatic Alcohol 90
Nitrogenous: basic, aliphatic and aromatic Amine 101
Ether, aliphatic and aromatic Ether 159
Ester: lactone, furanone, pyranone, aryl and aliphatic Ester 49
Carbonyl: aryl and aliphatic Carbonyl 43
Hydrocarbon: aryl and aliphatic, unsaturated and saturated Hydrocarbon 331
Misc. polar including acids Misc. polar 45
Appendix Table A2. Kruskal-Wallis Test: signal (EC) / signal (CR20) versus 10-group classification factors.
a) 10-Group classification model
Classification N Median Ave rank Z
Acid 13 1.0488 530.2 1.86 Al_Hy 169 1.0622 510.6 6.24 Al_OH 51 0.9435 414.8 0.17 Amine 101 0.8262 303.6 !4.81 Ar_Hy 162 0.9778 441.3 1.92 Ar_OH 39 0.8180 258.9 !4.08 Carb 159 0.9240 389.1 !1.22 Esth 49 0.8456 350.8 !1.79 Ethr 43 0.9406 406.1 !0.10 Misc 32 0.8974 370.9 !0.94 Overall 818 409.5 b) Summary statistics H DF P Model output 78.51 9 0.000
Adjusted for ties 78.51 9 0.000
Appendix Table A3. Mood Median Test: signal (EC) / signal (CR20) versus 10-group classification factors.
a) Mood median test for signal (EC) / signal (CR20)
Chi-Square 59.80
DF 9
P 0.000
Appendix Table A3. Mood Median Test: signal (EC) / signal (CR20) versus 10-group classification factors. Continued.
b) 10-Group classification model
Classification N # N > Median Q3!Q1 Acid 2 11 1.049 0.318 Al_Hy 65 104 1.062 0.573 Al_OH 25 26 0.944 0.260 Amine 71 30 0.826 0.259 Ar_Hy 65 97 0.978 0.390 Ar_OH 33 6 0.818 0.127 Carb 82 77 0.924 0.306 Esth 29 20 0.846 0.247 Ethr 19 24 0.941 0.371 Misc 18 14 0.897 0.293
Appendix Table A4. Ordinal logistic regression (Minitab).
a) Link Function: Logit
i) Response Information
Variable Value Count
Filtration Selectivity 3 113
2 389
1 316
Total 818
ii) Factor Information
Factor Levels Values
Ar_OH 2 0, 1
Ar_Hy 2 0, 1
Amine 2 0, 1
Al_Hy 2 0, 1
b) Logistic Regression Table
Predictor Coef SE Coef Z P Odds ratio 95% CI
Lower Upper Const(1) 5.04387 0.464802 10.85 0.000 Const(2) 8.71254 0.551398 15.80 0.000 Mean1t R -0.135629 0.0132510 -10.24 0.000 0.87 0.85 0.90 Mean2t R -5.66062 0.478954 -11.82 0.000 0.00 0.00 0.01 Ar_OH 1 -1.54180 0.434239 -3.55 0.000 0.21 0.09 0.50 Ar_Hy 1 0.462206 0.213196 2.17 0.030 1.59 1.05 2.41 Amine 1 -0.706757 0.270786 -2.61 0.009 0.49 0.29 0.84 Al_Hy 1 0.515430 0.233111 2.21 0.027 1.67 1.06 2.64 Log-Likelihood = -572.475
c) Test that all slopes are zero
G 481.794
DF 6
Appendix Table A4. Ordinal logistic regression (Minitab). Continued.
d) Goodness-of-Fit Tests
Method Chi-Square DF P
Pearson 1638.82 1628 0.420
Deviance 1144.95 1628 1.000
e) Measures of association between the response variable and predicted probabilities
Pairs Number Percent Summary Measures
Concordant 176491 87.1 Somers’ D 0.74
Discordant 25766 12.7 Goodman-Kruskal Gamma 0.75
Ties 332 0.2 Kendall’s Tau-a 0.45
Total 202589 100.0
Appendix Table A5. Linear regression analysis: signal (EC) / signal (CR20) versus MeanRT1, MeanRT2, Al_Hy, Amine_1, Ar_Hy, Ar_OH.
a) Box-Cox transformation
Rounded λ !0.5
Estimated λ !0.41346
95% CI for λ (!0.627960, !0.196960)
b) Analysis of variance for transformed response
Source DF Adj SS Adj MS F-Value P-Value
Regression 6 4.7498 0.79164 91.72 0.000 Mean1t R 1 1.1622 1.16224 134.66 0.000 Mean2t R 1 1.2409 1.24086 143.77 0.000 Al_Hy 1 0.0676 0.06755 7.83 0.005 Amine_1 1 0.0583 0.05827 6.75 0.010 Ar_Hy 1 0.0648 0.06478 7.51 0.006 Ar_OH 1 0.0669 0.06693 7.75 0.005 Error 811 6.9998 0.00863 Total 817 11.7496
c) Model summary for transformed response
S 0.0929035
R-sq 40.43%
R-sq(adj) 39.98%
R-sq(pred 39.41%
d) Coefficients for transformed response
Term Coef SE Coef T-Value P-Value VIF
Constant !0.7166 0.0176 !40.61 0.000 Mean1t R !0.005953 0.000513 !11.60 0.000 1.18 Mean2t R !0.2097 0.0175 !11.99 0.000 1.48 Al_Hy1 0.0284 0.0101 2.80 0.005 1.60 Amine_1 1 !0.0274 0.0105 !2.60 0.010 1.14 Ar_Hy 1 0.02539 0.00927 2.74 0.006 1.29 Ar_OH 1 !0.0439 0.0158 !2.78 0.005 1.07