Evaluation of methane oxidation in a landfill cover
material using a simple indicator approach
Jonathan A. Lafond and Suzanne E. Allaire*
Horticultural Research Centre,Université Laval, 2480 Hochelaga, Quebec, Qc G1V 0A6, Canada Fax: (418) 656-7871
E-mail: jonathan.lafond.2@ulaval.ca E-mail: suzanne.allaire@fsaa.ulaval.ca *Corresponding author
Alexandre R. Cabral
Department of Civil Engineering, Université de Sherbrooke,2500 blvd de l’Université, Sherbrooke, Qc J1K 2R1, Canada E-mail: alexandre.cabral@usherbrooke.ca
Abstract: Estimates of methane (CH4) oxidation rates (Rg) in biocovers are
crucial for development of abatement strategies. Rg values were estimated
in a landfill biocover with a simple approach based on gas diffusion theory. Rg varied from 0 to 1.1 × 10⁻⁶ kg m–3 s–1. Highest oxidation efficiencies reached
80–100% when soil water content < 40%, temperature > 20°C and O2 concentration > 0.1 kg m–3. R
g was correlated to oxidation efficiency measured
by stable isotopes and surface emissions. The approach allows for affordable continuous monitoring of Rg, but only gives a rough estimate of CH4 oxidation rate.
Keywords: gas diffusion; gas movement; oxygen; waste management;
temporal variation; compost; landfill biocover; methanotrophic oxidation.
Reference to this paper should be made as follows: Lafond, J.A., Allaire, S.E.
and Cabral. A.R. (2011) ‘Evaluation of methane oxidation in a landfill cover material using a simple indicator approach’, Int. J. Environmental Engineering, Vol. 3, Nos. 3/4, pp.298–317.
Biographical notes: Jonathan A. Lafond is a PhD Student at the Département
des sols et de génie agroalimentaire at Université Laval. He has been working on gas transport in soils, with special focus on multi-scale variability of gas diffusion. His interest includes different aspects of soil physics such as CT scanning, measuring methods and geostatistics with implications in several fields such as landfills and agriculture. He collaborates with several scientists in different research fields. His participation in the scientific community is ongoing with great interest in improving environmental health for present and future generations.
Suzanne E. Allaire is a Professor at the Département des sols et de génie agroalimentaire at Université Laval. She works on mass movement and preferential flow in porous media, with special focus on gas and contaminant
in soils. Her actual interest is multi-scale and multivariate spatio-temporal variability of soil physical properties and their impact on several environmental or engineering processes. She also develops preferential flow aspects of risk indicators of water contamination of a National Project (NAHARP). She has participated in various projects involving fluid flow in porous media. She teaches soil physics and hydrodynamics.
Alexandre R. Cabral is a Professor with the Civil Engineering Department, Université de Sherbrooke. He has more than 20 years of experience in landfill and mining research, with special focus on final cover design alternatives. He is also Project Manager for Groupe SM International, an engineering company from Quebec, which has offices in many countries. He has participated in various projects involving landfill final covers and mine reclamation projects. He teaches the following courses: Soil Mechanics, Sustainable Design and Environmental Management (Undergradutate) and Environmental Geotechnics (Graduate).
1 Introduction
Methane (CH4) is an important Greenhouse Gas (GHG), with an effect 25 times higher than CO2 in carbon equivalent over 100 years (IPCC, 2007a). Anthropogenic sources of CH4 emissions are actually responsible for more than 60% of the total global budget, with landfills representing one of the largest contributors by nearly 23% in the USA (US Environmental Protection Agency, 2009) and 25% in Canada (Environment Canada, 2007). CH4 constitutes from 50% to 60% of landfills biogases (Czepiel et al., 1996). Landfills are thus an important factor contributing for the drastic increase (almost triple) in atmospheric CH4 concentration noted over the last 250 years.
Landfill biogases (mainly CO2 and CH4) can be intercepted by collection systems, which are far from being 100% efficient. In addition, gas collection systems are operated only for a relatively short period of time compared with the actual duration of biogas emissions (Humer and Lechner, 1999). They are turned off once they become uneconomical, which mean that subsequent CH4 production constitutes fugitive emissions. Also, more than 75% of Canadian landfills are not equipped with a collection system and will not because they are either too old or too small. As a consequence, significant amounts of biogases escape as fugitive emissions during the lifetime of a landfill (e.g., Börjesson et al., 2007; Spokas et al., 2006).
Fugitive CH4 emissions can be reduced by the action of methanotrophic bacteria, which are able to use molecular oxygen to oxidise CH4 into CO2 within the soil cover, also referred as biocover (Huber-Humer et al., 2008; Jugnia et al., 2008). Oxidation efficiencies can reach up to 90% of the CH4 moving across the biocovers (Cabral et al., 2010; Gebert et al., 2003; Rannaud et al., 2009). Biocovers are viewed as an economically viable mean of reducing emissions in old and small landfills and as a complement to collecting systems. In fact, biocovers are cited in the IPCC Working Group III assessment report (IPCC, 2007b; Table SPM 3) as one of the key technologies for reducing fugitive landfill emissions.
However, much has to be learned about optimal conditions for methanotrophic oxidation. Besides the presence of CH4, the presence of O2 is a key parameter (Czepiel et al., 1996; Gebert et al., 2003). It has to diffuse from the surface into the substrate
to reach bacteria (Stępniewski and Zygmunt, 2000). This process is influenced by soil water content and bulk density because of their influence on air-filled porosity. CH4 oxidation is also influenced by soil temperature, because of its impact on reaction rates and gas movement (Reay et al., 2001). Meteorological conditions such as air temperature, changes in barometric pressure and rainfall infiltration also influence CH4 oxidation by affecting the movement of all gases. Nutrient availability is another factor for bacterial growth (Hilger and Humer, 2003). However, most of these parameters vary substantially with time, which renders estimates of variation in oxidation a rather difficult task; nonetheless, they are fundamental to improve GHG budget estimates and optimise gas management strategies.
Proper estimations of GHG emissions from landfills require an estimate of oxidation in the cover material. These estimations are usually performed using empirical models, some of which use a constant value for oxidation efficiency (the IPCC model). In addition, estimations vary substantially depending on the model used (Scharff and Jacobs, 2006). Briefly, they are not reliable. GHG budget estimated using empirical models may thus be greatly underestimated because of the large possible contribution of oxidation, irrespective of how widely it varies with time. On the other hand, continuous and reliable field estimation is complex and not easily available.
Several methods have been developed for estimating CH4 oxidation. Some use isotope fractionation based on the increasing 13C/12C ratio related to the fact that bacteria oxidise 12C-isotope preferentially to the 13C-isotope (Mahieu et al., 2008). This approach is considered as the method of reference. However, its efficiency for estimating variations in oxidation is limited for several reasons, including the fact that it cannot be used in a continuous manner. Alternatively, one could estimate CH4 oxidation by means of the evolution of the CH4/CO2 ratios along a gas profile. This ratio gives a rough idea of oxidation rates, but unknowns concerning the source of changes in CO2 and O2 (e.g., caused by soil respiration) render this approach rather imprecise. Another method that is under development and has recently been used to estimate the kinetics of CH4 oxidation is the Gas Push-Pull Test (GPPT) (Gomez et al., 2009; Gonzalez-Gil et al., 2008; Urmann et al., 2005). A GPPT consists in the injection of a mixture containing CH4 and O2 and non-reactive tracer gases into the substrate, followed by extraction of the injected gases that mix with the air already in the substrate. Rate constants for CH4 oxidation can be calculated by analysis of breakthrough curves of CH4 and of an inert tracer gas (Urmann et al., 2005). Other approaches are based on gas movement for which many complex models have been developed (De Visscher and Van Cleemput, 2003; Metcalfe and Farquhar, 1987; Stein et al., 2001).
When advective fluxes can be considered negligible (Rannaud et al., 2009), a simple approach based on the diffusion theory can be used with in situ measurements of CH4 concentrations, combined with easy-to-obtain parameters, such as water content and temperature. This type of approach is quite simple and inexpensive for routine measurements, as well as for the estimation of temporal variation in CH4 oxidation rates. As a consequence, the development of a reliable simple method to estimate CH4 oxidation rates within final covers constitutes an important contribution.
The goal of this study is to estimate CH4 oxidation rates in an experimental biocover made of a sand–compost mixture using a simple approach based on gas diffusion and standard measurements such as soil water content, bulk density and gas concentrations. Relationships between calculated oxidation rates and some physical properties of this particular biocover are studied over two seasons (2006–2007). Results from a study
involving stable carbon isotopes (Cabral et al., 2010) and CH4 surface emissions data for the same site are also used to validate the proposed approach.
2 Material and methods
2.1 Cell description
As part of an ongoing project aiming to study CH4 oxidation in landfill covers, three experimental Passive Methane Oxidation Biocovers (PMOBs) were constructed and instrumented in June 2006 on a sanitary landfill near St-Nicéphore, Québec, Canada (45.814324 N, −72.376728 W). Monitoring data and results obtained from one of them (PMOB-1) are reported herein. PMOB-1’s dimensions were 2.75-m wide × 9.75-m long. It was covered with a 0.80-m thick sand–compost mixture (Jugnia et al., 2008), herein referred to as substrate. The substrate was underlain by a 0.10-m thick transition layer consisting of 6.4-mm gravel. Below this layer, a thick Gas Distribution Layer (GDL), consisting of 12-mm gravel (Figure 1(A)), was constructed until the 3.5 years old waste mass was encountered. As a consequence, the PMOB-1 was fed in a passive manner with biogas coming directly from the waste mass. The GDL (Figure 1(A)) allows a good distribution of the incoming biogas. The walls around the PMOB were thermally shielded from the outside environment by 0.15-m thick polystyrene panels. The goal was to prevent lateral migration of moisture owing to thermal gradients, which could lead to preferential flow paths.
Figure 1 (A) Lateral cross-section of PMOB-1 and (B) schematic view in depth of the installed
probes (G: gas probes; T: temperature sensors; θ: water content probes)
The substrate material was composed of five volumes of compost (before sieving) and one volume of coarse sand (D10 = 0.07 mm; D85 = 0.8 mm; Cu = 4.3). The 2-year old compost consisted of a mixture of municipal sewage sludge, sludge from pulp of paper and agri-food industries (Jugnia et al., 2008). This composted material
was considered mature (Jugnia et al., 2008) according to Quebec standard (standard #0143-205-art 9.5, BNQ, 1997). The compost was sieved using an industrial mesh of 12 mm. The resulting organic matter content of the cover material was 17.8% (gvolatile matter g–1dry soil). The cover material was installed in four steps of 0.20-m thick layers successively compacted with a vibrating plate to an average bulk density of 839 kg m–3.
Temperature sensors (TMC20-HD, from Onset), connected to a data acquisition system (HOBO U12, from Onset), volumetric water content sensors (EC-5, from Decagon), connected to another data acquisition system (EM-50, from Decagon) and gas probes (home-made aluminium tubes with an inner diameter of 10 mm that were capped at the top end with a septum), were permanently installed (Figure 1(B)) at four points along the slope gradient (separated by 1.8-m interval) and at four depths (six depths in the case of gas probes) in each profile. Meteorological data, including air temperature, precipitation, atmospheric pressure and wind speed, were continuously recorded by a weather station installed near the experimental cell. Temperatures were obtained in °C and then converted into °K to be used in the calculations presented herein. The average slope of the experimental PMOB was 3.5%.
Air-filled porosity (θa, m3 m–3) and total porosity (Φ, m3 m–3) of the substrate were
calculated using the following equations (Jury and Horton, 2004): 1 b a v s ρ θ = Φ −θ Φ = − ρ (1)
where ρb is the bulk density (kg m–3) and ρs is the empirical particle density for
this material: 2290 kg m–3 (Blake and Hartge, 1986a). The degree of saturation in water at 0.2-m depth (Sw0.2) was calculated using the water content at saturation, i.e., 0.67 m3
water m–3dry matter.
2.2 Monitoring periods
Temperature and water content values were collected every 30 min. Gas samples were taken from each probe at 1–3 weeks intervals, from July to October 2006 and from May to October 2007. Intensive sequences of gas measurement were performed from 5 to 6 September (24-hr sequence) and 12 to 14 September of 2007 (52-hr sequences), where samples were obtained from every probe at 1–4 hours intervals. Volumetric concentrations of CH4, CO2 and O2 in the collected samples were obtained
in situ using a portable landfill gas analyser (Portable Gas Meter, Columbus Instruments, OH) equipped with infrared sensors for CO2 and CH4 and with an electrochemical sensor for O2. Meteorological data were recorded every 30 min by a weather station (Vantage Pro 2, Davis Instruments, CA, USA) installed on site near the experimental cell.
For this paper, only the data corresponding to 0.20-m depth were used for calculating CH4 oxidation rates, because the oxidation front was situated most of the time between 0.10 and 0.30-m depths in this cell (Rannaud et al., 2009).
2.3 Relative gas diffusion coefficient (Ds⁄Do)
The estimation of CH4 oxidation rate in the biocover using Fick’s law requires previous determination of the relative gas diffusion coefficient, Ds⁄Do. To determine the latter, six
intact cores were collected from the upper 0.20 m of the cell using PVC tubes of 0.10-m diameter × 0.076-m high (Blake and Hartge, 1986b). The cores were saturated with water and placed on tension tables to achieve desorption curve (Klute, 1986). The desorption curve was determined to measure the total porosity (Φ, m3 m–3) and gas diffusion coefficient (Ds, m2 s–1) at different water contents. The Ds in the cover
material was measured for each step of the desorption curve using the unsteady state open chamber laboratory method (Allaire et al., 2008; Rolston, 1986) with argon as the tracer gas. Gas samples were withdrawn every 15 min for 3.5 h and analysed on a GC (Agilent Technologies, USA) equipped with a molsieve column and a TCD detector. Relative gas diffusion coefficient (Ds/Do, unitless) was calculated with the
coefficient of argon in air (Do = 2.0353 × 10⁻⁵ m2 s–1) corrected for temperature (Roberts,
1972). 2 1 2, 2 1, 1 1 2 . T P T P T P D D T P α = (2)
Measured Ds/Do were compared with 14 simple gas diffusion models (Table 1 in Allaire
et al. (2008)). Root Mean Square Error (RMSE) and bias were calculated to respectively evaluate the average prediction uncertainty, and the intensity of over- or underestimation of Ds/Do (Moldrup et al., 2005). 2 1 1 RMSE N i i d N = =
∑
1 1 bias N i i d N = =∑
(3)di is the difference between predicted and measured values of Ds/Do at a given θa, and
N is the number of measurements. Millington and Quirk (1961) best performed for this sand-compost material. Ds/Do was then predicted for every θv measured in the biocover.
A Do value of 1.96 × 10⁻⁵ m2 s–1 at 282 K (T1) and at 1.013 bars (P1) was used for estimating diffusion of CH4 in air (Marrero and Mason, 1972; Roberts, 1972) and was corrected for soil temperature at 0.25 m (T2) and barometric pressure (P2) with an α = 1.76 (Roberts, 1972; equation (2)).
2.4 CH4 oxidation rate (Rg)
The following hypotheses were considered for the calculation of the CH4 oxidation rate (kg m–3 s–1):
• Fick’s second law is applicable.
• Each individual measurement can be considered to have been taken under steady-state conditions.
• Advection is much lower than diffusion most of the time, such as found by Rannaud et al. (2009) for the same site. Whenever advection occurred, they showed that for low differential pressure such as 0.02 kPa, impact of flux variations on Ds was
estimated to be <20%. The substrate’s gas permeability was also found to be low (in the vicinity of 10–13 m2). All this combined to the fact that the gas collection system was fully functional in this capped area of the landfill support this hypothesis.
• O2 is present at 0.2-m depth in sufficient concentrations for oxidation to occur. • CH4 abatement results only from microbial oxidation in the cover material. • Counter-diffusion of oxygen downward does not affect CH4 diffusion upward
and vice versa.
CH4 oxidation rates (Rg, kg m–3 s–1) were estimated using the following analytical
solution to Fick’s second law, under steady-state condition:
2 2 2 ( ( ) ) ( ) ( ) s g o g L D C z C R z z z − = − − (4)
where z is the depth (m), Rg is calculated at z = −0.20 m considering the reference point
at the soil surface (z = 0), zL is the lower limit of the profile (z = −0.82 m), Cg(z) (kg m–3)
is CH4 concentration at z corrected for temperature (equation (5)) and Co (kg m–3) is the
initial CH4 concentration at zL, which is considered constant at 55% (m–3CH4 m–3air) and also corrected for temperature as follows:
% soil
( ) where [( 0.0025 ( )) 1.4066]
g sg sg
C z =C ×ρ ρ = − ×T K + (5)
with the following boundary conditions.
at 0 g 0 at 0.82 . L o C z z C z ∂ = → = = − → ∂ (6)
Despite the fact that CH4 loading at the bottom of the PMOB fluctuates during the season, the CH4 concentration measured in the raw biogas averages 55% and was quite constant. Rg was calculated for every gas sampling event of 2006 and 2007 and the
uncertainty was considered at every step in the calculations.
2.5 Statistical analyses
The SAS-Stat software (version 9.1; SAS, 2002–2003) was used for statistical analyses. Variance homogeneity was tested using the UNIVARIATE procedure. Whenever not normally distributed, data show bimodal trends. The GLM procedure with repeated measures was used to estimate the effect of year, time and location in the cell. Regressions (PROC STEPWISE) were used to describe interactions between Rg
and properties of the biocover. Since it is known that soil temperature is highly related to air temperature with certain attenuation and time lag (Jury and Horton, 2004), only the temperature at 0.25 m (T0.25) was used in the regressions. Also, CH4 concentration was not included in the regressions since it was directly used in the calculation of Rg.
3 Results and discussions
3.1 General trends Seasons 2006 and 2007
The maximal calculated Rg values reached 1.1 × 10⁻⁶ kg m–3 s–1 and 2.3 × 10⁻⁷ kg m–3 s–1
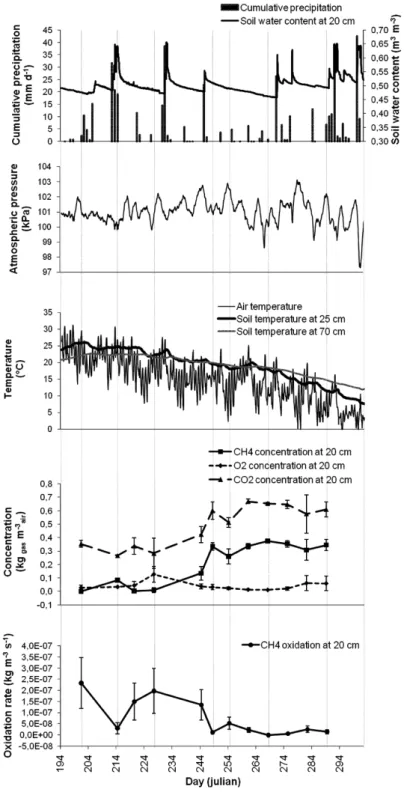
while the minima were −6.2 × 10⁻⁸ kg m–3 s–1 and −9.6 × 10⁻⁹ kg m–3 s–1, for 2007 and 2006, respectively. These minimal values are explained by a production of CH4 instead of oxidation, which occurs under local anaerobic conditions that could be found during wet soil conditions. Maxima for 2007 were obtained from mid-July (DOY 196) to mid-August (DOY 220) (Figure 3). Other Rg peaks were found in mid-June (DOY 166),
mid-May (DOY 140) and at the end of August (DOY 234). Maximal values of Rg
appeared about 20 days later during the summer of 2006. They were much lower than maxima calculated for 2007. Oxidation tended to decrease to very low values from the end of August to the end of both fall seasons.
Considering the 0.80-m thick PMOB and the average air-filled porosity equal to 0.30 m3
air m–3soil in 2007 and equal to 0.20 m3air m–3soil in 2006, the maximal Rg values
were 22.8 g m–2 d–1 in 2007 and 3.2 g m–2 d–1 in 2006. These values correspond to those of Abichou et al. (2009) simulated from field data of a sandy soil (19.2 g m–2 d–1) and a biocover made of compost (2.7 g m–2 d–1) on a Florida landfill. As shown in Table 1, the average Rg for 2007 was 4.8 × 10⁻⁷ kg m–3 s–1 (or 9.95 g m–2 d–1 for a 0.80-m thick PMOB
at an average air-filled porosity of 0.30 m3
air m–3soil). Rg was expected to follow a
sinusoidal function with time. Regression analyses indicate no sinusoidal relationship, but only a weak cubic function for 2006 (r2 = 0.76*).
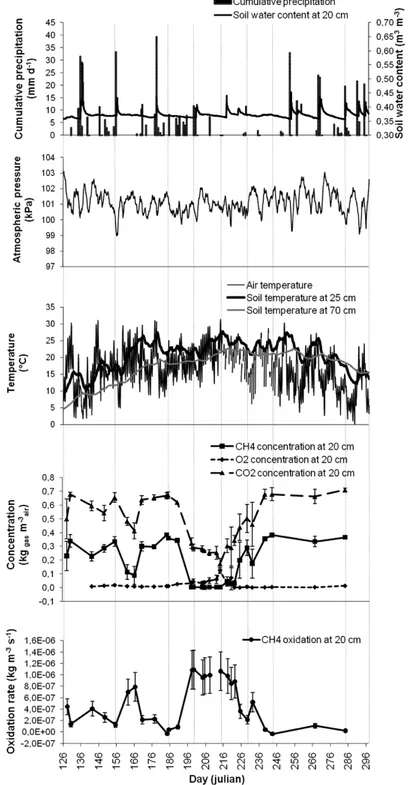
Several differences were observed between soil physical parameters of both seasons. The average θv0.2 was almost 1.5 times higher in 2006 than in 2007 (Table 1). Gas concentrations (CH4, CO2 and O2) were almost the same for both years, while temperatures were slightly higher in 2007 than in 2006 (Table 1). It is important to note that the duration of the sampling campaigns was not the same in each year: in 2006, it started in mid-July in 2006, whereas in 2007 sampling started in early May; this influences averages and tendencies, correlations and regressions between Rg and other
parameters. As a consequence, the results of the two study periods were analysed separately.
Rg was almost 6 times higher in 2007 than in 2006 (Table 1, Figures 2 and 3).
This can be partly explained by the fact that the experimental biocover was constructed in June 2006 and it took some time for full development and adjustment of the microbial population to its environment. Effectively, Jugnia et al. (2008) and Aït-Benichou et al. (2009) obtained an exponential evolution of the pmoA gene copy abundance from June to November 2006 in the same experimental cell indicating that the methanotrophs population was growing at 0.20-m depth during the entire season. Comparatively, methanotrophic bacteria populations were probably stabilised and fully functional for oxidation activity the following year. Thereafter, the discussion is mostly based on 2007 data.
Figure 2 CH4 oxidation rates at 0.2-m depth in the biocover and related atmospheric and soil parameters for 2006 (error bars are incertitude associated to measurement precision)
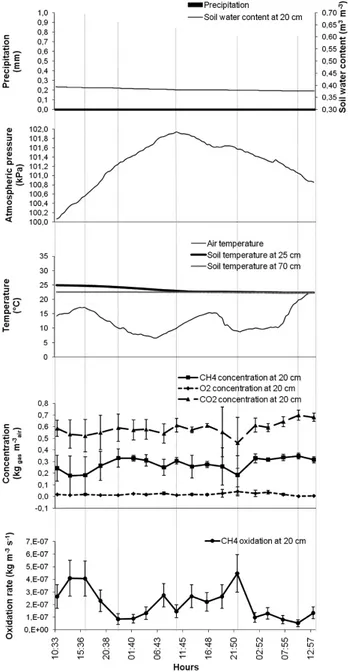
Figure 3 CH4 oxidation rates at 0.2-m depth in the biocover and related atmospheric and soil parameters for 2007 (error bars are incertitude associated to measurement precision)
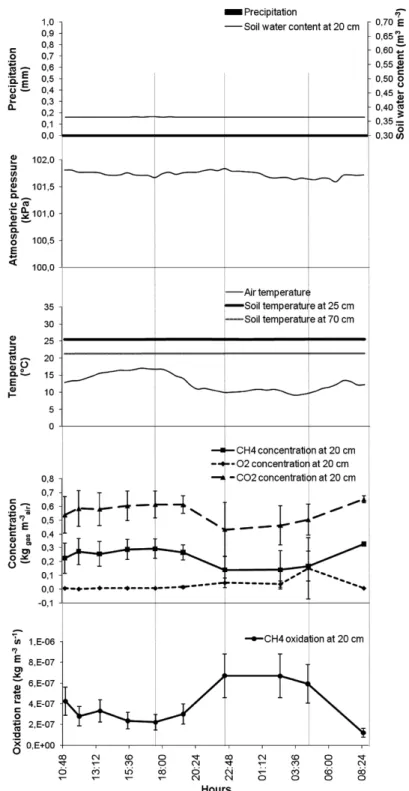
24-h and 52-h intensive sampling sequences
Higher oxidation rates were calculated during night-time of the 24-h sequence and during the afternoon of the 52-h sequence (Figures 4 and 5). Rg variations during this short time
interval indicate that the time of the day during which gas samples are taken influences the estimated oxidation rate by almost 3-fold. Average Rg values (Table 1) of these
sequences correspond to those found during the rest of 2007 (Figures 3–5). Oxidation rates were dependent on the sequence (24 or 52 h) (F = 10.47**). They were thereafter separately analysed. The general shape of the Rg functions was not sinusoidal in either
sequence, but rather cubic (r2 = 0.37**) during the 24-h sequence and no general trend could be found for the 52-h sequence (Figures 4 and 5).
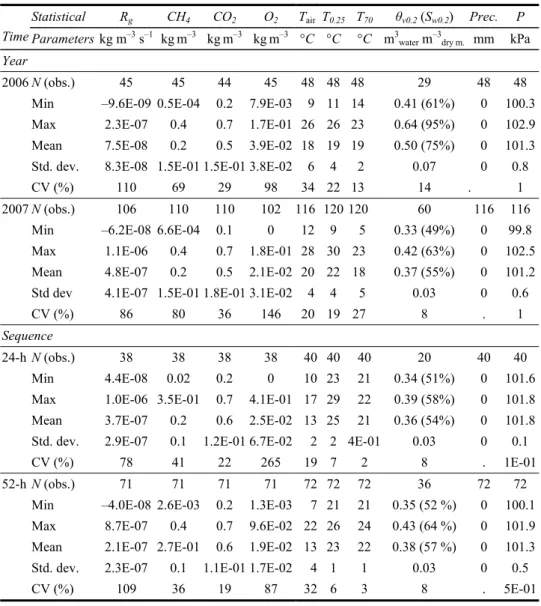
Table 1 Descriptive statistics of oxidation rates (Rg) at 0.2-m depth and associated soil and
atmospheric parameters for both years and sequences
Statistical Rg CH4 CO2 O2 Tair T0.25 T70 θv0.2 (Sw0.2) Prec. P
Time Parameters kg m–3 s–1 kgm–3 kgm–3 kgm–3 °C °C °C m3
water m–3dry m. mm kPa Year
2006 N (obs.) 45 45 44 45 48 48 48 29 48 48
Min –9.6E-09 0.5E-04 0.2 7.9E-03 9 11 14 0.41 (61%) 0 100.3 Max 2.3E-07 0.4 0.7 1.7E-01 26 26 23 0.64 (95%) 0 102.9 Mean 7.5E-08 0.2 0.5 3.9E-02 18 19 19 0.50 (75%) 0 101.3 Std. dev. 8.3E-08 1.5E-01 1.5E-01 3.8E-02 6 4 2 0.07 0 0.8
CV (%) 110 69 29 98 34 22 13 14 . 1
2007 N (obs.) 106 110 110 102 116 120 120 60 116 116
Min –6.2E-08 6.6E-04 0.1 0 12 9 5 0.33 (49%) 0 99.8
Max 1.1E-06 0.4 0.7 1.8E-01 28 30 23 0.42 (63%) 0 102.5 Mean 4.8E-07 0.2 0.5 2.1E-02 20 22 18 0.37 (55%) 0 101.2 Std dev 4.1E-07 1.5E-01 1.8E-01 3.1E-02 4 4 5 0.03 0 0.6
CV (%) 86 80 36 146 20 19 27 8 . 1
Sequence
24-h N (obs.) 38 38 38 38 40 40 40 20 40 40
Min 4.4E-08 0.02 0.2 0 10 23 21 0.34 (51%) 0 101.6
Max 1.0E-06 3.5E-01 0.7 4.1E-01 17 29 22 0.39 (58%) 0 101.8 Mean 3.7E-07 0.2 0.6 2.5E-02 13 25 21 0.36 (54%) 0 101.8 Std. dev. 2.9E-07 0.1 1.2E-01 6.7E-02 2 2 4E-01 0.03 0 0.1
CV (%) 78 41 22 265 19 7 2 8 . 1E-01
52-h N (obs.) 71 71 71 71 72 72 72 36 72 72
Min –4.0E-08 2.6E-03 0.2 1.3E-03 7 21 21 0.35 (52 %) 0 100.1 Max 8.7E-07 0.4 0.7 9.6E-02 22 26 24 0.43 (64 %) 0 101.9 Mean 2.1E-07 2.7E-01 0.6 1.9E-02 13 23 22 0.38 (57 %) 0 101.3 Std. dev. 2.3E-07 0.1 1.1E-01 1.7E-02 4 1 1 0.03 0 0.5
Figure 4 CH4 oxidation rates at 0.2-m depth in the biocover and related atmospheric and soil parameters during 24 h on 5–6 September 2007 (error bars are incertitude associated to measurement precision; precipitations = 0)
Figure 5 CH4 oxidation rates at 0.2-m depth in the biocover and related atmospheric and soil parameters during 52 h on 12–14 September 2007 (error bars are incertitude associated to measurement precision; precipitations = 0)
3.2 Correlations and regressions with soil physical parameters
Whatever the time interval considered (months or hours), Rg was inversely correlated
to CO2 and positively to O2 soil concentrations (Table 2, Figures 2–5). Instinctively, one may expect to obtain the opposite relationship since oxidation consumes O2 and releases CO2. However, the observed relationship only indicates that O2 is a limiting
factor for methanotrophic oxidation. If the expected relationship was the only one occurring at all time, a time lag should occur, which was not the case. Also, an inverse relation between CO2 and CH4 concentrations eventually occurs due to biological oxidation reaction that produces CO2 in a 1 : 1 ratio (Kjeldsen, 1996). Weaker relationships in 2006 may be due to fewer data available for regression analysis (Table 2) and to much lower variations in Rg (Figure 2 vs. Figure 3).
Optimal water content (% of dry matter) for Rg in landfill soil covers seems to be
around 10–20% (Boeckx and Van Cleemput, 1996; Czepiel et al., 1996; Whalen et al., 1990), but higher thresholds up to 45% were observed for different soil types such as compost (Hilger and Humer, 2003; Humer and Lechner, 1999). The average soil water content in 2006 was much higher than this 20% threshold (Table 1). This higher soil humidity in 2006 did not favour oxidation during most of the studied period, resulting in no significant relationship between Rg and θv0.2 (Table 2, Figure 2). However, if water content is reduced when soil temperature in temperate climate rise above 5°C, Rg may
significantly increase (Reay et al., 2001). This was the case for the warmer period of 2007 (Figure 3), when θv0.2 was about one-third lower than that of 2006 (Table 1); a strong inverse correlation is noted between Rg and θv0.2 (Table 2).
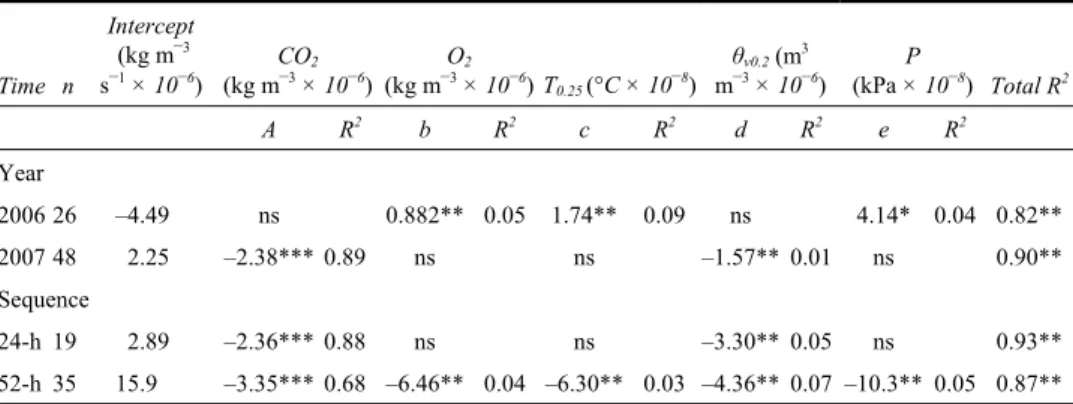
Table 2 Stepwise regression coefficients of the soil parameters in relation to the oxidation rate (Rg, kg m–3 s–1) in 2006 and 2007 and for both sequences performed in
September 2007 Time n Intercept (kg m–3 s–1 × 10⁻⁶) CO2 (kg m–3 × 10⁻⁶) O2 (kg m–3 × 10⁻⁶) T 0.25 (°C × 10–8) θv0.2 (m3 m–3 × 10⁻⁶) P (kPa × 10–8) Total R2 A R2 b R2 c R2 d R2 e R2 Year 2006 26 –4.49 ns 0.882** 0.05 1.74** 0.09 ns 4.14* 0.04 0.82** 2007 48 2.25 –2.38*** 0.89 ns ns –1.57** 0.01 ns 0.90** Sequence 24-h 19 2.89 –2.36*** 0.88 ns ns –3.30** 0.05 ns 0.93** 52-h 35 15.9 –3.35*** 0.68 –6.46** 0.04 –6.30** 0.03 –4.36** 0.07 –10.3** 0.05 0.87**
Model: Rg = Intercept + a (CO2) + b (O2) + c (T0.25) + d (WC0.2) + e (P). R2 associated to each parameter are partial R2.
Parameters followed by *, **, ***, and ns are significant at Pr > F of 0.1, 0.05, 0.001 and non-significant.
CH4 oxidation occurred mainly when O2 concentrations were between 0.05 and 0.17 kg m–3 (Figures 2 and 3). As a consequence of high water content in 2006, O
2 diffusion from soil surface to 0.20-m depth was compromised because of low air-filled porosity, as mentioned by De Visscher and Van Cleemput (2003), thereby reducing microbial activity and thus the value of Rg. Similarly, CH4 diffusion from waste decomposition through the biocover is also reduced if the porosity is filled with water rather than with gas. CH4 has then to diffuse upward through the aqueous phase of the soil, which is 10,000 times slower than in air (Hilger and Humer, 2003; Whalen et al., 1990). As a result, O2 concentration was probably a limiting factor in 2006 and during the
52-h sequence while it was not during mid-July–mid-August 2007 and the 24-h sequence (Table 2, Figures 2–5).
CH4 oxidation seems optimal under temperature ranging from 20°C to 25°C, in part because bacteria prefer warmer conditions (Czepiel et al., 1996; Reay et al., 2001). As air temperatures were slightly lower in 2006 than in 2007 (Table 1), the soil temperature fell well below 20°C during most of the measurement period of 2006 (Table 2, Figure 2). Comparatively, soil temperature did not seem to be a limiting factor in 2007 (Table 2) because the soil was warmer (Table 1, Figure 3). The soil temperature was also influenced by its moisture since higher water content increases heat capacity, buffering soil temperature. Wet soils are thus usually cooler, indirectly affecting Rg. In 2007, the
substrate temperature was not a limiting factor since the soil had higher air-filled porosity (average 30%), but it becomes important in wet conditions (Table 2) when soil moisture is really high such as found in 2006 (Table 1, Figure 2).
Temperature has not only a direct impact on microbial activity but also an indirect one: it influences gas movement and gas concentration, in the gas and in the liquid phases. An increase in temperature enhances gas movement, thus CH4 upward migration, and therefore an increase in its concentration in the pores of the substrate. The results obtained are in agreement with this statement since CH4 concentration at 0.20-m depth was positively correlated to air temperature within a day (Figures 4 and 5). Such variation in air temperature, faster than soil temperature, can create gas fluxes by a thermal gradient. This phenomenon was not accounted for in the proposed approach. Temperature gradient between waste and soil surface was not considered either. However, in this latter case, the thick GDL (Figure 1(a)) may limit the effect of waste temperature on gas movement through the biocover.
Changes in atmospheric pressure create pressure gradient and advective fluxes. CH4 moving upward from the wastes reaches methanotrophic communities more quickly when atmospheric pressure is low, with an important effect in wet soil because gas movement is more limited than in a drier soil. Under the same conditions, oxygen movement from the atmosphere to microbial population is delayed unless strong wind pushes it into the soil, reducing the impact of pressure gradient on Rg created by change
in atmospheric pressure. As a result, atmospheric pressure (P) affected CH4 oxidation, but to a much lower extent than the above-discussed parameters during wet soil conditions (Table 2). These results support the hypothesis that changes in atmospheric pressure were limited and not accounted for in the present approach.
3.3 Validation of the proposed approach
The Rg estimated with the proposed approach (and equivalent in terms of oxidation
efficiencies) were compared with oxidation efficiency (fo) obtained from stable isotope
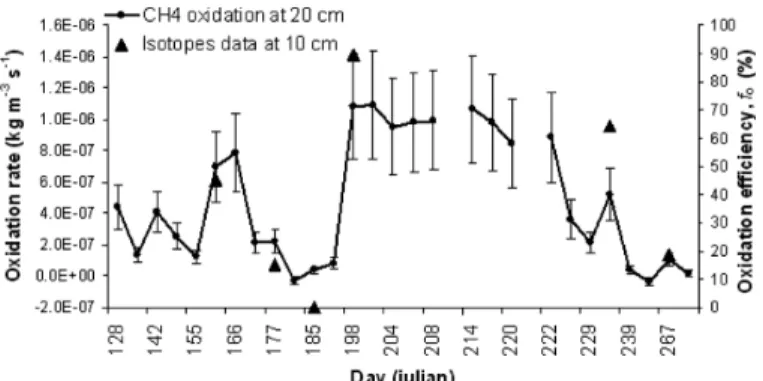
analyses performed by Cabral et al. (2010) using data from 2007 for the same site (no data available for 2006). Results from only six sampling dates were available for comparison with Rg. As shown in Figure 6, there is a strong positive correlation
(Pearson r = 0.94, p < 0.01) between fo measured at 0.1 m depth and Rg calculated at
0.2 m depth. Maximal Rg (equivalent to a calculated 98.9% oxidation efficiency)
corresponds to maximal fo value (about 90%). Differences between both approaches
could be due to errors associated to the simple proposed approach, to difference in the measured depth and to high local variability.
Figure 6 CH4 oxidation rates at 0.2-m depth in the biocover compared with stable carbon isotopes data obtained for the same site at 0.1-m depth in 2007 (error bars are incertitude associated to measurement precision)
Rg values were also compared with CH4 surface emissions measured 17 times on the same PMOB in 2007 (Figure 7). As expected, a negative correlation was found between Rg and CH4 surface emissions (Pearson r = –0.51, p < 0.05). Highest emissions (around 3500 g m2 d–1) were found around DOY 190 when very slight oxidation rate was estimated. In addition, maximal Rg (almost 100%, see above) corresponded to zero
emission events (Figure 7). Most importantly, trends in time of Rg estimated with the
proposed approach, of fo values from the stable isotope approach (Figure 6) and of CH4 surface emissions (Figure 7) follow the same pattern.
Figure 7 CH4 oxidation rates at 0.2-m depth in the biocover compared with CH4 surface emissions data obtained for the same site in 2007 (error bars for oxidation rate are incertitude associated to measurement precision and for emissions are standard deviation)
4 Conclusions
CH4 oxidation rates, Rg, were calculated according to the proposed approach for
PMOB-1, an experimental biocover installed at the St-Nicéphore landfill, Quebec, Canada. Rg ranged from 0 to 1.1 × 0–6 kg m–3 s–1, with wide variations throughout both
seasons and during the two sequences of intensive sampling. The maximal oxidation efficiency (equivalent to the maximal Rg value) obtained by the proposed approach was
Cabral et al. (2010) who performed a series of analyses on the same PMOB-1 following the stable isotopes approach. 100% oxidation efficiency for this PMOB-1 was also confirmed by CH4 surface emissions.
No specific temporal trends in Rg were observed during the two short-term sequences.
Comparatively on a season basis, the highest oxidation rates were observed during July and August, while nearly no oxidation occurred during the fall seasons when temperature cooled down (October and November). The majority of CH4 oxidation occurred during a limited period when the O2 concentration lied between 0.05 and 0.17 kg of gas m–3air and the soil was warm (temperatures roughly higher than 20°C) and relatively dry, with water contents around 37% (m3
water m–3dry matter). The results reaffirm the importance of O2, water content and temperature for estimating CH4 oxidation in landfill biocovers.
Additional information about temporal variability of CO2 soil respiration, other than associated to CH4 oxidation, would have been useful to better estimate and understand oxidation rates. Time series analyses could indicate time lags between oxidation rate and soil or atmospheric parameters, but more data are required. A more thorough validation of the proposed approach for estimating Rg, particularly using well-accepted methods,
such as stable isotopes, is also needed. Further testing to validate the proposed approach should include gas concentration and water content data at every 0.05 m within the first 0.3 m of the biocover profile. This would allow better insight on the effect of dilution by atmospheric air in the upper layers of the biocover. The simple indicator approach proposed in this study for evaluating CH4 oxidation rates may be useful to improve GHG budget with data that can easily be automated and measured at affordable cost.
Acknowledgements
The authors wish to thank numerous students and technicians involved in the project for their fieldwork and data collection, and precious help of Christophe Libbrecht for mathematical aspects. The authors also wish to thank anonymous reviewers for their constructive comments on this paper. This work was financially supported by the National Science and Engineering Research Council of Canada, BIOCAP Canada and Waste Management Canada. When finalising this manuscript, the third author was working as Visiting Professor at the Federal University of Santa Catarina, Brazil, with a grant from CAPES/Brazil.
References
Abichou, T., Mahieu, K., Yuan, L., Chanton, J. and Hater, G. (2009) ‘Effects of compost biocovers on gas flow and methane oxidation in a landfill cover’, Waste Management, Vol. 29, pp.1595–1601.
Aït-Benichou, S., Jugnia, L-B., Greer, C.W. and Cabral, A.R. (2009) ‘Methanotrophs and methanotrophic activity in engineered landfill biocovers’, Waste Management, Vol. 29, No. 9, pp.2509–2517.
Allaire, S.E., Lafond, J.A., Cabral, A.R. and Lange, S.F. (2008) ‘Measurement of gas diffusion through soils: comparison of laboratory methods’, Journal of Environmental Monitoring, Vol. 10, pp.1326–1336.
Blake, G.R. and Hartge, K.H. (1986a) ‘Particle density’, in Klute, A. (Ed.): Methods of Soil Analysis, Part 1. Physical and Mineralogical Methods, American Society of Agronomy – Soil Science Society of America, Madison, WI, USA, pp.377–382.
Blake, G.R. and Hartge, K.H. (1986b) ‘Bulk density’, in Klute, A. (Ed.): Methods of Soil Analysis, Part 1. Physical and Mineralogical Methods, American Society of Agronomy – Soil Science Society of America, Madison, WI, USA, pp.363–375.
BNQ (1997) Organic Soil Conditioners – Composts – Certification Protocol (0143-205) 21. Obtained through the internet: http://www-es.criq.qc.ca/pls/owa_es/bnqw_norme_rech.crit_ rech?p_lang=en [Accessed 15 May 2009].
Boeckx, P. and Van Cleemput, O. (1996) ‘Methane oxidation in a neutral landfill cover soil: influence of moisture content, temperature, and nitrogen-turnover’, Journal of Environmental Quality, Vol. 25, pp.178–183.
Börjesson, G., Samuelsson, J. and Chanton, J. (2007) ‘Methane oxidation in Swedish landfills quantified with the stable carbon isotope technique in combination with an optical method for emitted methane’, Environmental Science & Technology, Vol. 41, pp.6684–6690.
Cabral, A.R., Capanema, M.A., Gebert, J., Moreira, J.F. and Jugnia, L-B. (2010) ‘Quantifying microbial methane oxidation efficiencies in two experimental landfill biocovers using stable isotopes’, Water, Air, and Soil Pollution, Vol. 209, pp.157–172.
Czepiel, P.M., Mosher, B., Crill, P.M. and Harriss, R.C. (1996) ‘Quantifying the effect of oxidation on landfill methane emissions’, Journal of Geophysical Research, Vol. 101, No. D11, pp.16,721–16,729.
De Visscher, A. and Van Cleemput, O. (2003) ‘Simulation model for gas diffusion and methane oxidation in landfill cover soils’, Waste Management, Vol. 23, pp.581–591.
Environment Canada (2007) National Inventory Report 1990–2005, Greenhouse Gas Sources and Sinks in Canada, The Canadian Government’s Submission to the UN Framework Convention on Climate Change, Obtained through the internet: http://www.ec.gc.ca/pdb/ghg/ inventory_report/2005_report/2005_report_e.pdf [Accessed 14 May 2009].
Gebert, J., Groengroeft, A. and Miehlich, G. (2003) ‘Kinetics of microbial landfill methane oxidation in biofilters’, Waste Management, Vol. 23, pp.609–619.
Gomez, K.E., Gonzalez-Gil, G., Lazzaro, A. and Schroth, M.H. (2009) ‘Quantifying methane oxidation in a landfill-cover soil by gas push-pull tests’, Waste Management, Vol. 29, No. 9, pp.2518–2526.
Gonzalez-Gil, G., Schroth, M.H., Gomez, K.E., Papritz, A. and Zeyer, J. (2008) ‘Diffusional and microbial isotope fractionation of methane during gas push-pull tests’, Geochimica et Cosmochimica Acta, Vol. 72, No. 8, pp.2115–2124.
Hilger, H. and Humer, M. (2003) ‘Biotic landfill cover treatments for mitigating methane emissions’, Environmental Monitoring and Assessment, Vol. 84, pp.71–84.
Huber-Humer, M., Gebert, J. and Hilger, H. (2008) ‘Biotic systems to mitigate landfill methane emissions’, Waste Management and Research, Vol. 26, pp.33–46.
Humer, M. and Lechner, P. (1999) ‘Alternative approach to the elimination of greenhouse gases from old landfills’, Waste Management and Research, Vol. 17, pp.443–452.
IPCC (2007a) Climate Change 2007: The Physical Science Basis. Contribution of Working Groupe I to the Fourth Assessment Report of the Intergovernmental Panel on Climate Change, in Solomon, S., Qin, D., Manning, M., Chen, Z., Marquis, M., Averyt, K.B., Tignor, M. and Miller, H.L. (Eds.): Cambridge University Press, Cambridge, United Kingdom and New York, NY, USA, p.212.
IPCC (2007b) Summary for Policymakers, Climate Change 2007: Mitigation, Contribution of Working Group III to the Fourth Assessment Report of the Intergovernmental Panel on Climate Change, in Metz, B., Davidson, O.R., Bosch, P.R., Dave, R. and Meyer, L.A. (Eds.): Cambridge University Press, Cambridge, United Kingdom and New York, NY, USA, p.10.
Jugnia, L-B., Cabral, A.R. and Greer, C.W. (2008) ‘Biotic methane oxidation within an instrumented experimental landfill cover’, Ecological Engineering, Vol. 33, No. 2, pp.102–109.
Jury, W.A. and Horton, R. (2004) Soil Physics, John Wiley & Sons Inc., New York.
Kjeldsen, P. (1996) ‘Landfill gas migration in soil. Chapter 3.1’, in Christensen, T.H., Cossu, R. and Stegmann, R. (Eds.): Landfilling of Waste: Biogas, E & FN Spon, London, GB, pp.87–132.
Klute, A. (1986) ‘Water retention: laboratory methods’, in Klute, A. (Ed.): Methods of Soil Analysis, Part 1. Physical and Mineralogical Methods, American Society of Agronomy – Soil Science Society of America, Madison, WI, USA, pp.635–662.
Mahieu, K., De Visscher, A., Vanrolleghem, P.A. and Van Cleemput, O. (2008) ‘Modelling of stable isotope fractionation by methane oxidation and diffusion in landfill cover soils’, Waste Management, Vol. 28, pp.1535–1542.
Marrero, T.R. and Mason, E.A. (1972) ‘Gaseous diffusion coefficients’, J. Phys. Chem. Ref. Data, Vol. 1, No. 1, pp.3–118.
Metcalfe, D.E. and Farquhar, G.J. (1987) ‘Modeling gas migration through unsaturated soils from waste disposal sites’, Water, Air, and Soil Pollution, Vol. 32, pp.247–259.
Millington, R.J. and Quirk, J.P. (1961) ‘Permeability of porous solids’, Transactions of the Faraday Society, Vol. 57, pp.1200–1207.
Moldrup, P., Olesen, T., Yoshikawa, S., Komatsu, T. and Rolston, D.E. (2005) ‘Predictive-descriptive models for gas and solute diffusion coefficients in variably saturated porous media coupled to pore-size distribution: I. Gas diffusivity in repacked soil’, Soil Science, Vol. 170, No. 11, pp.843–853.
Rannaud, D., Cabral, A. and Allaire, S.E. (2009) ‘Modeling methane migration and oxidation in landfill cover materials with TOUGH2-LGM’, Water Air Soil Pollution, Vol. 198, pp.253–267.
Reay, D.S., Nedwell, D.B. and McNamara, N. (2001) ‘Physical determinants of methane oxidation capacity in a temperate soil’, Water, Air, and Soil Pollution: Focus, Vol. 1, pp.401–414. Roberts, R.C. (1972) ‘Molecular diffusion of gases’, in Gray, D.E. (Ed.): American Institute of
Physics Handbook, McGraw-Hill Book Company, New York, pp.2-249–2-252.
Rolston, D.E. (1986) ‘Gas diffusivity’, in Klute, A. (Ed.): Methods of Soil Analysis, Part 1. Physical and Mineralogical Methods, American Society of Agronomy – Soil Science Society of America, Madison, WI, USA, pp.1089–1102.
SAS (2002–2003) SAS-stat Software, Version 9.1, SAS Institute Inc., Cary, NC, USA.
Scharff, H. and Jacobs, J. (2006) ‘Applying guidance for methane emission estimation for landfills’, Waste Management, Vol. 26, pp.417–429.
Spokas, K., Bogner, J., Chanton, J.P., Morcet, M., Aran, C., Graff, C., Moreau-Le Golvan, Y. and Hebe, I. (2006) ‘Methane mass balance at three landfill sites: What is the efficiency of capture by gas collection systems?’, Waste Management, Vol. 26, pp.516–525.
Stein, V.B., Hettiaratchi, J.P.A. and Achari, G. (2001) ‘Numerical model for biological oxidation and migration of methane in soils’, Practice Periodical of Hazardous, Toxic and Radioactive Waste Management, Vol. 5, No. 4, pp.225–234.
Stępniewski, W. and Zygmunt, M. (2000) ‘Methane oxidation in homogenous soil covers of landfills: a finite-element analysis of the influence of gas diffusion coefficient’, International Agrophysics, Vol. 14, pp.448–455.
Urmann, K., Gonzalez-Gil, G., Schroth, M.H., Hofer, M. and Zeyer, J. (2005) ‘New field method: gas push-pull test for the in-situ quantification of microbial activities in the vadose zone’, Environmental Science & Technology, Vol. 39, No. 1, pp.304–310.
US Environmental Protection Agency (2009) Inventory of US Greenhouse Gas Emissions and Sinks: 1990–2007, Chapter 8: Waste, EPA 430-R-09-004, Obtained through the internet: http://www.epa.gov/climatechange/emissions/downloads09/Waste.pdf [Accessed 14 May 2009].
Whalen, S.C., Reeburgh, W.S. and Sandbeck, K.A. (1990) ‘Rapid methane oxidation in a landfill cover soil’, Applied and Environmental Microbiology, Vol. 56, No. 11, pp.3405–3411.