Field-scale labelling and activity quantification of
methane-oxidizing bacteria in a landfill-cover soil
Ruth Henneberger1, Eleonora Chiri1, Jan Blees2, Helge Niemann2, Moritz F. Lehmann2&
Martin H. Schroth1
1Institute of Biogeochemistry and Pollutant Dynamics, ETH Zurich, Zurich, Switzerland; and2Department of Environmental Sciences, University of
Basel, Basel, Switzerland
Correspondence: Martin H. Schroth, Institute of Biogeochemistry and Pollutant Dynamics, ETH Zurich, Universita¨tstr. 16, CH-8092 Zurich, Switzerland. Tel.: +41 44 6336039; fax: +41 44 6331122; e-mail: martin.schroth@env.ethz.ch Received 7 June 2012; revised 15 August 2012; accepted 18 August 2012.
Final version published online 19 September 2012.
DOI: 10.1111/j.1574-6941.2012.01477.x Editor: Tillmann Lueders
Keywords
gas push-pull test; stable isotope probing; phospholipid ester-linked fatty acids;
methanotrophs;in situ labelling.
Abstract
Aerobic methane-oxidizing bacteria (MOB) play an important role in soils, mitigating emissions of the greenhouse gas methane (CH4) to the atmosphere.
Here, we combined stable isotope probing on MOB-specific phospholipid fatty acids (PLFA-SIP) with field-based gas push-pull tests (GPPTs). This novel approach (SIP-GPPT) was tested in a landfill-cover soil at four locations with different MOB activity. Potential oxidation rates derived from regular- and SIP-GPPTs agreed well and ranged from 0.2 to 52.8 mmol CH4 (L soil
air) 1day 1. PLFA profiles of soil extracts mainly contained C14 to C18 fatty
acids (FAs), with a dominance of C16 FAs. Uptake of 13C into MOB biomass
during SIP-GPPTs was clearly indicated by increased d13C values (up to c. 1500&) of MOB-characteristic FAs. In addition, 13
C incorporation increased with CH4 oxidation rates. In general, FAs C14:0, C16:1x8, C16:1x7 and C16:1x6
(type I MOB) showed highest13C incorporation, while substantial13C incorpo-ration into FAs C18:1x8and C18:1x7(type II MOB) was only observed at
high-activity locations. Our findings demonstrate the applicability of the SIP-GPPT approach for in situ quantification of potential CH4oxidation rates and
simul-taneous labelling of active MOB, suggesting a dominance of type I MOB over type II MOB in the CH4-oxidizing community in this landfill-cover soil.
Introduction
Methane (CH4) is a potent greenhouse gas contributing
strongly to global warming (Denman et al., 2007). Aerobic methane-oxidizing bacteria (MOB) use CH4 as the sole
source of carbon and energy, thereby reducing CH4 flux
from various methanogenic environments to the atmo-sphere, for example, from wetlands, rice paddies and anoxic sediments. In addition, cover soils of CH4-producing,
municipal-waste landfills often harbour highly diverse and active MOB communities (Chen et al., 2007; Gebert et al., 2009; Kumaresan et al., 2009; Henneberger et al., 2012). Based on the current understanding, most MOB can be placed either within the phylum Proteobacteria or the phylum Verrucomicrobia (Murrell, 2010). The latter MOB are a recently discovered group of thermo-acido-philic methane-oxidizing Verrucomicrobia (see review by Op den Camp et al., 2009), but they are yet to be taxo-nomically validated. The methane-oxidizing members of
the Proteobacteria comprise two major groups: type I and type II MOB, belonging to Gammaproteobacteria and Alphaproteobacteria, respectively. The two groups differ not only in their phylogenetic affiliation, but also with respect to their biochemical and physiological properties, such as carbon assimilation pathway and cellular mem-brane structure (Hanson & Hanson, 1996; Murrell, 2010). Because these microorganisms are significant modula-tors of global CH4 emissions, MOB diversity, abundance
and activity for various environments have been studied to great extent under laboratory conditions and in natural settings. Such studies generally focus on the pmoA gene, which encodes a subunit of the particulate methane monooxygenase (pMMO), a key enzyme in the aerobic CH4oxidation pathway (Hanson & Hanson, 1996).
More-over, the phylogeny of the pmoA gene correlates well with the 16S rRNA gene (Kolb et al., 2003). In addition to pmoA-based phylogeny, the proteobacterial MOB can also be differentiated to a certain degree based on the chemical
MICR
composition of their cellular membranes, for instance the distribution of phospholipid ester-linked fatty acids (PLFA). Fatty acid (FA) profiles of type I MOB mem-branes are generally dominated by C14and C16FAs, while
type II MOB membranes contain a larger portion of C18
FAs (Bowman et al., 1991; Hanson & Hanson, 1996; Nie-mann et al., 2006). In particular, the C16 FA C16:1x5t is
considered to be characteristic for type I MOB, while the C18FAs C18:1x8c, C18:2x7c,12cand C18:2x6c,12care
character-istic for type II MOBs (Bowman et al., 1991; Hanson & Hanson, 1996; Bowman, 2006; Bodelier et al., 2009). Distinctive PLFA profiles of different groups can be exploited to link MOB function with community structure by following the incorporation of isotopic tracers (e.g.13C) into the biomass (i.e. into FAs) of active MOB. In fact, the first reported application of PLFA stable isotope probing (SIP) was the use of 13C-labelled CH4to
identify active MOB (Boschker et al., 1998).
Since then, SIP methodologies have evolved and are now widely applied to study active subpopulations of complex microbial communities (Neufeld et al., 2007). For example, PLFA-SIP using 13CH4 has been used to
investigate active MOB in samples derived from various soil and sediment environments (Knief et al., 2003; Chen et al., 2008; Shrestha et al., 2008). Such incubation exper-iments have provided valuable insights into ecological aspects of MOB communities, for example the influence of CH4availability (Knief et al., 2006), nitrogen
fertiliza-tion (Mohanty et al., 2006) or flooding regimes (Bodelier et al., 2012) on the structure and activity of MOB popu-lations. However, reports on the application of this tech-nique to landfill-cover soils are scarce (Crossman et al., 2004). In addition, PLFA-SIP studies were generally per-formed under controlled laboratory conditions that may vary significantly from natural habitats, thus hindering direct extrapolation of the results back to the field.
Few studies have applied SIP directly in the field (Mid-dleburg et al., 2000; Padmanabhan et al., 2003). For example, Pombo et al. (2002, 2005) used aqueous push-pull tests in combination with PLFA-SIP in a petroleum-contaminated aquifer to identify dominant nitrate- and sulphate-reducing bacteria while simultaneously determin-ing their activity. Recently, the push-pull test technique was modified for gaseous substrates (Urmann et al., 2005). During such a gas push-pull test (GPPT), a mixture of reactive gases (e.g. CH4and O2) and nonreactive tracer
gases (e.g. Ar, Ne or He) is injected into the soil at a loca-tion of interest. After injecloca-tion, the gas flow is reversed and the soil-air-diluted gas mixture is extracted from the same location and sampled periodically. Reaction rate constants can subsequently be derived from differences in the breakthrough curves of the reactant and a suitable tra-cer gas (Urmann et al., 2008; Go´mez et al., 2009). GPPTs
have been applied successfully to quantify CH4 oxidation
in a variety of pristine and anthropogenically influenced environments, such as peat bog, the vadose zone above a contaminated methanogenic aquifer or a landfill-cover soil (Urmann et al., 2007, 2008; Go´mez et al., 2009; Henne-berger et al., 2012). Nevertheless, the combination of the GPPT technique with PLFA-SIP has not been attempted for a field-based study.
The aim of the present work was to develop an efficient methodology that enables labelling of active MOB at the field scale while simultaneously quantifying in situ CH4 oxidation rates. The novel approach
pre-sented here combines 13CH4 PLFA-SIP with the GPPT
technique. We applied this method to the cover soil of a Swiss landfill and tested its applicability at four locations with differences in CH4oxidation activity.
Material and methods
Study site
All sampling and field-based studies were performed at the Lindenstock landfill (Liestal, BL, Switzerland), which has been described in detail elsewhere (Henneberger et al., 2012; Schroth et al., 2012). Experiments were car-ried out in August and September 2011 at five locations that are in close proximity to locations C1, EM and NM, previously described and characterized for their MOB diversity and activity (Henneberger et al., 2012). During summer 2010, these locations exhibited differences in CH4 oxidation rates with the highest apparent first-order
rate constant (k; for details on calculations see below) measured at C1 (4.69 h 1), followed by EM (0.52 h 1) and NM (0.16 h 1). We termed the locations for the present study C1-1, C1-2, C1-3, EM-1 and NM-1 according to their proximity to the previously described locations (within c. 100–250 cm).
Soil properties
Soil temperature was recorded throughout the study period at 50 cm depth in 3-h intervals, using Thermochron iButton dataloggers (DS1921G#F50; Maxim, Sunnyvale, CA) that were installed near locations C1 and NM. Volumetric water content was determined by time-domain reflectometry (TDR100; Campbell Scientific, Loughborough, UK), using brass-rod pairs (15 mm o.d., 70 cm long) previously installed close to locations C1, EM and NM.
Borehole installation and soil sample collection Soil cores were collected using a HUMAX hollow-stem auger system (80 mm i.d.; Martin Burch AG, Rothenburg,
Switzerland). At each location, we drilled to a depth of c. 55 cm, and soil core samples were collected in plastic sleeves from 45 to 55 cm depth. For subsequent GPPTs, Teflon tubes (2 mm i.d.) were inserted into the borehole to reach down to 50 cm depth. The tubes were protected from particulate clogging by covering the tips with steel wool, and the lower end of the tube was embedded in c. 10 cm of sand (45–55 cm depth; 0.7–1.2 mm Quartz sand; Carlo Bernasconi AG, Zu¨rich, Switzerland). The borehole was subsequently backfilled with a 1 : 1 mixture of sand and commercially available Bentonite (Fatto, Migros, Switzerland), followed by a final 5 cm of Benton-ite to ground level. The exposed ends of the tubes were fitted with three-way valves. Location C1-3, which served as reference, was backfilled as described above, but with-out installation of a Teflon tube.
Approximately 24 h after performing GPPTs with
13
CH4 (hereafter referred to as SIP-GPPT), an area of
c. 509 50 cm was excavated to a depth of 45 cm. The sand in the final 10 cm of the borehole was removed, and soil material for further analyses was collected from 45 to 55 cm depth along the rim of the bore hole using sterile tools.
All soil samples collected during initial drilling and exca-vation after SIP-GPPTs were homogenized and subsampled immediately on site with sterile spatulas and transferred to sterile aluminium foil. Samples were stored on ice for several hours and frozen at -20°C upon return to the laboratory.
Gas push-pull tests
The GPPTs performed at locations C1-1, C1-2, EM-1 and NM-1 were slightly modified from recently described methods (Urmann et al., 2005; Go´mez et al., 2009; Henneberger et al., 2012). Regular GPPTs were performed 5–6 days after installation of the tubes, using c. 20 L of gas mixture containing 2 vol.% CH4, 18 vol.% O2 and
26.7 vol.% each of helium (He), neon (Ne) and argon (Ar). The gas mixture was injected into the soil at 50 cm depth over a period of 30 min at a flow rate of c. 0.63 L min 1. Following injection, the gas flow was reversed and the gas mixture diluted with soil air was extracted from the same location for 30 min at c. 0.58 L min 1 flow rate (corresponding to a total volume of c. 17 L). For gas concentration analysis, two soil-air background samples were collected prior to injection, three samples of the gas mixture were collected during injection (at 10-min intervals), and during extraction, samples were taken every 2 min. All gas samples were collected in 20-mL glass vials (sealed with butyl rubber septa and metal crimp caps) after flushing the vials with at least 500 mL of the respective gas using an inflow and
an outflow needle. During extraction, gas exiting the out-flow needle was vented into the atmosphere.
SIP-GPPTs were performed 2–3 weeks after tube instal-lation at locations C1-1, EM-1 and NM-1, using c. 21– 22 L of gas mixture containing 5 vol.% 13CH4, 20 vol.%
O2 and 25 vol.% each of He, Ne and Ar. At location
C1-2, the following gas mixture was used: 2 vol.%13CH4,
18 vol.% O2 and 26.7 vol.% each of He, Ne and Ar. Gas
samples were collected during the injection and extraction phase in similar fashion as before. However, gas exiting the vials’ outflow needle during extraction was collected in the original gas-bag and, upon completion of each SIP-GPPT, re-injected slowly into the soil over a period of c. 100–105 min to allow further oxidation of 13
CH4
and therefore additional 13C incorporation after comple-tion of the GPPT.
For regular and SIP-GPPTs, kinetic parameters of CH4
oxidation (apparent first-order rate constants k, potential CH4oxidation rates) were estimated from extraction data
using a simplified method as previously described (Schroth & Istok, 2006; Urmann et al., 2008; Go´mez et al., 2009). Briefly, for each extracted sample, the natu-ral logarithm of the relative concentration (extracted con-centration divided by injected concon-centration, corrected for natural background) of CH4 divided by the relative
concentration of a tracer (here Ar) is plotted against the gas mixture’s residence time in the soil. The negative slope of the linear regression was taken as apparent first-order rate constant k, characterizing indigenous CH4
oxidation for variable CH4-limited conditions. Thus, these
k values represent averages over the entire data set assum-ing first-order kinetics. For direct comparison of activity, potential oxidation rates were subsequently calculated for a CH4concentration of 0.5 vol.% (a concentration observed
in extracted samples of most GPPTs). Values of k used in these calculations were determined from a subset of sam-ples near 0.5 vol.% CH4 to more accurately describe the
reaction kinetics at that concentration.
Fatty acid extraction and preparation of derivates
The extraction procedure and preparation of fatty acid methyl esters (FAME) was carried out according to previ-ously described methods (Elvert et al., 2003; Niemann et al., 2005). Briefly, total lipid extracts were obtained from c. 20 g of wet soil by subsequent ultrasonication with organic solvents of decreasing polarity [dichloromethane/ methanol (1 : 2, v/v), dichloromethane/methanol (2 : 1, v / v), dichloromethane]. An internal standard (FA n-C19:0)
with known concentration andd13C value was added to the soil sample prior to extraction. FA glycerol esters constitut-ing glycolipids and phospholipids were cleaved by
saponifi-cation with methanolic KOH solution. FAs were methylat-ed with methanolic BF3solution yielding FAMEs.
Double-bond positions of monounsaturated FAs were determined by the analysis of dimethyl disulphide adducts (Nichols et al., 1986; Moss & Lambertfair, 1989).
Analysis of gas samples
Samples collected during GPPTs were analysed by gas chro-matography (GC) using a Thermo Scientific TRACE GC Ultra gas chromatograph. Gas contents for Ar, Ne, He and O2 were separated over a PLOT Molsieve 5A column
(50 m9 0.53 mm i.d., 50 lm df; held isothermally at 30 °C; Varian, Palo Alto, CA), using H2 as carrier gas
(22 mL min 1), and quantified with a thermal conductivity detector. Methane was separated over a packed steel column (2 m long, 1/16″ o.d., 1 mm i.d.; packed with Porapak N 100/120 mesh) using N2as carrier gas (3.2 mL min 1) and
quantified by flame ionization detection (FID).
Analysis of fatty acids
FAs were identified, quantified and analysed for their stable carbon isotope composition using GC quadrupole mass spectrometry (GC-MS), GC-FID and GC-isotope-ratio mass spectrometry (GC-IRMS), respectively. GC was performed using a Thermo Scientific TRACE GC Ultra gas chromatograph equipped with a split/splitless injector and a 60-m apolar DB-5 ms fused silica column (0.25 mm i.d., 0.25 lm df). FAMEs were injected in split-less mode at 300°C using He as a carrier gas at a constant flow rate of 1.2 mL min 1. The initial oven temperature was set to 50°C for 2 min, increased to 150 °C (10 °C min 1) and finally raised to 300°C at a rate of 4°C min 1 with a final hold time of 30 min. Mass spectra of single lipid compounds were acquired using a Thermo Scientific DSQ II quadrupole mass
spec-trometer operated in electrospray ionization mode. The resulting mass spectra were compared to standard compounds and published data for identification. Com-pound-specific stable carbon isotope ratio measurements were performed using a Thermo Scientific DELTA V IRMS. Isotope ratios are given in thed-notation (against Vienna Pee Dee Belemnite (VPDB)]. The FA d13C values were corrected for the introduction of additional carbon atoms during derivatization. The internal standard was used to monitor precision and reproducibility during measurements. Reported d13C values have an analytical
precision of± 1&.
Results
MOB activity
MOB activity at locations C1-1, C1-2, EM-1 and NM-1 was assessed through regular GPPTs, using 2 vol.% nonlabelled CH4 in the injected gas mixture. Logarithmic
rate plots were reasonably linear over the entire data sets, indicating apparent first-order kinetics of the CH4
oxida-tion reacoxida-tion (representative rate plots of two locaoxida-tions shown in Supporting Information, Fig. S1). Deduced k values ranged from 0.10 h 1 at location NM-1 to 8.43 h 1 at location C1-1 (Table 1). Moreover, C1-1 and C1-2 showed the highest potential CH4 oxidation rates
(activity at 0.5 vol.% CH4) with 46.0 and 55.7 mmol CH4
(L soil air) 1 day 1, respectively, while considerably lower rates were observed at EM-1 [9.9 mmol CH4
(L soil air) 1 day 1] and NM-1 [0.7 mmol CH4
(L soil air) 1 day 1; Table 1].
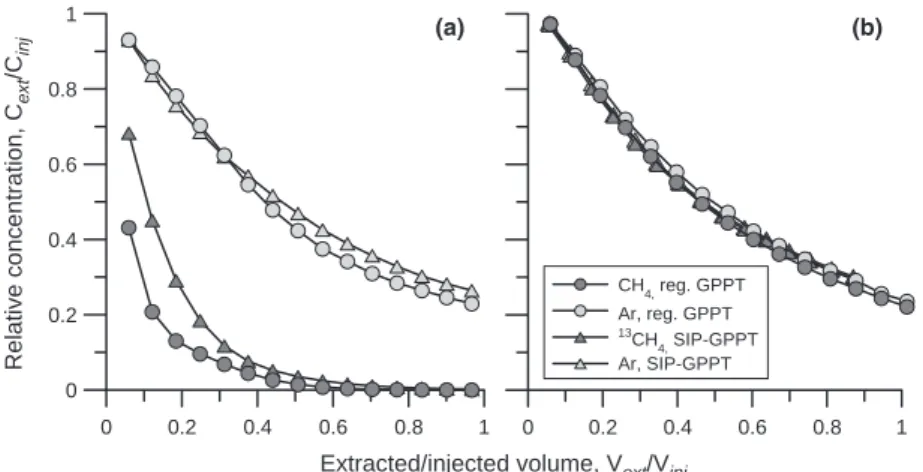
SIP-GPPTs were performed with 5 vol.%13CH4 within
2–3 weeks after tube installation. Breakthrough curves and logarithmic rate plots were similar to those observed during regular GPPTs (representative breakthrough curves of two locations shown in Fig. 1; rate plots in Fig. S1),
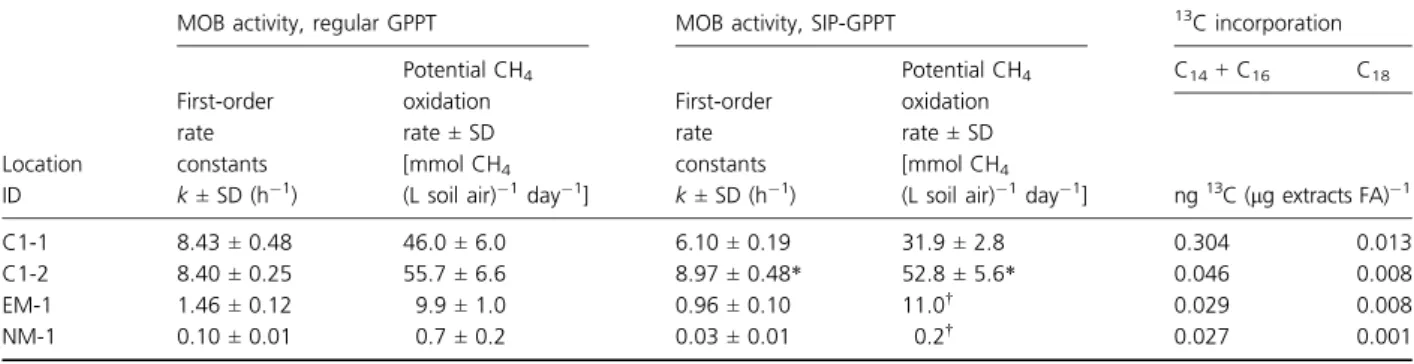
Table 1. Activity of MOB in the Lindenstock landfill-cover soil determined at four different locations, using 2 vol.% CH4(regular GPPT) or 5 vol.%
13
CH4(SIP-GPPT). In addition, absolute13C incorporation into C14+ C16FAs (dominating type I MOB PLFA profiles) and C18FAs (dominating type
II MOB PLFA profiles) is shown
Location ID
MOB activity, regular GPPT MOB activity, SIP-GPPT 13C incorporation
First-order rate constants k ± SD (h 1) Potential CH4 oxidation rate± SD [mmol CH4
(L soil air) 1day 1]
First-order rate constants k ± SD (h 1) Potential CH4 oxidation rate± SD [mmol CH4
(L soil air) 1day 1]
C14+ C16 C18 ng13 C (lg extracts FA) 1 C1-1 8.43± 0.48 46.0± 6.0 6.10± 0.19 31.9± 2.8 0.304 0.013 C1-2 8.40± 0.25 55.7± 6.6 8.97± 0.48* 52.8± 5.6* 0.046 0.008 EM-1 1.46± 0.12 9.9± 1.0 0.96± 0.10 11.0† 0.029 0.008 NM-1 0.10± 0.01 0.7± 0.2 0.03± 0.01 0.2† 0.027 0.001
*SIP-GPPT done with 2 vol.% CH4.
and resulting k values ranged from 0.03 h 1 at location NM-1 to 6.10 h 1 at location C1-1 (Table 1). Based on the high CH4 oxidation rate determined from regular
GPPT at location C1-2, only 2 vol.% 13CH4 was applied
during SIP-GPPT at this location, and the resulting k value was 8.97 h 1. Potential CH
4 oxidation rates were
31.9 and 52.8 mmol CH4 (L soil air) 1 day 1 for C1-1
and C1-2, respectively. For locations EM-1 and NM-1, MOB activity was too low to reach concentrations of around 0.5 vol.% CH4 during the extraction phase under
the prevailing test conditions (5 vol.% 13CH4 injection
concentration). Potential oxidation rates therefore were estimated by extrapolating the experimental data, and values were similar to those observed during regular GPPTs (Table 1; Schroth et al., 2012).
Methane concentrations measured in the soil-air back-ground samples were low during the study period and comparable between the different locations, ranging from 49 10 4 vol.% (C1-2 and EM-1) to 99 10 4 vol.% (C1-1) during regular GPPTs and from 9 9 10 4 vol.%
(EM-1) to 44 9 10 4 vol.% (NM-1) during SIP-GPPTs.
During the time period activity measurements were carried out, soil temperatures at 50 cm depths were 18.5– 19°C (near location C1) and 17–17.5 °C (near location NM-1). The average volumetric water content of the 0- to 70-cm depth interval close to C1 showed only slight variations (0.24–0.26), and this value was constantly around 0.40 close to EM-1. Volumetric water content close to NM-1 varied from 0.35 at the date of tube instal-lation to 0.19 at the date of final sample collection. Therefore, conditions varied only slightly throughout the study period and were similar to those observed during the 2010 campaign (Henneberger et al., 2012).
Fatty acid composition
All sample extracts analysed contained substantial amounts of FAs, typically in the range of C14 to C18
(representative example of a partial GC-MS chromato-gram shown in Fig. S2). The fractional abundance of selected FAs (C14–C18) at the reference location C1-3
(Fig. 2) and high-activity locations C1-1 and C1-2 (Fig. 3a and b) showed some similarities. Six dominant FAs (C16:1x7, C16:1x5, C16:0, C18:1x9, C18:1x7 and C18:0)
were identified in all samples from these locations, with C16:1x5 and C16:0 being the most abundant (13–23% of
total C14–C18 FAs). Relative abundance of the remaining
15 minor FAs detected in these samples was also similar. However, the C1-3 samples lacked any detectable contri-bution from FA C18:1x8. FA composition of samples
collected at the intermediate- and low-activity locations (EM-1 and NM-1) showed some differences to the
0 0.2 0.4 0.6 0.8 1
Extracted/injected volume, Vext/Vinj
0 0.2 0.4 0.6 0.8 1 Relative concentration, C ext /C inj CH 4, reg. GPPT Ar, reg. GPPT 13CH 4, SIP-GPPT Ar, SIP-GPPT 0 0.2 0.4 0.6 0.8 1 (a) (b)
Fig. 1. Representative breakthrough curves of
CH4/13CH4(dark grey symbols) and Ar (light
grey symbols) observed during GPPTs at locations C1-1 (a) and NM-1 (b): circles symbolizing regular GPPTs with 2 vol.% CH4 injection concentration, and triangles
symbolizing SIP-GPPTs with 5 vol.%13CH4
injection concentration. 0 5 10 15 20 25 30 35 40 Fractional FA abundance (%) –100 –50 0 50 100 150 200 250 1000 1250 1500 1750 δ 13C (‰) C14:0 iC15:0 aiC15:0 C15:0 10Me-C16:0 C16:1w9 C16:1w8 C16:1w7 C16:1w6 C16:1w5 C16:0 iC17:0 aiC17:0 C17:1w8 C17:0cy C17:0 C18:2 C18:1w9 C18:1w8 C18:1w7 C18:0 FA
Fig. 2. Fractional abundance (lefty-axis, bars) and d13C values (right
y-axis, circles and triangles) of individual FAs extracted from reference location C1-3 at the beginning (light grey bars and circles) and end (dark grey bars and triangles) of the field study.
high-activity locations. While a dominance of the FAs C16:1x7, C16:1x5, C16:0, C18:1x9 and C18:0was also observed
in these sample extracts, their relative abundances differed from those detected at the high-activity locations (Fig. 3c and d). In addition, all other FAs in these samples were either present at very low concentrations, were detectable but could not be reliably quantified due to insufficient GC separation (in particular FAs C16:1x8 and C16:1x9), or
were fully undetectable. Some differences in FA abundance were observed between samples taken at the same location before regular GPPTs and after SIP-GPPTs. These differ-ences can be explained by substantial soil heterogeneity that was noticed at the different locations, in particular as sample collection after SIP-GPPTs was performed several cm away from the initial sampling point.
13C labelling of fatty acids
The introduction of13CH4 during SIP-GPPTs led to the
incorporation of 13C into several FAs, as indicated by their increasedd13C values relative to natural background values of -21& to -62& (as determined for FAs extracted from the reference location and all other locations prior to GPPTs; Figs 2 and 3). Incorporation of 13C into bio-mass therefore appeared to increase with increasing MOB activity, as shown by higherd13C values detected at high-activity locations compared to low-high-activity locations (Fig. 3), and by increasing total 13C incorporation (Table 1). The lower level of 13C incorporation despite higher CH4 oxidation activity observed for location C1-2
compared to C1-1 was likely caused by the lower
0 5 10 15 20 25 30 35 40 Fractional FA abundance (%) –100 –50 0 50 100 150 200 250 1000 1250 1500 1750 0 5 10 15 20 25 30 35 40 Fractional FA abundance (%) C14:0 iC15:0 aiC15:0 C15:0 10Me-C16:0 C16:1w9 C16:1w8 C16:1w7 C16:1w6 C16:1w5 C16:0 iC17:0 aiC17:0 C17:1w8 C17:0cy C17:0 C18:2 C18:1w9 C18:1w8 C18:1w7 C18:0 FA –100 –50 0 50 100 150 200 250 1000 1250 1500 1750 δ 13 C (‰) δ 13 C (‰) C14:0 iC15:0 aiC15:0 C15:0 10Me-C16:0 C16:1w9 C16:1w8 C16:1w7 C16:1w6 C16:1w5 C16:0 iC17:0 aiC17:0 C17:1w8 C17:0cy C17:0 C18:2 C18:1w9 C18:1w8 C18:1w7 C18:0 FA (a) (b) (c) (d)
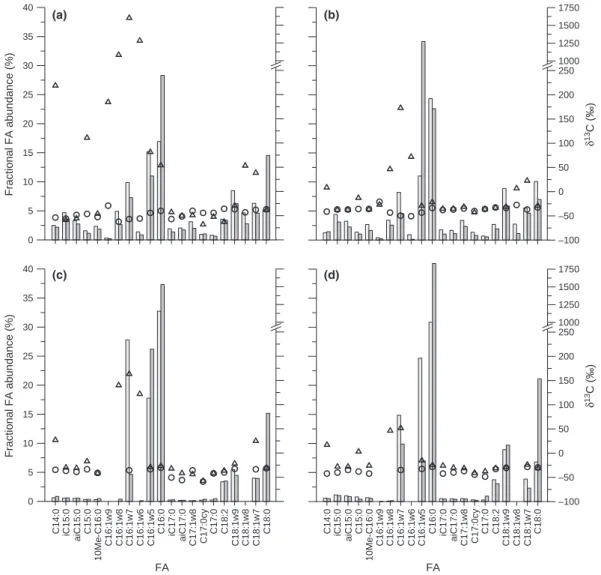
Fig. 3. Fractional abundance (lefty-axis, bars) and d13C values (righty-axis, circles and triangles) of individual FAs extracted prior to regular
GPPTs (light grey bars and circles) and after SIP-GPPTs (dark grey bars and triangles). (a) location C1-1, (b) location C1-2, (c) location EM-1,
(d) location NM-1. For location C1-1 (a), d13
concentration of 13CH4 applied during this SIP-GPPT
(2 vs. 5 vol.%13CH4).
In addition to differences in the amount of 13C incor-poration observed, the varying levels of activity at the different locations seemed to be associated with differences in the FA labelling patterns. In general, at all locations, the most pronounced 13C incorporation (i.e. highest d13C values) was found for the FAs C14:0,
C15:0, C16:1x8, C16:1x7 and C16:1x6. The high-activity
locations (C1-1 and C1-2) and the intermediate-activity location (EM-1) also showed clear incorporation of 13C
into the FAs C18:1x7 and C18:1x8 (not detected at EM-1).
This stands in contrast to observations made for the low-activity location NM-1, which displayed only a slight increase in d13C for FA C18:1x7. In addition, at the two
high-activity locations,13C label was recovered in the FAs C16:1x5, C16:0 (C1-1 and C1-2) and C16:1x9 (C1-1 only),
while these FAs were not labelled at the other two loca-tions. At the reference location C1-3, where no GPPTs were performed, no enrichment in13C was detected, indi-cating the absence of natural fluctuations in d13C values throughout the study period (Fig. 2).
Injection of 5 vol.%13CH4during the SIP-GPPT at the
high-activity location C1-1 resulted in very high d13C values (> 1000&) for the FAs C16:1x8, C16:1x7 and
C16:1x6. The high 13C label content in these FAs had a
biasing effect on the overall GC-IRMS performance, particularly for FAs with lower or no 13C label content due to baseline shifting. Thus, while the results obtained here clearly provide evidence for high incorporation of CH4-derived carbon, absolute d13C values obtained for
C1-1 should be regarded with caution.
Discussion
Stable isotope probing of PLFA represents a widely used tool to identify active members within complex microbial assemblages, and this technique has been routinely used during laboratory experiments on MOB communities from various environments (Knief et al., 2003; Chen et al., 2008; Shrestha et al., 2008). Here, we have success-fully applied PLFA-SIP directly in the field using a modi-fied GPPT approach. This combination of PLFA-SIP with GPPTs allowed the calculation of in situ CH4 oxidation
rates in parallel with isotope tracing of MOB through PLFA profile analysis. The SIP-GPPT was successfully implemented at several locations with differences in MOB activity and was shown to be applicable even at locations with relatively low CH4 turnover rates. Methane
oxida-tion rates at the Lindenstock landfill appeared to be stable over time, and rates observed here were comparable with those detected during previous studies (Go´mez et al., 2009; Henneberger et al., 2012). Moreover, introduction
of the13C label during SIP-GPPTs had no apparent effect on CH4oxidation rates.
SIP approaches are not limited to lipids, but also enable tracking of 13C incorporation into DNA, RNA or proteins (Radajewski et al., 2003; Jehmlich et al., 2010). However, PLFA-SIP appears particularly suitable for field-based studies due to the low level of 13C incorporation into FAs required for detection, the reliable extraction of FAs from soil samples and relatively simple processing of the extracted FAs (Neufeld et al., 2007). It is important to mention that time is critical when gases are applied in the field, as rapid gas diffusion typically precludes long incubation times. Here, we demonstrated that a c. 3-h-long 13CH4 incubation (GPPT and subsequent
re-injection of gas mixture) was adequate for sufficient
13
C incorporation to be detectable by GC-IRMS within the FAs pool. In contrast, RNA-SIP and, in particular, DNA-SIP may require much longer incubation times up to days or weeks (Radajewski et al., 2000; Noll et al., 2008; Martineau et al., 2010; Shrestha et al., 2011). This is because unlike FAs, labelled nucleic acids need to be separated from their nonlabelled counterparts by density gradient centrifugation, requiring a larger label incorporation of at least 20 at.% compared to only 0.1 at.% 13C for FAs (Boschker & Middleburg, 2002; Radajewski et al., 2003).
On the other hand, phylogenetic resolution based on PLFA is lower compared to nucleic acids. To date, most PLFA-SIP studies on MOB communities are limited to distinguishing between type I and type II MOB. In addi-tion, FAs currently considered to be characteristic for cer-tain MOB might also be present in other, newly or yet to be described organisms. For example, FA C16:1x8c was
long regarded as signature lipid for type I MOB, but was recently found to be contained in substantial amount in the type II MOB Methylocystis heyeri (Dedysh et al., 2007). Nevertheless, in-depth studies on PLFA profiles of individual MOB strains, in particular novel isolates, may lead to the identification of novel signature lipids and may increase resolution in future PLFA-SIP studies on complex MOB communities. For example, Bodelier et al. (2009) detected novel and unusual C18:2 FAs in PLFA
profiles of several Methylocystis strains. They also demon-strated that a clear separation of type II MOB at the subgenus level is possible based on their characteristic PLFA profiles and that PLFA profiles of certain type I MOB cluster at the genus level.
In the landfill-cover soil analysed in this study, differ-ences in PLFA profiles and 13C incorporation into MOB signature FAs were observed between locations with contrasting CH4 oxidation activity. Even though 13C
incorporation was only semi-quantitatively related to CH4
oxidation rates, with higher levels of incorporation detected at locations with higher activity, it provided
valuable insights into the dominant, active MOB type at the different locations. In general, the most dominant13C incorporation was observed for FAs typically found in PLFA profiles characteristic for type I MOB. Labelling of FAs typically found in type II MOB was also clearly detected at most locations, but was far less pronounced, particularly at the lower-activity locations EM-1 and NM-1. In fact, the type II MOB-specific FA C18:1x8 was
not detected at these two locations, while type I MOB-characteristic FAs were dominant at all locations. These PLFA-based findings coincide with our previous analyses of the Lindenstock cover soil based on the pmoA gene, which also showed differences in MOB diversity and abundance between locations with different CH4
oxida-tion activities (Henneberger et al., 2012). Similar to the PLFA results, a general dominance of type I MOB-specific pmoA genes was detected in clone libraries and T-RFLP profiles. Type II MOB-specific pmoA genes comprised only a minor fraction of the T-RFLP profiles and were not detected in the clone library constructed from the low-activity location NM. These clear and consistent differ-ences in type I and type II MOB communities at both the DNA and PLFA level suggest that the total (DNA-based study) and active (PLFA-SIP) MOB communities in the Lindenstock landfill-cover are indeed similar. Our results further suggest that CH4 oxidation activity is mainly
car-ried out by type I MOB and supported to a minor degree by type II MOB at locations with increased overall activity. These findings agree with a previous PLFA-SIP study on another loamy landfill-cover soil, where the dominance of type I MOB activity was also observed (Crossman et al., 2004). Nevertheless, at all locations, high13C incorporation was observed for FAs with very low relative abundance, indicating that MOB comprise only a minor portion of the microbial community present at this site, particularly at the lower-activity locations.
The novel SIP-GPPT technique described here repre-sents a promising advance for the labelling of active MOB directly in the field, hence minimizing procedural bias introduced during laboratory-based incubations. Substan-tial13C incorporation into type I and type II MOB signa-ture FAs was observed despite short in situ incubation times, making this gas-phase approach feasible for field applications. Short incubation times most likely led to the lower levels of 13C incorporation observed here in comparison with several laboratory-based studies on MOB communities (e.g. d13C of 6000& reported by Chen et al. (2008); Shrestha et al., 2008). In this study, we attempted to compensate potentially low levels of 13C incorporation due to short incubation times by increasing
13
CH4 injection concentrations (5 vol.% 13CH4 during
SIP-GPPTs compared to 2 vol.% CH4 during regular
GPPTs). However, our results indicate adequate 13C
incorporation into FAs even at low-activity locations, while suggesting that 13CH4 concentration may be
reduced for highly active locations to minimize overall bias during GC-IRMS analysis. In conclusion, the combi-nation of PLFA-SIP with in situ CH4 oxidation rate
measurements employing GPPTs established a link between the structure and function of active MOB communities directly in a landfill-cover soil.
Acknowledgements
The authors would like to thank M. Vogt for help in the field. This work, as part of the European Science Founda-tion EUROCORES Program EuroEEFG, project MECOM-ECON, was supported from funds by the Swiss National Science Foundation (SNSF) under grant no. 31EE30-131170. Additional funding was provided by ETH Zurich.
References
Bodelier PL, Gillisen MJ, Hordijk K, Damste JS, Rijpstra WI, Geenevasen JA & Dunfield PF (2009) A reanalysis of phospholipid fatty acids as ecological biomarkers for methanotrophic bacteria. ISME J 3: 606–617.
Bodelier PLE, Baer-Gilissen MJ, Meima-Franke M & Hordijk K (2012) Structural and functional response of methane-consuming microbial communities to different flooding regimes in riparian soils. Ecol Evol 2: 106–127.
Boschker HTS & Middleburg JJ (2002) Stable isotopes and biomarkers in microbial ecology. FEMS Microbiol Ecol 40: 85–95.
Boschker HTS, Nold SC, Wellsbury P, Bos D, de Graaf W, Pel R, Parkes RJ & Cappenberg TE (1998) Direct linking of microbial populations to specific biogeochemical processes by C-13-labelling of biomarkers. Nature 392: 801–805. Bowman JP (2006) The methanotrophs– the families
Methylococcaceae and Methylocystaceae. The Prokaryotes, 3rd edn (Dworkin M, Falkow S, Rosenberg E, Schleifer K-H & Strackebrandt E, eds), pp. 266–289. Springer, New York, NY.
Bowman JP, Skerratt JH, Nichols PD & Sly LI (1991) Phospholipid fatty-acid and lipopolysaccharide fatty-acid signature lipids in methane-utilizing bacteria. FEMS Microbiol Ecol 85: 15–22.
Chen Y, Dumont MG, Cebron A & Murrell C (2007) Identification of active methanotrophs in a landfill cover soil through detection of expression of 16S rRNA and functional genes. Environ Microbiol 9: 2855–2869. Chen Y, Dumont MG, McNamara NP, Chamberlain PM,
Bodrossy L, Stralis-Pavese N & Murrell C (2008) Diversity of the active methanotrophic community in acidic peatland as assessed by mRNA and SIP-PLFA analyses. Environ Microbiol 10: 446–459.
Crossman ZM, Abraham F & Evershed RP (2004) Stable isotope pulse-chasing and compound specific stable carbon
isotope analysis of phospholipid fatty acids to assess methane oxidizing bacterial populations in landfill cover soils. Environ Sci Technol 38: 1359–1367.
Dedysh SN, Belova SE, Bodelier PLE, Smirnova KV,
Khmelenina VH, Chidthaisong A, Trotsenko YA, Liesack W & Dunfield PF (2007) Methylocystis heyeri sp. nov., a novel type II methanotrophic bacterium possessing “signature” fatty acids of type I methanotrophs. Int J Syst Evol Microbiol 57: 472–479.
Denman KL, Brasseur G, Chidthaisong A et al. (2007) Couplings between changes in the climate system and biogeochemistry. Climate Change 2007: The Physical Science Basis. Contribution of Working Group I to the Fourth Assessment Report of the Intergovernmental Panel on Climate Change (Solomon S, Qin D, Manning M, Chen Z, Marquis M, Averyt KB, Tignor M & Miller HL eds.), pp. 501–587. Cambridge University Press, Cambridge.
Elvert M, Boetius A, Knittel K & Jorgensen B (2003) Characterization of specific membrane fatty acids as chemotaxonomic markers for sulfate-reducing bacteria involved in anaerobic oxidation of methane. Geomicrobiol J 20: 403–419.
Gebert J, Singh BK, Pan Y & Bodrossy L (2009) Activity and structure of methanotrophic communities in landfill cover soils. Environ Microbiol Rep 1: 414–423.
Go´mez KE, Gonzalez-Gil G, Lazzaro A & Schroth MH (2009) Quantifying methane oxidation in a landfill-cover soil by gas push-pull tests. Waste Manag 29: 2518–2526. Hanson RS & Hanson TE (1996) Methanotrophic bacteria.
Microbiol Rev 60: 439–471.
Henneberger R, Lu¨ke C, Mosberger L & Schroth MH (2012) Structure and function of methanotrophic communities in a landfill-cover soil. FEMS Microbiol Ecol 81: 52–65.
Jehmlich N, Schmidt F, Taubert M, Seifert J, Bastida F, von Bergen M, Richnow HH & Vogt C (2010) Protein-based stable isotope probing. Nat Protoc 5: 1957–1966.
Knief C, Lipski A & Dunfield PF (2003) Diversity and activity of methanotrophic bacteria in different upland soils. Appl Environ Microbiol 69: 6703–6714.
Knief C, Kolb S, Bodelier PLE, Lipski A & Dunfield PF (2006) The active methanotrophic community in hydromorphic soils changes in response to changing methane
concentrations. Environ Microbiol 8: 321–333.
Kolb S, Knief C, Stubner S & Conrad R (2003) Quantitative detection of methanotrophs in soil by novel pmoA-targeted real-time PCR assays. Appl Environ Microbiol 69: 2423–2429. Kumaresan D, Abell GCJ, Bodrossy L, Stralis-Pavese N &
Murell C (2009) Spatial and temporal diversity of methanotrophs in a landfill cover soil are differentially related to soil abiotic factors. Environ Microbiol Rep 1: 398–407.
Martineau C, Whyte LG & Greer CW (2010) Stable isotope probing analysis of the diversity and activity of
methanotrophic bacteria in soils from the Canadian high arctic. Appl Environ Microbiol 76: 5773–5784.
Middleburg JJ, Barraguet C, Boschker HTS, Herman PMJ, Moens T & Heip CHR (2000) The fate of intertidal microphytobenthos carbon: an in situ13C-labeling study. Limnol Oceanogr 45: 1224–1234.
Mohanty SR, Bodelier PLE, Floris V & Conrad R (2006) Differential effects of nitrogenous fertilizers on methane-consuming microbes in rice field and forest soils. Appl Environ Microbiol 72: 1346–1354.
Moss CW & Lambertfair MA (1989) Location of double-bonds in monounsaturated fatty-acids of Campylobacter
cryaerophila with dimethyl disulfide derivatives and combined gas chromatography-mass spectrometry. J Clin Microbiol 27: 1467–1470.
Murrell JC (2010) The aerobic methane oxidizing bacteria (Methanotrophs). Handbook of Hydrocarbon and Lipid Microbiology (Timmis KN, ed.), pp. 1953–1966. Springer, Berlin Heidelberg.
Neufeld JD, Dumont MG, Vohra J & Murrell JC (2007) Methodological considerations for the use of stable isotope probing in microbial ecology. Microb Ecol 53: 435–442.
Nichols PD, Guckert JB & White DC (1986) Determination of monounsaturated fatty acid double-bond position and geometry for microbial monocultures and complex consortia by capillary GC-MS of their dimethyl disulphide adducts. J Microbiol Meth 5: 49–55.
Niemann H, Elvert M, Hovland M et al. (2005) Methane emission and consumption at a North Sea gas seep (Tommeliten area). Biogeosciences 2: 335–351. Niemann H, Losekann T, de Beer D et al. (2006) Novel
microbial communities of the Haakon Mosby mud volcano and their role as a methane sink. Nature 443: 854–858. Noll M, Frenzel P & Conrad R (2008) Selective stimulation of
type I methanotrophs in a rice paddy soil by urea fertilization revealed by RNA-based stable-isotope probing. FEMS Microbiol Ecol 65: 125–132.
Op den Camp HJM, Islam T, Stott MB, Harhangi HR, Hynes A, Schouten S, Jetten MSM, Birkeland NK, Pol A & Dunfield PF (2009) Environmental, genomic and taxonomic perspectives on methanotrophic Verrucomicrobia. Environ Microbiol Rep 1: 293–306.
Padmanabhan P, Padmanabhan S, DeRito C, Gray A, Gannon D, Snape JR, Tsai CS, Park W, Jeon C & Madsen EL (2003) Respiration of13C-labeled substrates added to soil in the field and subsequent 16S rRNA gene analysis of13C-labeled soil DNA. Appl Environ Microbiol 69: 1614–1622.
Pombo SA, Pelz O, Schroth MH & Zeyer J (2002) Field-scale C-labeling of phospholipid fatty acids (PLFA) and dissolved inorganic carbon: tracing acetate assimilation and
mineralization in a petroleum hydrocarbon-contaminated aquifer. FEMS Microbiol Ecol 41: 259–267.
Pombo SA, Kleikemper J, Schroth MH & Zeyer J (2005) Field-scale isotopic labeling of phospholipid fatty acids from acetate-degrading sulfate-reducing bacteria. FEMS Microbiol Ecol 51: 197–207.
Radajewski S, Ineson P, Parekh NR & Murrell JC (2000) Stable-isotope probing as a tool in microbial ecology. Nature 403: 646–649.
Radajewski S, McDonald IR & Murrell JC (2003) Stable-isotope probing of nucleic acids: a window to the function of uncultured microorganisms. Curr Opin Biotechnol 14: 296–302.
Schroth MH & Istok JD (2006) Models to determine first-order rate coefficients form single-well push-pull tests. Ground Water 44: 275–283.
Schroth MH, Eugster W, Go´mez KE, Gonzalez-Gil G, Niklaus PA & Oester P (2012) Above- and below-ground methane fluxes and methanotrophic activity in a landfill-cover soil. Waste Manage 32: 879–889.
Shrestha M, Abraham WR, Shrestha PM, Noll M & Conrad R (2008) Activity and composition of methanotrophic bacterial communities in planted rice soil studies by flux measurements, analyses of pmoA gene and stable isotope probing of
phospholipid fatty acids. Environ Microbiol 10: 400–412. Shrestha M, Shrestha PM & Conrad R (2011) Bacterial and
archaeal communities involved in the in situ degradation of
13C-labelled straw in the rice rhizosphere. Environ Microbiol
Rep 3: 587–596.
Urmann K, Gonzalez-Gil G, Schroth MH, Hofer M & Zeyer J (2005) New field method: gas push-pull test for the in-situ quantification of microbial activities in the vadose zone. Environ Sci Technol 39: 304–310.
Urmann K, Gonzalez-Gil G, Schroth MH & Zeyer J (2007) Quantification of microbial methane oxidation in an alpine peat bog. Vadose Zone J 6: 705–712.
Urmann K, Schroth MH, Noll M, Gonzalez-Gil G & Zeyer J (2008) Assessment of microbial methane oxidation above a petroleum-contaminated aquifer using a combination of in situ techniques. J Geophys Res 113: G02006. doi:10.1029/ 2006JG000363.
Supporting Information
Additional Supporting Information may be found in the online version of this article:
Fig. S1. Rate plots of CH4 oxidation at locations C1-1
(dark grey symbols) and NM-1 (light grey symbols) during regular GPPT (circles) and SIP-GPPT (triangles). Fig. S2. Representative example of partial GC-MS chromatogram of polar FAs in the range of C13 to C19,
extracted from location C1-1 after SIP-GPPT.
Please note: Wiley-Blackwell is not responsible for the content or functionality of any supporting materials supplied by the authors. Any queries (other than missing material) should be directed to the corresponding author for the article.