Can soil gas profiles be used to assess
1
microbial CH
4oxidation in landfill covers?
2
Julia Gebert1*, Inga Ute Röwer1, Heijo Scharff3, Camila D.L. Roncato2 and Alexandre R. Cabral2 3
1University of Hamburg, Institute of Soil Science, Allende-Platz 2, 20146 Hamburg, Germany 4
2Université de Sherbrooke, Department of Civil Engineering, 2500, Boul. de l'Université 5
Sherbrooke (Québec), Canada J1K 2R1 6
3NV Afvalzorg, Nauerna 1, 1566 PB, Assendelft, The Netherlands 7
*Correspondence: Dr. J. Gebert: e-mail: j.gebert@ifb.uni-hamburg.de
8
9
Abstract
11
A method is proposed to estimate CH4 oxidation efficiency in landfill covers, biowindows or 12
biofilters from soil gas profile data. The approach assumes that the shift in the ratio of CO2 to 13
CH4 in the gas profile, compared to the ratio in the raw landfill gas, is a result of the oxidation 14
process and thus allows the calculation of the cumulative share of CH4 oxidized up to a 15
particular depth. The approach was validated using mass balance data from two independent 16
laboratory column experiments. Values corresponded well over a wide range of oxidation 17
efficiencies from less than 10% to nearly total oxidation. An incubation experiment on 40 18
samples from the cover soil of an old landfill showed that the share of CO2 from respiration falls 19
below 10 % of the total CO2 production when the methane oxidation capacity is 3.8 µg CH4 gdw-1 20
h-1 or higher, a rate that is often exceeded in landfill covers and biofilters, according to a recent 21
review paper. The method is mainly suitable in settings where the CO2 concentrations are not 22
significantly influenced by processes such as respiration or where CH4 loadings and oxidation 23
rates are high enough so that CO2 generated from CH4 oxidation outweighs other sources of 24
CO2. The latter can be expected for most biofilters, biowindows and biocovers on landfills. This 25
simple method constitutes an inexpensive complementary tool for studies that require a 26
reasonable estimation of the CH4 oxidation efficiency values in passive methane oxidation 27
systems, such as landfill biocovers and biowindows. 28
Key words: passive methane oxidation / soil respiration / greenhouse gases 29
1. Introduction
31
The microbial oxidation of methane in cover soils, biofilters or biowindows is considered a potent 32
option for the mitigation of fugitive and low calorific emissions from landfills, i.e. CH4 fluxes that 33
cannot be utilized for energy recovery because either the gas generation rate and/or the CH4 34
content are too low. (e.g. Barlaz et al., 2004; Gebert and Gröngröft, 2006; Haubrichs and 35
Widmann, 2006; Huber-Humer et al., 2008; Streese and Stegmann, 2003; Scheutz et al., 2004). 36
As a consequence, the recent IPCC Working Group III assessment report (Bogner et al., 2007) 37
has listed biocovers and biofilters as key mitigation technologies and practices to reduce 38
greenhouse gas emissions from landfills. 39
As landfills are ranked as the second largest source of anthropogenic CH4 emissions in Europe, 40
making up for 28% of the total anthropogenic CH4 emission at approximately 3.7 Gg/a for the 41
EU-15 (EEA, 2009), the need to assess the efficiency of mitigation measures, such as the 42
installation of a biocover or a biofilter, is paramount. This is particularly important in the context 43
where gas extraction systems are one day turned off, while biogas production may continue for 44
several decades. However, a reliable quantification of methane removal rates is possible only 45
when the magnitude of the fluxes into and out of the cover are known - which rarely is the case 46
(Cabral et al. 2009, 2010) - or estimated (e.g. Einola et al. 2008; 2009). 47
More recently, stable isotope probing has been applied to assess methane oxidation in landfill 48
covers in situ (Chanton and Liptay, 2000; Börjesson et al., 2007; Chanton et al., 2008; Cabral et 49
al. 2010). However, the high cost of the analyses and the extreme sensibility of calculated CH4 50
oxidation efficiencies to infinitesimal variations in the magnitudes of the fractionation factor αox 51
(e.g. Cabral et al. 2010) and the fractionation due to diffusive gas transport (αtrans, diff;De Visscher 52
etal., 2004) may difficult dissemination of the use of this technique. 53
In systems that are dominated by diffusion, such as terrestrial soils, gas profiles can be used to 54
quantify gas fluxes and emissions to the atmosphere (Kim et al., 2007), provided that the 55
effective diffusion coefficient of the material is known. The approach is limited by the fact that the 56
effective diffusivity varies strongly with the share of air-filled pore volume (Moldrup et al., 2000), 57
which in turn is directly affected by water content. Profiles of CH4, CO2 and O2 in landfill covers 58
or column studies have therefore only been used as a qualitative indicator of methane oxidation, 59
and to localize the approximate depth of the methane oxidation horizon. 60
To date, the only guidance for oxidation in emission modelling is given in the IPCC Guidelines 61
for National Greenhouse Gas Inventories (Pipatti and Svardal, 2006). For landfill gas models 62
these guidelines recommend a 10% default value for CH4 oxidation if a “suitable” cover is 63
present. Higher values are only accepted when supported by research data relevant for the 64
region, which are rare. The scarcity of data is partly due to the difficulty (and/or cost) in 65
evaluating oxidation efficiencies. Given the economic relevance of considering proper oxidation 66
percentages in passive methane mitigation systems, this paper explores the possibilities and 67
limitations of quantifying the share of methane oxidized in landfill covers, biofilters or biowindows 68
by means of the analysis of the shift in the ratio of CO2 to CH4 in the gas profile. The proposed 69
methodology was validated by means of two independent laboratory column studies. The 70
materials used were mineral soils and a mixture of soil and compost. The studies involved 71
determination of gas profiles at several CH4 loading rates. 72
The main limitation to the proposed approach are processes other than CH4 oxidation that may 73
affect this ratio, of which soil respiration is the main one. If the potential error introduced by these 74
processes can, in specific cases, be either neglected or accounted for, the estimation of CH4 75
temporal and spatial dynamics of CH4 oxidation in cover soils and thus to assess the influence of 79
regulatory factors such as soil temperature and porosity or water content, and 2) estimate 80
methane oxidation efficiency in landfills situated in developing countries using simple 81
technological tools. 82
2. Materials and methods
83
2.1 Laboratory column studies and materials 84
For the first study, six columns were set up (Fig. 1) to test the five different types of soils 85
provided by NV Afvalzorg, The Netherlands. Table 1 summarizes selected soil physical 86
parameters of the five soils used in the first column experiment. Although all materials were 87
sand-dominated, physical properties of the soils vary quite strongly, with bulk densities between 88
1.36 and 1.73 g cm-3 and, most importantly for gas transport, a water free pore volume between 89
14.6 and 25.9 vol.%. The TOC of the samples taken from the column study varied between 1.4 90
and 7.5 % (see also Table 3). 91
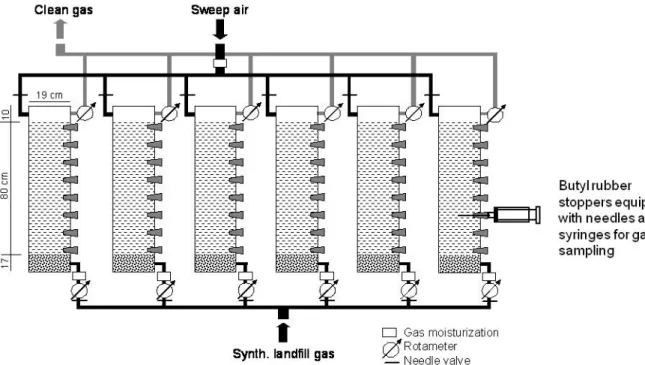
Fig. 1. Setup of the first laboratory column study using mineral soils.
92
Table 1.
93
Characteristics of the materials used in the first column study. ww = wet weight. dw = dry weight.
94
Column 1 Column 2 Column 3 Column 4 Column 5 Column 6
Texture(1) sand sand sand loamy
sand sandy loam sandy loam
Compaction [% Proctor] 95 95 95 95 95 85
Weight soil [kg ww] 42.6 36.3 43.8 37.9 41.3 37.0
Bulk density [g dw cm-³] 1.67 1.38 1.73 1.36 1.59 1.42
Solids volume [l] 14.6 11.8 14.8 11.7 13.4 12.0
Pore volume [l] 8.6 10.9 7.9 11.0 9.0 10.4
Pore volume [vol.%] 38.0 47.9 34.7 48.6 40.1 46.4
Water content [vol.%] 16.8 22.1 20.0 31.0 25.7 23.0
Gas volume [vol.%] 21.2 25.9 14.6 17.7 14.5 23.5
(1) Soil texture defined according to the World Reference Base (IUSS Working Group WRB, 2006).
In each column, an 80-cm high layer of soil material was compacted to approximately 95% of 96
the maximum Proctor density, after water contents had been adjusted to the equivalent of the 97
average of 6 and 30 kPa suction, i.e. field capacity. Column 6, containing the same material as 98
column 5, was compacted to only 85 % of the maximum Proctor density. This degree of 99
compaction was chosen to simulate the effect of circulation of heavy machinery. 100
In the bottom, a gas-distribution layer, consisting of 17 cm of coarse gravel (φ = 2 to 8 mm), was 101
installed. The top 10 cm served as air-filled headspace. The columns were continuously flushed 102
with moisturized synthetic landfill gas (40 vol.% CO2, 60 vol.% CH4) at flow rates varying from 103
1.65 to 4.99 l CH4 m-2 h-1. The headspace was permanently flushed with moisturized synthetical 104
air at an excess flow rate. Gas and air were moisturized by bubbling them through water. 105
Average temperature during the five months of the experiment was 19.3 °C. Inlet and outlet 106
fluxes were controlled with rotameters. 107
The second study employed a very similar experimental setup (see also Roncato, 2009). Two 108
types of materials that are commonly found at the Saint-Nicéphore landfill (Québec) were tested 109
and their characteristics are presented in Table 2. The first is a mixture made up of 5 volumes of 110
compost (before sieving) and 1 volume of coarse sand (D10 = 0.07mm; D85 = 0.8mm; coefficient 111
of uniformity, Cu = 4.3) (details given in Jugnia et al., 2008), The other material is a mixture of 112
equal proportions of 6.4 mm gravel and the sand-compost mixture. Two different heights of 113
samples were tested: 30 and 45 cm. The sand-compost was compacted to 85% of the Proctor 114
density, in order to simulate the conditions found in a field experiment using the same materials 115
(Cabral et al. 2009, 2010). The gravel-sand-compost mixture was compacted to 77% of the 116
Proctor, again to simulate actual field conditions. 117
Table 2.
118
Characteristics of the materials used in the second column study.
119
↓ Parameter Material → Sand-compost (2 tests) Sand-compost-gravel (4 tests)
Organic matter [%] (1) 18 6
Degree of saturation, Sr (initial) 59.8; 68.7 40.4; 62.6; 44.9; 41.0 Degree of sat., Sr (end; 0-10 cm) 75.9; 83.2 51.9; 60.7; 64.7; 53.9
Gs [specific gravity] (2) 2.24 2.74
n [total porosity] 0.63 0.48
Compaction [% Proctor] (3) 85 77
Bulk density [g dw cm-³] 0.84 1.43
(1) ASTM D2974-00, Standard Test Methods for Moisture, Ash, and Organic Matter of Peat and Other
120
Organic Soils.
121
(2) CAN/BNQ 2501-070/2006, Soils - Determination of Relative Density of Solid Particles.
122
(3) CAN/BNQ 2501-250/2005, Soils - Determination of the Water-Density Relation - Standard Effort
123
Compaction Test.
124
The columns were continuously flushed with a mixture of moisturized synthetic landfill gas (50 125
vol.% CO2, 50 vol.% CH4). The flow rates varied between 0.5 l CH4 m-2 h-1 and 7.8 l CH4 m-2 h-1. 126
The headspace was also continuously flushed with moisturized air. Flow rates were controlled 127
by means of rotameters. 128
In the second study, a respiration test was performed after completion of each oxidation test. 129
Instead of synthetic gas, N2 was applied from the bottom, while air was introduced in the head 130
space. Several ratios of N2 flow to air flow were applied. For each ratio, the CO2 concentration in 131
the headspace was measured when it became stabilized. This CO2 concentration is assumed to 132
be the result of respiration, under conditions one finds in the field, i.e. concomitant to an upward 133
flow of gas. The CO2 concentration attributed to respiration is eventually subtracted from the 134
total headspace CO2 concentrations measured during the actual oxidation tests. The final results 135
from these subtractions are the concentrations of CO2 generated by CH4 oxidation that are 136
eventually used to calculate oxidation efficiencies using the proposed method. 137
Soil gas profiles (CH4, CO2, O2, and N2) were obtained by probing through butyl rubber stoppers. 138
In the first study, they were inserted at nine depths: headspace, 5, 15, 25, 35, 45, 55, 65, and 75 139
cm below the soil surface. For the columns of the second study, samples were taken every 10 140
cm, starting from the bottom of the sample. 141
2.2 Batch assays 142
Batch assays were conducted to determine the potential CH4 oxidation rate and the respiration 143
rate of the soils tested in the first column study and of 40 mixed soil samples from the top 30 cm 144
of the final cover of an old landfill in Northern Germany. The soil samples from the old landfill 145
were classified as sandy loam (IUSS Working Group WRB, 2006). Their TOC content ranged 146
between 0.5 and 4 % with a mean of 2.2 %. 147
Standard SCHOTT DURAN® laboratory bottles (100 ml) where filled in triplicate with 10 g of 148
fresh soil. The soils from the first column test were investigated at the water content 149
corresponding to the one in the respective column. The samples from the old landfill were sieved 150
to 2 mm and adjusted to 60 % of the water holding capacity. Bottles where sealed with butyl 151
rubber stoppers. For the CH4 oxidation assay, the headspace composition was adjusted to 10 152
vol.% CH4 by addition of an appropriate volume of pure CH4. The bottles were then incubated at 153
20 °C in the dark. Concentrations of CH4 and CO2 in the headspace were monitored until all CH4 154
was oxidized. Oxidation rates were calculated using the linear part of the CH4 degradation curve 155 as follows: 156 24 10 4 4 _ 4 × × × × × = soil CH bottle pot ox dCHdt VolMVol MMdw CH (1) 157
where CH4ox_pot = potential CH4 oxidation capacity [µg gdw-1 h-1] 158
dCH4/dt = slope of change in CH4 concentration [vol.%] over time [d] 159
Volbottle = gas volume of bottle [ml] 160
MMCH4 = molar mass of CH4 = 16 g/mol 161
MV = molar gas volume at the given temperature [l] 162
dwsoil = dry weight of soil [g]. 163
Soil respiration was calculated from the linear increase in headspace CO2 over a period of 164
approximately 40 days according to the following equation: 165
24
10
2 2 2×
×
×
×
×
=
soil CO bottleprod
dCO
dt
Vol
MVol
MM
dw
CO
(2)166
where CO2prod =CO2 produced [µg gdw-1 h-1] 167
dCO2/dt = slope of change in CO2 concentration [vol.%] over time [d] 168
Volbottle = gas volume of bottle [ml] 169
MMCO2 = molar mass of CO2 = 44 g/mol 170
MV = molar gas volume at the given temperature [l] 171
dwsoil = dry weight of soil [g]. 172
2.3 Gas chromatography 173
The headspace composition of the columns in the first study as well as batch headspace 174
concentrations were measured with a gas chromatograph (Shimadzu) equipped with a flame 175
ionization detector (FID, GC 14 A subunit) and a thermal conductivity detector (TCD, GC 14 B 176
subunit). Column gas profiles were measured with an Agilent JAS2 GC-FID/TCD equipped with 177
two Inventory #AB002 capillary columns. For the second study, the concentrations of CH4, CO2, 178
O2 and N2 were determined using a gas chromatograph (Micro GC 3000 A, Agilent) equipped 179
with two columns: MolSieve 5 A (for O2, N2 and CH4 measurements) and Plot Q (for CO2 180
measurements). 181
2.4 Calculation of CH4 oxidation efficiency based on CH4 mass balances 182
CH4 oxidation efficiencies were calculated from the fluxes into and out of the columns as follows: 183
=
(
−
)
×
100
in out in
ox
flux
flux
flux
Eff
(3)184
where Effox = % of CH4 loading oxidized (oxidation efficiency) 185
fluxin = CH4 flux into the column (ml min-1), calculated from the inlet flow rate and the 186
known CH4 concentration of the feed gas 187
fluxout = CH4 flux out of the column (ml min-1), calculated from the outlet flow rate and the 188
measured CH4 concentration in the column headspace. 189
2.5 Calculation of CH4 oxidation efficiency from soil gas profiles: proposed methodology 190
Landfill gas is typically composed of 55 to 60 vol.% CH4 and 40 to 45 vol.% CO2. As a 191
consequence, the ratio of CO2 to CH4 varies from 0.67 to 0.82. Microbial oxidation of CH4 in the 192
landfill cover shifts this ratio to higher values, as CH4 is consumed, producing CO2. Provided that 193
the main source of CO2 is methane oxidation, this ratio allows for the quantification of the 194
cumulative amount of CH4 oxidized up to any particular depth within the profile, based on known 195
concentrations of CO2 and CH4 in the raw landfill gas and in the pore gas, at the desired depth. 196
The method is independent of the nature of the flux (diffusive or advective). It is also 197
independent of the effect of dilution of the pore gas by the ingress of atmospheric air from the 198
surface, since it considers that CH4 and CO2 are diluted to the same extent. 199
The following assumptions are made: 200
According to the nominal oxidation reaction (CH4 + 2 O2 → CO2 + 2 H2O), 1 mol of CH4 is 201
converted to 1 mol of CO2. 202
1. It is assumed that in a well established landfill cover or biofilter the size of the 203
methanotrophic population is stable. Under these conditions there is no net transfer of 204
carbon into the microbial biomass, i.e. assimilation of carbon will be in equilibrium with 205
release of carbon due to cell decay. 206
2. CO2 is produced by oxidation of CH4 only. We assume this to be valid under conditions 207
where the CO2–CH4 ratio is mainly controlled by CH4 oxidation, i.e. respiration plays a 208
minor role. This occurs in biofilters with high CH4 loading and oxidation rates, as well as 209
in common daily or temporary landfill covers. It may also occur in final covers, in cases 210
where gas extraction systems are inefficient. 211
Limitations stemming from the assumptions above are discussed in detail later in the text. As a 215
result of assumptions 1 to 5, the volume of CH4 oxidized equals the volume of CO2 produced 216
and the share of oxidized CH4 at a certain depth i, x, can be derived from Eq. 4: 217 _i _i _LFG _LFG CH CO x CH x CO 4 2 4 2 = − + (4) 218
where x = share of oxidized CH4 (vol.%) 219
CH4_LFG = CH4 concentration of the landfill gas (vol.%) 220
CO2_LFG = CO2 concentration of the landfill gas (vol.%) 221
CH4_i = CH4 concentration in depth i (vol.%) 222
CO2_i = CO2 concentration in depth i (vol.%). 223
According to Eq. 4, the concentration of CO2 in the landfill gas plus the share of CO2 produced 224
by oxidation up to the depth i, divided by the concentration of CH4 in the landfill gas minus the 225
share of CH4 oxidized up to this depth is equal to the ratio of concentrations between the two 226
landfill gases at the same depth i. 227
By dividing the share of oxidized CH4 up to depth i by the concentration of CH4 in the landfill gas 228
(CH4_LFG), one obtains the cumulated percentage of CH4 oxidized, i.e. the cumulated oxidation 229 efficiency, Effox (%): 230 LFG ox
CH
x
Eff
_ 4=
(5) 231The proposed method hence utilizes the change in the carbon mass balance of the soil gas 232
phase to quantify CH4 oxidation. A very similar approach has been applied by Christophersen et 233
al. (2001), who calculated bottom CH4 fluxes at the base of a landfill cover and in situ CH4 234
oxidation rates by using the ratio of CH4 to CH4 at the base of a landfill cover and comparing it to 235
the ratio of the CH4 flux to CO2 flux leaving the cover. 236
3. Results and Discussion
238
3.1 Batch CH4 potential oxidation and respiration 239
Potential CH4 oxidation and respiration rates for the five soils investigated in the first column 240
study varied between 0.24 and 0.54 µmol CH4 gdw-1 h-1 (3.8 and 8.6 µg CH4 gdw-1 h-1, Table 3). 241
The CO2 evolution by respiration was between 1.0 and 1.8% of the observed CO2 production 242
from CH4 oxidation. Except for the soil used in columns 5 and 6, the materials had not been 243
previously exposed to landfill biogas. The values of the share of respiration presented in Table 3
244
are thus conservative values. Given the apparent low proportion of CO2 released by respiration, 245
assumption 3 (see section 2.5) was assumed to be valid for the first column experiment. For the 246
second column experiments, respiration values were determined as explained before and the 247
associated results are discussed later in the paper. 248
Table 3.
249
Potential CH4 oxidation and respiration rates for the column material determined in batch experiments.
250
Column no. TOC [%] [µmol CHCH4 oxidation rate 4 gdw-1 h-1 ]
Respiration rate [µmol CO2 gdw-1 h-1 ]
Share of respiration [%]
Avg Max Min Avg Max Min Avg
1 2.0 0.24 0.26 0.20 0.0032 0.0034 0.0032 1.3 2 4.9 0.35 0.39 0.32 0.0041 0.0043 0.0041 1.2 3 3.0 0.23 0.23 0.23 0.0023 0.0023 0.0020 1.0 4 7.5 0.54 0.66 0.45 0.010 0.0102 0.0095 1.9 5, 6 1.4 0.33 0.36 0.30 0.006 0.0081 0.0013 1.8
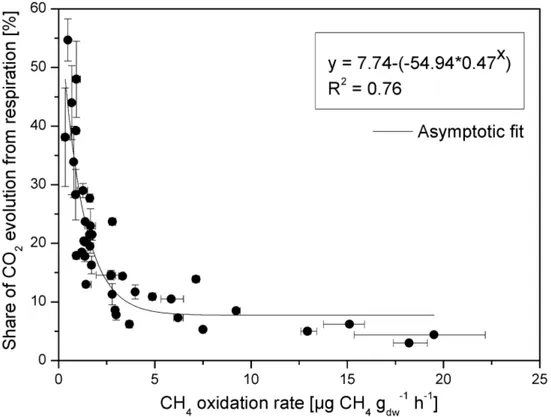
For the 40 samples from the landfill cover soil, CH4 oxidation rates varied between 0.0063 and 251
1.4 µmol CH4 gdw-1 h-1 (0.1 and 22 µg CH4 gdw-1 h-1) and respiration rates ranged between 0.0045 252
and 0.32 µmol CO2 gdw-1 h-1 (0.2 and 14 µg CO2 gdw-1 h-1). When the evolution of CO2 from 253
respiration is compared to the evolution of CO2 from the combined processes of CH4 oxidation 254
of samples, the relationship was best described by an asymptotic function according to which 258
the share of respiratory CO2 release falls below 10% of the total CO2 release when the CH4 259
oxidation rate exceeds 3.6 µg gdw-1 h-1. As reviewed by Scheutz et al. (2009), this rate has been 260
exceeded in many studies investigating the methanotrophic potential of mineral landfill cover 261
soils (e.g. Czepiel et al., 1996; Börjesson et al., 2004; Stein & Hettiaratchi, 2001; de Visscher et 262
al., 2001; Park et al., 2009). In other words, the contribution of CO2 from respiration to the total 263
share of CO2 can be considered negligible. As a consequence, for this particular set of results, 264
the third assumptions necessary to use the proposed method is respected. 265
Fig. 2. Share of CO2 evolution from respiration versus CH4 oxidation rate. All data determined in batch
266
experiments using 40 samples from a landfill cover soil. Symbols = average values; error bars = minimum
267
and maximum.
268
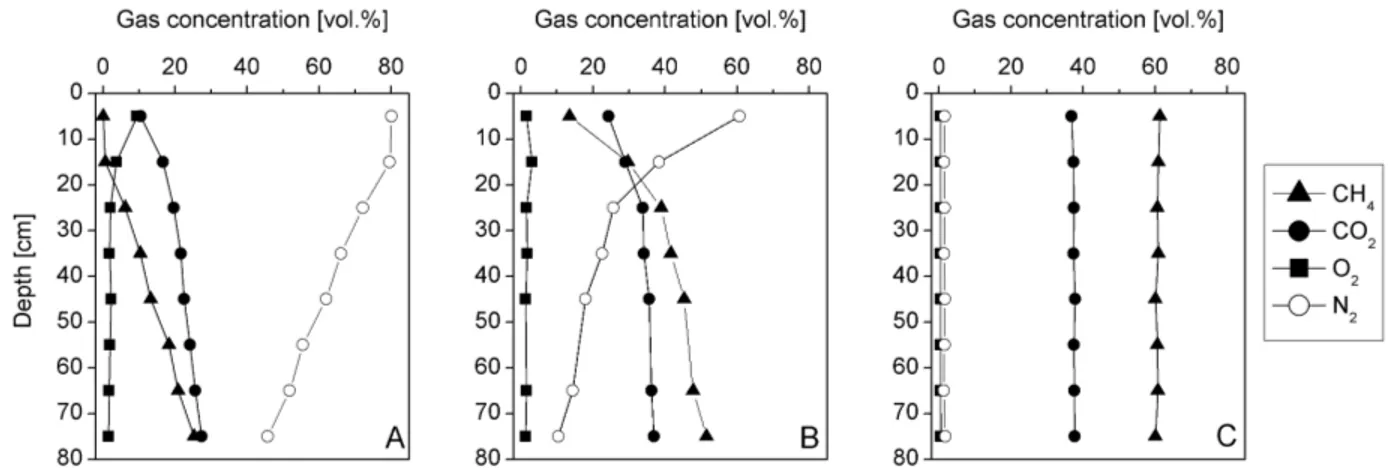
3.3 Gas profiles and CH4 oxidation: first column study 269
Fig. 3 shows the profiles of CH4, CO2, O2 and N2 associated with three conditions: high oxidation 270
efficiency (column 1), intermediate (column 2) and low efficiency (column 4). Graph A (column 1) 271
shows that the material was highly aerated, as indicated by the high concentrations of N2 272
straight to the base of the column. A high ratio of CO2 to CH4 at the base of the soil material 273
suggests that methane oxidation was already taking place in the gas distribution layer (for ratios 274
of CO2 to CH4 see Table 4). In the situation depicted in graph B (Fig. 3), air penetrates into the 275
column to a far lesser extent. As in graph A, the proportion of O2 to is far less than in the air, 276
indicating that O2 is consumed. Finally, graph C shows a situation, where hardly any air 277
penetrates into the column. Correspondingly, the nearly unchanged concentrations of CH4 and 278
CO2 up to a depth of 5 cm indicate that no oxidation was taking place. 279
Fig. 3. Three exemplary soil gas profiles from the laboratory column study. A = column 1 (20.10.2007,
280
inlet flux = 2.4 l m-2 h-1), B = column 2 (03.12.2007; inlet flux = 5.0 l m-2 h-1), C = Column 4 (21.11.2007,
281
inlet flux = 3.6 l m-2 h-1).
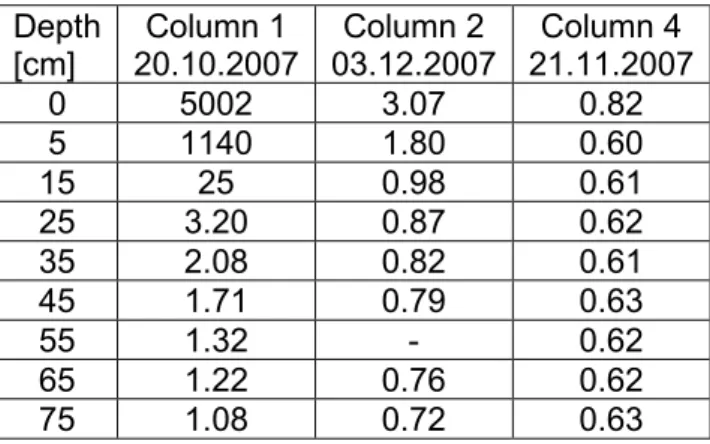
Table 4 gives the ratio of CO2 to CH4 calculated for each of the three cases shown in Fig. 3, while 283
Fig. 4 depicts their corresponding oxidation efficiencies calculated using Eq. 5. These results 284
show that under conditions of insufficient air ingress (column 4), oxidation occurs only very near 285
the surface. In column 2, oxidation occurred across the entire profile, with the top 15 cm 286
contributing the most. In this example, the total Effox is 58.6%, of which approximately 30% occur 287
in the top 5 cm. In the case of column 1, nearly 100% CH4 oxidation efficiency was already 288
attained at a depth of 5 cm. Good aeration allowed for methanotrophic activity across the entire 289
profile with the greatest relative share being effected within the top 35 cm. Figure 4 shows that 290
the total oxidation efficiency calculated from the CO2-CH4 ratio, as can be derived from the 291
value in depth 0 (= column headspace) compares extremely well to the oxidation efficiency 292
calculated from mass balance (number given in box). 293
Table 4.
294
Ratios of CO2 to CH4 for the three exemplary gas profiles. Depth 0 = column headspace.
295
Depth
[cm] 20.10.2007 Column 1 03.12.2007 Column 2 21.11.2007 Column 4
0 5002 3.07 0.82 5 1140 1.80 0.60 15 25 0.98 0.61 25 3.20 0.87 0.62 35 2.08 0.82 0.61 45 1.71 0.79 0.63 55 1.32 - 0.62 65 1.22 0.76 0.62 75 1.08 0.72 0.63
Fig. 4. Three examples of the CH4 oxidation efficiency (Effox) as calculated by Eq. 5 from the ratio of CO2
296
to CH4 in the laboratory column study. Depth 0 = headspace; Col. = column; Numbers in legend = date of
297
sampling.
298
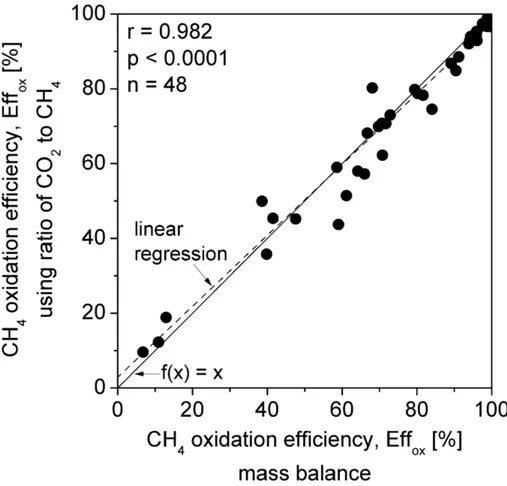
Fig. 5 presents a comparison between oxidation efficiencies obtained from mass balance 299
Fig. 5. Column study: Effox (%) calculated by mass balance (Eq. 3) versus Effox in the headspace
302
calculated using the ratio of CO2 to CH4 (Eq. 5).
303
The oxidation efficiency calculated using the CO2-CH4 ratio in the column headspace compares 304
very well to the oxidation efficiency calculated by mass balance (Eq. 3), with decreasing 305
efficiencies corresponding to decreasing extents of air penetration (compare to the exemplary 306
profiles of N2 shown in Figure 3). Deviations from the ideal x=y scenario (f(x) = x) may result 307
from various causes influencing the ratio of CO2 to CH4. For example, under-proportional release 308
of CO2 due to carbon assimilation during population growth causes an underestimation of 309
oxidation. In cases of stress, respiration rates increase and more CO2 is released, leading to 310
higher CO2-CH4 ratios and thereby an overestimation of oxidation. Figure 5 shows only a few 311
values of low CH4 oxidation efficiency. Low efficiencies in the column study were always related 312
to insufficient depth of air penetration. In these cases, CH4 oxidation was restricted to the 313
topmost centimetres of the column. 314
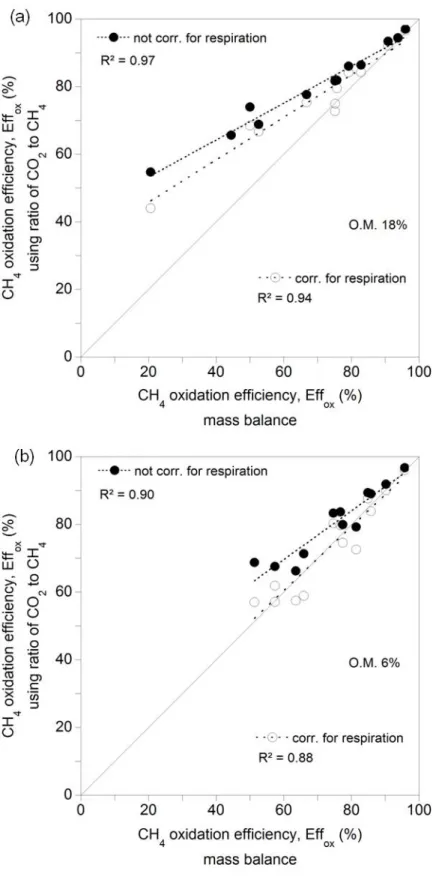
Fig. 6. Oxidation efficiencies obtained with the second study: (a) For high organic matter (O. M.) content
315
(n = 13); (b) for low organic matter content (n = 13).
316
Fig. 6 presents a comparison between oxidation efficiencies obtained from mass balance 317
calculations and the proposed method, with data from the second column study, where a 318
material with high organic matter content (18%) and a material with lower organic matter content 319
(6%) were used. It can be observed in Fig. 6a that the proposed method overestimated oxidation 320
efficiencies for the material containing high organic matter content (18%), although the 321
overestimation was not as important in the higher end of the efficiency scale ( i.e. Effox in the 322
vicinity of 75%) as in the lower end. Introduction of the correction for respiration resulted in 323
slightly better estimates. In the particular case of this column study, this was attributed to several 324
causes, among which, the following: (1) Measurements made in the beginning and the end of 325
the tests showed that the degrees of saturation increased, particularly near the surface of the 326
samples (Table 2). This increase is caused by the combined effects of oxidation, which also 327
produces water, and of water condensation (partly caused by humidification of the inlet air and 328
the synthetic gas). In field conditions, water may evaporate or transpire out; however, in the 329
laboratory, it keeps accumulating within the sample. The high humidity in one of the tests (Sr = 330
83.2%) may have led to a situation whereby anaerobic conditions resulted in shallower 331
penetration of O2, and some CO2 production down below. The existence of anaerobic conditions 332
and how it may have affected the CO2:CH4 ratio were not investigated in this column study. 333
The second cause of the overestimation of Effox by the proposed method for one particular test 334
(Fig. 6a) may be related to the fact that methanotrophic activity was possibly not fully developed 335
in the beginning of the test, leaving the available O2 for respiration and hence, CO2 production, 336
by heterotrophic bacteria. Indeed, in this particular test, the initial Sr was relatively low (59.8%), 337
which facilitated penetration of O2. It must be noted that an investigation of the data base for this 338
particular test showed that gas loadings did not affect the results, i.e. low efficiencies were found 339
for low and high gas flow rates. 340
Fig. 6b presents the comparison between oxidation efficiencies obtained with the mixture of 341
sand, compost and gravel, whose organic matter is in the order of magnitude normally found in 342
normal top soils (5%). It can be observed that before correction for respiration, the proposed 343
method overestimates oxidation efficiencies, but not to the same extent as in the case of the 344
material with high organic matter content (Fig. 6a). Introduction of the correction for respiration 345
led to an almost perfect alignment, i.e. y = 0.94x + 3.84; where y is the Effox from the CO2-CH4 346
ratio x is the Effox from mass balance calculations. This means that the proposed method 347
adequately estimated the actual efficiencies. Unfortunately there are no data available for 348
efficiencies below 50%. 349
3.4 Limitations of the proposed method 350
One of the limitations of the proposed method relates to the assumption of steady state gas flow 351
conditions. As gas flow rates vary continuously with changing atmospheric pressure and 352
precipitation, steady state is rarely obtained in the field. This can lead to an over - or 353
underestimation of the efficiency, depending on the prevailing conditions. Consequently, 354
occurrence of steady state may seem to be a farfetched assumption for actual landfill conditions. 355
It can be hypothesized that reliable results (oxidation efficiencies) could be obtained if the 356
proposed method were applied to gas profile data obtained during periods of stable weather 357
conditions, and that uncertainties related to its use under transient conditions can be overcome 358
by long-term field measurements covering all seasons and thus the range of possible climatic 359
conditions. It has to be kept in mind that the method is meant to give an indication of the 360
magnitude of the oxidation efficiency; not the exact value. 361
Another caveat is that the application of the method to field profiles may lead to an 362
underestimation of the total oxidation efficiency if a relevant share of the oxidation occurs very 363
near the surface (Cabral et al. 2009, 2010), while the top most samples of gas profiles are taken 364
from below this upper crust. It is thus advisable to collect samples from as shallow depths as 365
possible. 366
Finally, the proposed method is suitable only for application in settings in which the CO2 367
concentrations are not significantly influenced by processes such as heterotrophic or autotrophic 368
respiration. This implies that application is limited to materials and sites of low respiratory 369
activity, or when the quantities of CO2 generated from respiration are small compared to 370
generation from CH4 oxidation. Respiration becomes negligible to the calculation of efficiencies 371
based on the ratio of CO2 to CH4 under conditions of high CH4 fluxes and high CH4 oxidation 372
rates. This was backed by the results presented, which suggested that beyond a threshold 373
activity of approximately 3.8 µg CH4 g dw-1 h-1 , the CO2 production due to soil respiration falls 374
below 10% of the total CO2 concentration. High fluxes prevail in biofilters or biowindows, 375
providing preferential pathways for landfill gas or sites where a significant share of the produced 376
landfill gas escapes via the soil cover, as is the case for most landfills in developing countries. In 377
these setups performance could thus be very well quantified by the ratio of CO2 to CH4 in the 378
soil gas phase. 379
CO2 fluxes from natural soils vary with soil type, vegetation, season and diurnal course in 380
temperature and radiation. Maximum values in temperate climates can reach between 0.2 and 381
0.7 l CO2 m-2 h-1 (e.g. Kleber, 1997; Fang and Moncrieff, 2001; Richter et al., 1991; own 382
measurements on fallow land). If a 10 % error on the results of oxidation efficiency due to 383
respiratory CO2 is to be accepted, CH4 fluxes to and oxidation in the cover must be greater than 384
at least 7 l CH4 m-2 h-1 (approximately 5 g CH4 m-2 h-1). This magnitude is clearly exceeded in 385
biofilters where inlet fluxes of 37 – 371 l CH4 m-2 h-1 and CH4 oxidation rates of 30 - 120 l CH4 m -386
2 h-1 have been reported in field applications (Streese and Stegmann, 2003; Gebert and 387
Gröngröft, 2006; Haubrichs and Widmann, 2006; Powelson et al., 2006; Zeiss, 2006). This 388
magnitude of CH4 loading is also exceeded in many landfill covers, particularly when the cover is 389
not constructed following the same standards enforced by law in developed nations, in the last 390
15 to 25 years. 391
4. Conclusions
392
The proposed method represents an inexpensive and technically simple methodology to 393
estimate the CH4 oxidation efficiency values in passive methane oxidation systems, such as 394
landfill biocovers, biowindows and biofilters by means of soil gas probing. It allows for a 395
understanding of the dependency of the process on key environmental variables such as 398
temperature and moisture. 399
Comparison of CH4 oxidation calculated from the soil gas carbon balance and mass balance in 400
two independent column experiments with mineral soils intended for use as landfill cover 401
material showed an excellent correlation of CH4 oxidation efficiency data, indicating the 402
applicability of the method in settings where the carbon balance is dominated by CH4 oxidation. 403
As literature data show, this is true for many landfill cover soils and even more so for biofilters or 404
biowindows that usually receive high CH4 loading rates. The findings were further substantiated 405
by activity tests of 40 samples from the topsoil of a landfill cover, showing that the production of 406
CO2 from the process of CH4 oxidation increases exponentially with the CH4 oxidation rate and 407
that at rates > 3.6 µg gdw-1 h-1 the CO2 production from soil respiration becomes negligible. Other 408
settings where the proposed simple method can be applied include: daily or interim landfill 409
mineral cover soils that are usually not -or only sparsely- vegetated; and permanent soil covers 410
placed over non-sealed municipal solid waste landfills typically found in low-income countries. 411
Acknowledgements
412
The first column study was carried out in cooperation with melchior+wittpohl 413
Ingenieurgesellschaft Hamburg. The second column study was supported by a grant from the 414
Natural Science and Engineering Research Council of Canada (NSERC), BIOCAP Foundation 415
Canada, the Biotechnology Research Institute (NRC) and Waste Management Canada under 416
strategic grant # GHG 322418-0. When finalizing this manuscript, the last Author was working as 417
Visiting Professor at the Federal University of Santa Catarina, Brazil, with a grant from 418
CAPES/Brazil. 419
References
420
AG Boden (2005): Bodenkundliche Kartieranleitung. 5th edn., Schweizerbarth, Stuttgart.
421
Barlaz, M. R., Green R., Chanton, J.P., Goldsmith, C.D., Hater, G.R., 2004. Biologically active cover for mitigation of
422
landfill gas emissions. Environ. Sci. Technol. 38, 4891- 4899.
423
Bogner, J., Abdelrafie Ahmed, M., Diaz, C., Faaij, A., Gao, Q, Hashimoto, S., Mareckova, K., Pipatti, K., Zhang, T.,
424
2007. Waste Management, In Climate Change 2007: Mitigation. Contribution of Working Group III to the Fourth
425
Assessment Report of the Intergovernmental Panel on Climate Change [B. Metz, O.R. Davidson, P.R. Bosch, R.
426
Dave, L.A. Meyer (eds)], Cambridge University Press, Cambridge, United Kingdom and New York, NY, USA.
427
Börjesson, G., Samuelsson, J., Chanton, J., 2007. Methane Oxidation in Swedish Landfills Quantified with the Stable
428
Carbon Isotope Technique in Combination with an Optical Method for Emitted Methane. Environ. Sci. Technol. 41,
429
6684 -6690.
430
Börjesson, G., Sundh, I., Svensson, B., 2004. Microbial oxidation of CH4 at different temperatures in landfill cover
431
soils. FEMS Microbiol. Ecol. 48, 305-312.
432
Cabral, A. R., Moreira, J. F., Jugnia, L.-B., 2009. Biocover Performance of Landfill Methane Oxidation: Experimental
433
Results. J. Environ. Eng., ASCE. DOI: 10.1061/(ASCE)EE.1943-7870.0000182.
434
Cabral, A.R., Capanema, M.A., Gebert, J., Moreira, J.F., Jugnia, L.-B., 2010. Quantifying microbial methane oxidation
435
efficiencies in two experimental landfill biocovers using stable isotopes. Wat. Air Soil Poll. 209, 157-172.
436
Chanton, J. P., Liptay, K., 2000. Seasonal variation in methane oxidation in a landfill cover soil as determined by an in
437
situ stable isotope technique. Global Biogeochem. Cycles 14, 51-60.
438
Chanton, J.P., Powelson, D.K., Abichou, T., Hater, G., 2008. Improved field methods to quantify methane oxidation in
439
landfill cover materials using stable carbon isotopes. Environ. Sci. Technol. 42, 665-670.
440
Christophersen, M., Kjeldsen, P., Holst, H., Chanton, J., 2001. Lateral gas transport in soil adjacent to an old landfill:
441
factors governing emissions and methane oxidation. Waste Manage. Res. 19, 595-612
442
Czepiel, P.M., Mosher, B., Crill, P.M., Harriss, R.C. 1996. Quantifying the effect of oxidation on landfill methane
443
emissions. J. Geophys. Res. 101, 16721-16729.
444
De Visscher A., Schippers M., Van Cleemput O., 2001. Short-term kinetic response of enhanced methane oxidation in
445
landfill cover soils to environmental factors. Biol. Fert. Soils 33, 231-237.
446
De Visscher, A., De Pourcq, I., Chanton, J., 2004. Isotope fractionation effects by diffusion and methane oxidation in
447
landfill cover soils. J. Geophys. Res. 109. DOI:10.1029/2004JD004857.
448
Einola, J.K.M., Sormunen, K.M. , Rintala, J. A., 2008. Methane oxidation in a boreal climate in an experimental landfill
449
cover composed from mechanically-biologically treated waste. Sci. Tot. Env .407, 67-83.
450
Einola, J., Sormunen, K., Lensu, A., Leiskallio, A., Ettala, M., Rintala, J., 2009. Methane oxidation at a surface-sealed
451
boreal landfill. Waste. Manage. 29, 2105-2120.
452
European Environment Agency (EEA), 2009. Annual European Community greenhouse gas inventory 1990-2007 and
453
inventory report 2007. Submission to the UNFCCC Secretariat. EEA Technical report, no. 4. 2009; Annex I Key
454
category analysis. (http://reports.eea.europa.eu/technical_report_2006_6/en) Accessed Feb. 2007.
455
Fang, C., Moncrieff, J.B., 2001. The dependence of soil CO2 efflux on temperature. Soil Biol. Biochem. 33, 155-165.
456
Gebert. J., Gröngröft. A., 2006. Performance of a passively vented field-scale biofilter for the microbial oxidation of
457
landfill methane. Waste Manage. 26, 399-407.
458
Haubrichs, R., Widmann, R., 2006. Evaluation of aerated biofilter systems for microbial methane oxidation of poor
459
landfill gas. Waste Manage. 26, 408-416.
460
Huber-Humer, M., Gebert, J., Hilger, H., 2008. Biotic systems to mitigate landfill methane emissions. Waste Manage.
461
Res. 26, 33-46.
462
IUSS Working Group WRB, 2006. World reference base for soil resources 2006: a framework for international
463
classification, correlation and communication. World soil resources reports 103. Rome.
464
Jugnia, L.-B., Cabral, A.R., Greer, C.W., 2008. Biotic methane oxidation within an instrumented experimental landfill
465
cover. Ecol. Eng. 33, 102-109.
Moldrup, P., Olesen, T., Schjønning, P., Yamaguchi, T., Rolston, D.E., 2000. Predicting the gas diffusion coefficient in
472
undisturbed soil from soil water characteristics. Soil Sci. Soc. Am. J. 64, 1588–1594
473
Park, S., Lee, C.H., Ryu, C.R. & Sung, K.J., 2009. Biofiltration for reducing methane emissions from modern sanitary
474
landfills at the low methane generation stage. Wat. Air Soil Poll. 196, 19–27.
475
Pipatti, R., Svardal, P., 2006. IPCC Guidelines for National Greenhouse Gas Inventories; Volume 5: Waste; Chapter
476
3: Solid Waste Disposal, Prepared by the National Greenhouse Gas Inventories Programme, Eggleston H.S.,
477
Buendia L., Miwa K., Ngara T. and Tanabe K. (eds), ISBN 4-88788-032-4, IGES, Japan. http://www.ipcc-478
nggip.iges.or.jp/public/2006gl/vol5.htm 479
Powelson, D.K., Chanton, J., Abichou, T., Morales, J., 2006. Methane oxidation in water-spreading and compost
480
biofilters. Waste Manage. Res. 24, 528-536.
481
Rey, A., Pegoraro, E., Jarvis, P.G., 2008. Carbon mineralization rates at different soil depths across a network of
482
European forest sites (FORCAST). Eur. J. Soil Sci. 59, 1049-1062.
483
Richter, J., Kersebaum, K.-C., Willenbockel, I., 1991. Gaseous diffusion reflecting soil structure. J. Plant Nutr. Soil Sci.
484
154, 13-19.
485
Roncato, C.D., Létourneau, M., Cabral, A.R., 2010. Comparison between field and laboratory methane oxidation
486
rates. GeoFlorida 2010, West Palm Beach, FL, ASCE, GeoInstitute, Geotechnical Special Publication No. 199,
CD-487
Rom.
488
Scheutz C., Kjeldsen, P., Bogner, J.E., De Visscher, A., Gebert, J., Hilger, H.A., Humber-Humer, M., Spokas, K.,
489
2009. Microbial methane oxidation processes and technologies for migration of landfill gas emissions. Waste
490
Manage. Res. 27, 409-455.
491
Scheutz, C., Mosbæk. H., Kjeldsen. P., 2004. Attenuation of Methane and Volatile Organic Compounds in Landfill Soil
492
Covers. J. Environ. Qual. 33, 61-71.
493
Stein, V.B., Hettiaratchi, J.P.A., 2001. Methane oxidation in three Alberta soils: influence of soil parameters and
494
methane flux rates. Env. Tech. 22, 101–111.
495
Streese J., Stegmann, R., 2003. Microbial oxidation of CH4 from old landfills in biofilters. Waste Manage. 23, 573–580.
496
Zeiss, C.A. (2006): Accelerated methane oxidation cover systems to reduce greenhouse gas emissions from MSW
497
landfills in cold-semi-arid regions. Water, Air, Soil Pollut. 176, 285-306.
Fig. 2. Share of CO2 evolution from respiration versus CH4 oxidation rate. All data determined in batch experiments using 40 samples from a landfill cover soil. Symbols = average values; error bars = minimum and maximum.
Fig. 3. Three exemplary soil gas profiles from the laboratory column study. A = column 1 (20.10.2007,
inlet flux = 2.4 l m-2 h-1), B = column 2 (03.12.2007; inlet flux = 5.0 l m-2 h-1), C = Column 4 (21.11.2007, inlet flux = 3.6 l m-2 h-1).
Fig. 4. Three examples of the CH4 oxidation efficiency (Effox) as calculated by Eq. 5 from the ratio of CO2 to CH4 in the laboratory column study. Depth 0 = headspace; Col. = column; Numbers in legend = date of sampling.
Fig. 5. Column study: Effox (%) calculated by mass balance (Eq. 3) versus Effox in the headspace calculated using the ratio of CO2 to CH4 (Eq. 5).
Fig. 6. Oxidation efficiencies obtained with the second study: (a) For high organic matter (O. M.) content