HAL Id: hal-03223685
https://hal.archives-ouvertes.fr/hal-03223685
Submitted on 11 May 2021
HAL is a multi-disciplinary open access archive for the deposit and dissemination of sci-entific research documents, whether they are pub-lished or not. The documents may come from teaching and research institutions in France or abroad, or from public or private research centers.
L’archive ouverte pluridisciplinaire HAL, est destinée au dépôt et à la diffusion de documents scientifiques de niveau recherche, publiés ou non, émanant des établissements d’enseignement et de recherche français ou étrangers, des laboratoires publics ou privés.
ECONOMY: INVESTIGATING GLOBAL TRENDS
AND NATIONAL DIFFERENCES AMONG MAJOR
SPACE NATIONS’ MARKET STRUCTURE
Pierre Barbaroux
To cite this version:
Pierre Barbaroux. THE METAMORPHOSIS OF THE WORLD SPACE ECONOMY: INVESTIGAT-ING GLOBAL TRENDS AND NATIONAL DIFFERENCES AMONG MAJOR SPACE NATIONS’ MARKET STRUCTURE. Journal of Innovation Economics & Management, De Boeck Supérieur 2016, �10.3917/jie.020.0009�. �hal-03223685�
THE METAMORPHOSIS OF THE WORLD SPACE ECONOMY:
INVESTIGATING GLOBAL TRENDS AND NATIONAL DIFFERENCES
AMONG MAJOR SPACE NATIONS’ MARKET STRUCTURE
Pierre Barbaroux
De Boeck Supérieur | « Journal of Innovation Economics & Management »
2016/2 n°20 | pages 9 à 35 ISBN 9782807390041
Article disponible en ligne à l'adresse :
---http://www.cairn.info/revue-journal-of-innovation-economics-2016-2-page-9.htm
---!Pour citer cet article :
---Pierre Barbaroux, « The metamorphosis of the world space economy: investigating global trends and national differences among major space nations’ market structure », Journal of Innovation Economics & Management 2016/2 (n°20), p. 9-35.
---Distribution électronique Cairn.info pour De Boeck Supérieur. © De Boeck Supérieur. Tous droits réservés pour tous pays.
La reproduction ou représentation de cet article, notamment par photocopie, n'est autorisée que dans les limites des conditions générales d'utilisation du site ou, le cas échéant, des conditions générales de la licence souscrite par votre établissement. Toute autre reproduction ou représentation, en tout ou partie, sous quelque forme et de quelque manière que ce soit, est interdite sauf accord préalable et écrit de l'éditeur, en dehors des cas prévus par la législation en vigueur en France. Il est précisé que son stockage dans une base de données est également interdit.
OF THE WORLD SPACE
ECONOMY: INVESTIGATING
GLOBAL TRENDS
AND NATIONAL DIFFERENCES
AMONG MAJOR SPACE
NATIONS’ MARKET STRUCTURE
Pierre BARBAROUX
French Air Force Research Centre EOAA/CReA, France pierre.barbaroux@defense.gouv.fr
The role played by institutional and military customers in shaping the devel-opment of the space industry has long been acknowledged by scholars (e.g. McDougall, 1982). From the very beginning of the space era, government agencies (e.g. NASA, Roskomos, CNES or ESA) and military organisations (e.g. Ministries of Defence, Air Forces, Defence Acquisition Agencies) pro-vided direct support for the construction of space infrastructures, including ground stations, launchers and satellites facilities, and for the development and diffusion of space-related knowledge and capabilities. By expressing original needs and motives (e.g. defence and security, political prestige, sci-ence and technology development), government customers had a profound influence on the structure and dynamics of space industries. However, the past two decades revealed a significant decrease in military orders together with a growing importance of commercial and non-government demands for space technology. Investigating current trends in the U.S. space com-merce activities in the middle of the 2000’s, Shove stressed that “an
interest-ing metamorphism is evolvinterest-ing in the space industry as many firms begin to evolve from government-only customers to mixed customers and finally to totally private customers” (Shove, 2005). This “gradual shift towards increased commercial activities” as Peeters (2004) put it, would be in contradiction with the long
term evolution of space industries, the latter being historically shaped by government customers and non-commercial applications.
The foregoing raises important issues regarding the direction of space industries’ current evolution. Are space industries on the path towards becoming more open, civilianised and/or commoditised? Is this transfor-mation homogeneous among major space Nations? Or does it take dif-ferent form depending on national circumstances? To address the above research questions, this article collected and analysed data on 1593 space-craft launched by major space Nations from January 2000 to December 2013. Using descriptive statistics analysis, this article aims at discussing whether or not the asymmetries between commercial versus non-com-mercial applications, and government versus non-government customers tended to reduce, at least for the satellites and transportation sub-markets1.
Within this framework, two variables deserve particular attention: the rela-tive shares of commercial versus non-commercial applications, and the dis-tribution of launched spacecraft per types of customer. Focusing on these variables enables computing the relative weights of civil spacecraft (i.e., private and non-government launches) versus military and government orders and, at the same time, estimating how domestic versus non domestic launched spacecraft evolve through time. Altogether, these variables allow for a simple assessment of the levels of civilianisation, commoditisation and internationalisation of space transactions occurring in the world space economy.
The remainder of this paper is structured as follows. Section 2 presents the characteristics of the space economy and identifies current trends in its evolution. Section 3 describes the database (including data sources and analysis) and the categories used in this article to elaborate on the empiri-cal analysis of recent trends in the evolution of the world space economy. Section 4 explores how space industries evolve within major space Nations: the United-States of America, the Russian Federation, the European Union, and the People’s Republic of China. Considering total spacecraft launched from 2000 to 2013, it is argued that the world space economy is globally and progressively transforming towards a more balanced market structure, an increasing level of internationalisation and a growing weight of com-mercial versus non-comcom-mercial applications. However, significant differ-ences remain between major space Nations. Clearly, there no such thing as a unique transformational path followed by space economies at a national level, each Nation following its own path. The last sections draw on the main implications of the case study, and give final comments regarding future research agenda.
1. This contribution does not investigate the dynamics affecting ground stations’ and launchers’ market segments of the space economy.
CHARACTERISTICS OF THE SPACE ECONOMY
AND ITS CURRENT EVOLUTION
Space products and services (see Box 1) basically differ from economics textbooks’ definition of normal goods for which perfect competition might operate. Launching facilities, ground stations and launch vehicles are gov-ernment infrastructures that belong to the category of quasi-public goods for which public investments are required. Similar to weapon systems, nuclear power plants, passenger aircrafts, banking automation systems, or air-traffic control technology, space technologies can thus be classified as complex products systems (CoPS, Hobday, 1998). According to Davies et al. (2005), CoPS’ market structures can be characterised by the following features:
1. Highly concentrated demand and supply structures (e.g., oligopoly, monopsony).
2. Few large transactions.
3. Direct government regulation and administration of transactions. 4. Negotiated prices between suppliers and customers.
5. Imperfect competitive interactions among economic agents.
Box 1 – Empirical facts on the global space economy
According to the Satellite Industry Association (SIA, 2015), the global space economy turnover grew by one percent from 2013 to 2014, reaching a new record of 322.7$ billions. More than 60% of the world space economy turnover came from the satellite industry alone, including satellite services, manufacturing, launching facilities and ground stations. During the last ten years, the global satellite industry revenues increased by a factor of 2.3, from 89$ billions in 2005 to 203$ billions in 2014. Last year, in Europe, space industry revenues indicated a significant growth of 7.5% from 2013 to 2014, with the space manufacturing industry sales reaching 7.25€ billions (ASD, 2015). By and large, the space economy represents 5% of the global aerospace and defence (A&D) businesses. The U.S. market share represents 43% of the world space economy.
Do space market structures share these characteristics? The answer is positive. Indeed, few companies are capable of developing and assembling large spacecraft and satellite platforms including various optical, robotic, and electronic and communication payloads. Top companies like Thales Alenia Space, Airbus Defence & Space, and OHB in Europe, and Lockheed-Martin, Boeing, and Space Systems/Loral in the United-States, dominate the global market for large spacecraft and satellites. Industrial structures are thus highly concentrated. In addition, unit costs are habitually high and acquisition
life-cycles on which space technologies rely are very long2, and this in turn
contributes to limiting the number and frequency of market transactions. A majority of spacecraft is produced in small series for very specific clients, in particular the military and government space agencies. The space industry belongs to that particular class of demand-driven industries. Exploring the role of demand in technological and industrial change led researchers to posit demand as a major source of information for firms to adapt technol-ogy to market needs. Research questions investigated by demand-oriented approaches are merely concerned with the nature and logic governing the adoption and dissemination of innovations, with a particular emphasis on the direct effect of customer heterogeneity on industrial structures and mar-ket segmentation. In particular, researchers have focused on the relationship between the size, growth and diversity of customer needs and the dynamics of industry (Adner, Levinthal, 2001; Adner, 2003; Malerba et al., 2007). In this line of research, demand is commonly represented by innumerable individual customers who express distinct preferences as to the tradeoffs between the quality and price of the technology. Such a representation does not fit the characteristics of the space industry. In fact, since its inception in 1957, the space industry has been totally dominated by government cus-tomers, mainly national space agencies (e.g. NASA), defence acquisition agencies (e.g. DGA), and military services (e.g. U.S. Air Force). In a recent paper, Barbaroux et al. (2013) provided evidence that military customers had been capable of directing the introduction of all major applications of space technology, including remote sensing, navigation, manned and unmanned spaceflight, earth observation, science and technology (S&T), and communication. The authors observed that government customers accounted for two-thirds of all satellites launched between 1957 and 2011 (Barbaroux et al., 2013). Until recently, profit-oriented rationality and com-mercial motives did play a minor role in shaping the dynamics and structure of space industries. As Hiriart et al. (2010) explained, “it is fair to say that the space industry was enabled by, and grew because of, the institutional customers, not commercial market forces” (Hiriart et al., 2010).
It results that the world space economy exhibit high levels of concentra-tion on both supply and demand sides. Naconcentra-tional markets for space tech-nology are also characterised by government rule-based barriers to entry. Markets are directly ruled out by government policies, notably in the U.S.
2. The life-cycle of a spacecraft includes various development phases: formalisation of users’ need, realisation of feasibility studies, R&D, validation of concepts, tests and experimentations, production and exploitation of systems, withdrawal and, eventually, recycling. As an illustra-tion, the test and experimentation phases before delivering a large satellite to the client takes 6 up to 10 months to be fully accomplished.
where space technology transfer is tightly controlled by the U.S. administra-tion. Direct government regulation of space activities is a key characteris-tic of world space ‘economy: space technology is considered as a strategic asset for national defence and security purposes. Although space companies became privatised and entrepreneurial opportunities emerged during the last two decades, transactions are still ruled out by government customers’ needs, political interests, and public regulations. But the time has come for a change. Although military and institutional orders still represent a significant share of total spacecraft launched yearly, it has been observed that major sources of revenue currently come from commercial applications of space technol-ogy (e.g. communication, navigation, and earth observation). At the end of 2002 for example, 83% of total revenues generated by space-related busi-nesses came from communication applications which are heavily dependant upon commercial interests expressed by private companies (Shove, 2005). This clearly indicates the increasing role played by commercial motives and non-government actors in the development of space industries. As Kreisel
et al. (2007) simply put it, “space business has evolved from its early
non-commercial market foundations, dominated by government procurement, into a major commercial industry based on a mix of industrial and consumer markets”. Building on financial data, evidence is thus provided that space industries would be on the path towards becoming more civilianised and commoditised.
According to Whitney (2000), one of the explanations for this change is that space markets have been evolving through a progressive process con-sisting in opening-up the structures and regulatory frameworks on which they rely. Three stages would thus make up the evolutionary path followed by space markets: centralised, decentralised and distributed. During the cen-tralised stage, Whitney indicated that space transactions had been under the central control of governments, core industry groups, and heavy technology (Whitney, 2000). Commercial services and applications were only nascent businesses that were both economically and technologically immature and underdeveloped. This period clearly corresponded to the first two decades (1957-1975) of the evolution of space industries in major space Nations (Barbaroux et al., 2013).
The second stage was marked by technological changes supporting the diffusion and commoditisation of goods and services, first on a regional and national basis, then on a multinational scale. Major technological changes affecting the structure and development of space industries included advances in payloads’ miniaturisation (Petroni, Santini, 2012) and innovation in ground stations’ capabilities. Space systems slightly became smaller, cheaper, and lighter than inherited technology (Whitney, 2000). A cheaper access
to satellite communication services enabled the development of promising business opportunities (e.g. mobile telephony, broadcasting), triggered the creation of multinational organisations in charge of commercialising space assets (e.g. EUTELSAT in Europe, INSAT in India) and induced an altera-tion of space regulaaltera-tion and policy frameworks (e.g. ITAR revisited).
Finally, space industries entered the distributed stage when multiple domestic consortia and/or international groups start competing for com-mercial markets. At this stage, the level of openness of industries became higher, both geographically (e.g., emergence of new space Nations) and economically (e.g. international competition between private companies and growth of the space business ecosystem). The diffusion of technology to other industries was further facilitated by technological innovation, deregu-lation and privatisation of national telecommunication networks (Whitney, 2000). This is what happened in space industries in the early 1990’s and after. As an illustration, INTELSAT and EUTELSAT moved from a central-ised cooperative multinational entity to a privately owned and decentralcentral-ised company in 2001. At the same time, manufacturers created private com-panies through spin-offs (e.g. Boeing and Lockheed Martin space vehicle’s capabilities merged to create United Launch Alliance), and aimed at intro-ducing large-scale production and marketing techniques to maintain and expand their competitive advantages. National space agencies also created private companies to exploit commercial opportunities (e.g. CNES created Arianespace to develop commercial businesses). In addition, a number of traditional space assets (e.g. launchers and space vehicles) have matured enough to induce a significant reduction of operational costs and techni-cal risks, triggering the emergence of entrepreneurial firms investing private resources in commercial applications of space technology (e.g. space tour-ism, road and maritime transport, fleet management, precision agriculture, mining etc.).
A recent report of the Space Foundation indicated that “downward
pressure on launch prices and cost-saving advances in satellite technology have combined to open the door for small and midsize companies to enter the mar-ket, providing new niche services an solutions to a growing number of custom-ers” (Space Foundation Report 2014). Finally, the future launch of satellite
constellations made up with hundreds of spacecraft (e.g. Oneweb) is likely to alter space companies’ production function3. The later is largely based
3. Today, the Iridium constellation is one of the largest communication satellites network in operation. It is made up with 81 satellites. The Oneweb constellation project shall be made up with 900 small-sized satellites operating at Low-earth Orbits (LEO) and providing individual customers with global Internet broadband services. Oneweb should be fully operational in 2020.
on craftwork with companies producing 4 to 5 large satellites on a yearly basis, essentially for single customers. By decreasing spacecraft unit costs and reducing the time scales for development, test and experimentation, large-scale satellite constellations open ways to larger production techniques similar to those applied in the aeronautics industry for example.
The purpose of this article is to investigate whether or not the quanti-tative data regarding the total volumes and technological applications of spacecraft launched during the last fifteen years are in line with the above description. Is the world space economy on the path towards being domi-nated by non-government and private organisations that interact in a global and open market for space products and services? Is this transformation homogeneous among space Nations? Next sections develop a case study that aims at answering the above questions.
METHODOLOGY
Our research strategy first consists in identifying the major trends charac-terising the world space economy. Civilianisation, commoditisation and internationalisation of space-related transactions all refer to these major trends. Then, if the space economy is on the path towards transforming into a more open, civilianised and commoditised market then it should – to some extent – exhibit three stylised facts: (i) a balanced distribution of spacecraft ordered by government versus non-government customers (i.e., civilianisa-tion of the space economy), (ii) a significant share of commercial versus non-commercial applications (commoditisation of the space economy), and (iii) a positive level of openness of its market structures (i.e., internationali-sation of the space economy). Three empirical regularities therefore must be observed. Our objective is to collect and analyse data related to total space-craft launched during the last decade in order to provide evidence whether or not the world space economy exhibits these regularities.
Data sources and analysis
This contribution builds on a database elaborated by the author4 that
con-tains data on all spacecraft launched worldwide between January 2000 and December 2013. We focused on this period since the objective of this article
4. The author would like to thank Camille Bougerol, Florent Burgos and Nicolas Chinbaud (students at the French Air Force Academy) for their support in collecting and structuring the original database.
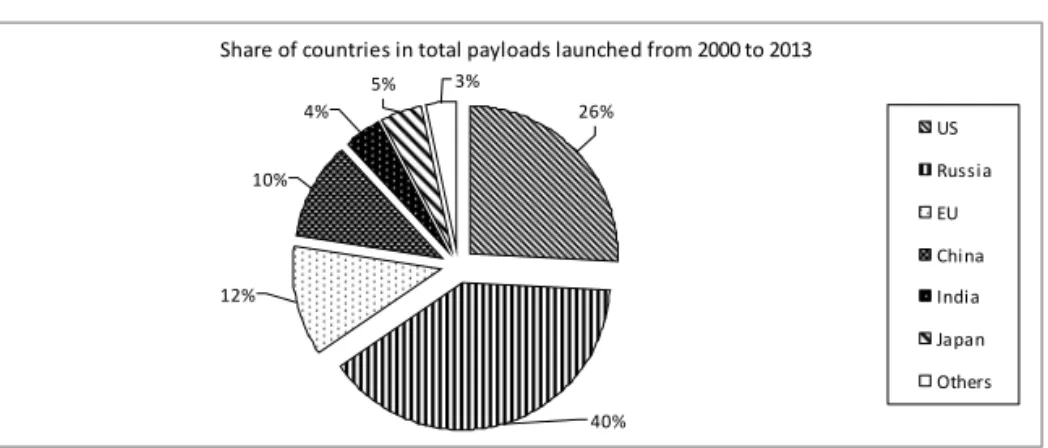
is to explore the current properties of the world space economy. A particular attention has been paid to four major space Nations, namely those that pos-sess domestic launch facilities: the United-States of America, the People’s Republic of China, the Federation of Russia, and the European Union. Altogether, the four major space Nations account for 88% of total space-craft launched during the 2000-2013 period (cf. Figure 1). Other Nations which also have domestic launch facilities such as India, Japan, Israel, Iran, North Korea or South Korea have been documented in the database but not studied at length.
Figure 1 – Spacecraft launched per space Nations (2000-2013)
Collected data are concerned with launched spacecraft, including space probes, capsules, spaceships and artificial satellites considered as the carrying capacities of launch vehicles. Data on ground stations and launch vehicles have been excluded from the present contribution. Data sources include a variety of amateurs’ (e.g. www.skyrocket.de) and institutional websites (e.g. NASA, ESA, Roskosmos) that keep records of any publicised space-craft launched anywhere in the world. The above sources of data have been completed by professional (e.g. Jane’s Defence weekly), industrial (e.g. space companies’ web sites) as well as academic publications (e.g. Space policy) on space technology and industry. As a consequence, the data related to each and every spacecraft launched during the period under scrutiny have been cross-checked through the consultation of various sources.
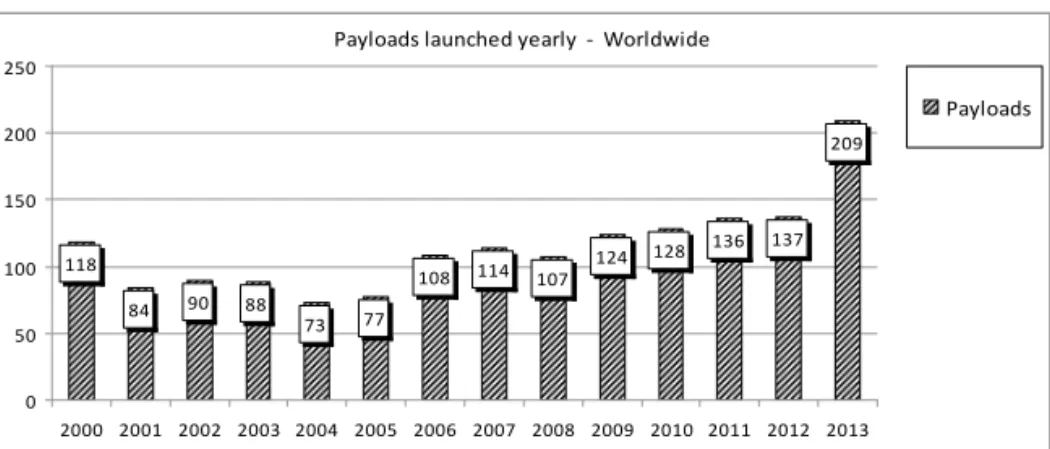
For the purpose of this study, we collected data on over 1593 spacecraft launched between 2000 and 2013 (including failed launches) (cf. Figure 2). We focused on the payloads incorporated in spacecraft, artificial satellites and space probes. The payload constitutes the technological component which gives a particular spacecraft its functionality which is called the
Share of countries in total payloads launched from 2000 to 2013 26% 40% 12% 10% 4% 5% 3% US Russia EU China India Japan Others
application. Payloads and spacecraft are closely related since they are often developed and assembled by the same companies (e.g. Thales Alenia Space, OHB, Boeing, Airbus Defence & Space, Space Systems/Loral, and Lockheed Martin). These companies aim at fulfilling very particular customers’ need. The customer is often called the operator. Sometimes, the payload (e.g. an optical device) is developed by the operator itself (e.g. a university or a research laboratory) before being integrated by the manufacturer. However, what is important for our purpose is that depending on the identity of the customer and the technological functionality of the payload(s) incorporated in spacecraft one is capable of discriminating between and classifying hun-dreds of spacecraft that are launched yearly.
Figure 2 – World-wide total launches (2000-2013)
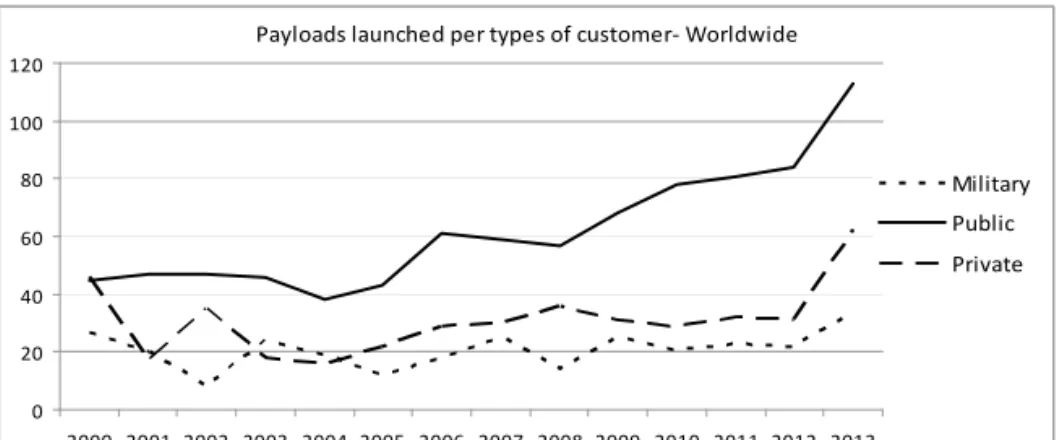
For each spacecraft documented in our dataset, we collected its launch date, the identity (and nationality) of the customers (operators) and finan-ciers, the corresponding application, and the geographical site from which it has been launched. Our analysis therefore is focused on the demand side of the space market. Basically, the later is dominated by three types of tomers: Military, Institutional and Commercial (McDougall, 1982). A cus-tomer’s type refers to its legal identity as a “consumer” of space technology. Military customers correspond to Departments of Defence, Defence acquisi-tion agencies, military services, and military educaacquisi-tion and research labora-tories. Institutional customers can be separated into two groups: government (e.g. space agencies, public research laboratories) and non-government (e.g. amateurs, private universities). Commercial customers mainly designate private companies (e.g. telecommunication firms) and privatised multina-tional cooperative organisations (e.g. INTELSAT and EUTELSAT). Since customers have unique motivations, missions, competences and industrial
Payloads launched yearly ‐ Worldwide 118 84 90 88 73 77 108 114 107 124 128 136 137 209 0 50 100 150 200 250 2000 2001 2002 2003 2004 2005 2006 2007 2008 2009 2010 2011 2012 2013 Payloads
facilities, it follows that they are likely to demand fo, and eventually partici-pate in the development of different applications of space technology. When more than one single type of customer financed the launch (i.e., mixed cus-tomers), we decide to consider the principal investor (and operator) as the prime customer (cf. Figure 3).
Figure 3 – Volumes of spacecraft launched worldwide per type of customers (2000-2013)
In addition, when spaceraft have been launched from a given domestic launch facility (e.g., Baïkonour in Russia, or Cape Canaveral in Florida) but funded by a non-domestic customer (e.g. a Japanese telecommunication company), we consider the launch site as its main attribute, but we also kept record of the customer’s nationality in order to estimate the relative weight of domestic versus non domestic satellites launched and funded by each space Nation. This, in turn, provides indications regarding the level of internationalisation of national space economies.
Space technology applications
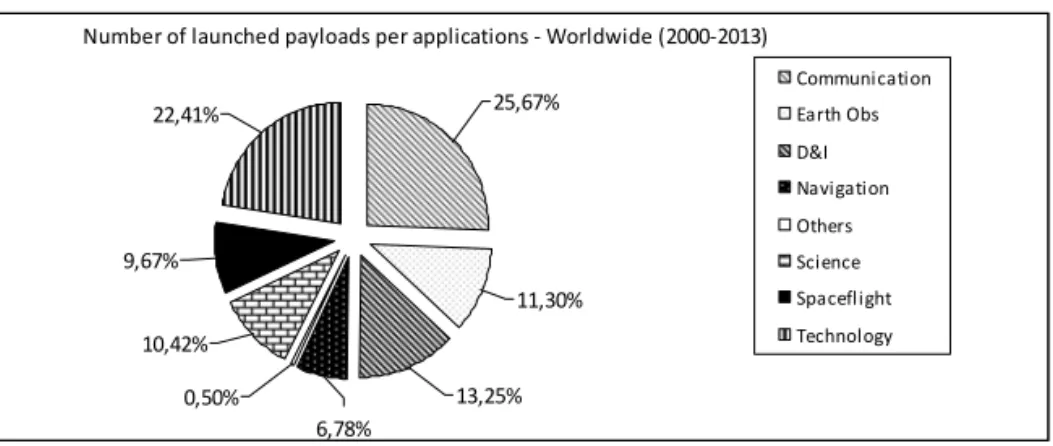
Seven distinctive applications have been considered in this contribution5:
Transportation, Communication, Science, Technology, Navigation, Earth observation, and Defence and Intelligence (cf. Figure 4).
1. Transportation applications include manned and unmanned spaceflights, including cargo and crew transports, in particular for
5. Hiriart et al. (2010) identified 17 categories of spacecraft which they classified into three major applications: Defence and Intelligence (including Navigation, Intelligence, Weapon sys-tems etc.), Science (including Earth Observation), and Communication.
Payloads launched per types of customer‐ Worldwide 0 20 40 60 80 100 120 2000 2001 2002 2003 2004 2005 2006 2007 2008 2009 2010 2011 2012 2013 Military Public Private
the purpose of resupplying the International Space Station (ISS). ISS cargo resupplying missions account for 9.67% of total spacecraft launched from 2000 to 2013. However, the opportunities openned by the transportation of civil passengers at Low-Earth Orbits (LEO) is likely to foster the development of this application in the short run. 2. Communication applications designate any kind of spacecraft, notably artificial satellites, that enable the transmission of data and information on a variety of supports; they contribute to the develop-ment of information and communciation technologies (ICT), media and broadcasting industries. Communication applications consti-tute major parts of all commercial space activities, and account for 25.67% of total spacecraft during the 2000-2013 period. After the burst of the “dot.com” bubble in the early 2000’s, communication applications’ development slew down, before recovery happened in the mid-2000’s.
3. Science applications refer to any spacecraft launched for the pur-pose of supporting the development of scientific knowledge; examples of scientific activities include outer-space explorations (Peter, Stoffl, 2009), but also non-space activities like biotechnology or agronomy (Chengzhi, 2011). They represent 10.42% of total satellites launched between 2000 and 2013.
4. Technology applications correspond to any spacecraft launched for the purpose of experimenting with novel space technology (e.g., robotics and automated systems). They account for 22.41% of total spacecraft launched from 2000 to 2013. Parts of technology appli-cations are profit-oriented and privately funded, but the majority of technology-related space activities is non-commercial and operated by government organisations (e.g., national space agencies).
5. Navigation applications aims at providing geo-spatial positioning services (Positioning, Navigation and Timing, PNT) for the purpose of locating a broad range of moving objects such as aircraft, boats, and cars (e.g., Global Positioning System, GPS). Navigation satellites include both commercial (e.g., Location-Based Services such as smart-phones; Personal Navigation Devices) and non commercial applica-tions (e.g., military Intelligence, Surveillance and Reconnaisance services, included in the D&I application). Civil navigation applica-tions account for 6.78% of total spacecraft launched during the past decade6, but grow at a faster pace than the global space economy.
6. Military navigation payloads have been classified into the D&I category.
Figure 4 – Distribution of spacecraft per applications – Worldwide (2000-2013)
6. Earth observation applications mainly designate remote sensing capabilities and distant, on-orbit, earth surveillance, in particular for the purpose of meteorological forecasting (Lodgson, 2011; Morel, 2013). Globally, earth observation market segments encompass com-mercial (e.g., urban, mining, insurance, traffic management, agricul-ture, fleet management) as well as non-commercial applications (e.g., disater management, meteorology, military remote sensing). They account for 11.3% of total spacecraft launched from 2000 to 2013. Earth observation commercial markets evolve jointly with communi-cation and navigation applicommuni-cations to provide decision-makers from a variety of businesses (e.g., agriculture, fisheries, energy, transport and communication infrastructure, insurance, news and media) with critical information. Alike navigation and communication segments, earth observation applications are expected to grow at faster pace than the rest of the space economy in the next future.
7. Defence and Intelligence (D&I) applications are supportive of defence and security policies (Buckerfield de la Roche 2011). D&I applications include intelligence capabilities (i.e., electronics intelligence, imagery intelligence, radar intelligence), communication (i.e., command and control, C²), earth observation (i.e., remote sensing), navigation (i.e., tracking and targetting), and aerospace ballistic missiles (ABM). They represent 13.25% of total spacecraft launched between 2000 and 2013. With the exception of few launches (e.g., Israeli private/military part-nership for producing and operating military satellites), D&I applica-tions are ordered and funded by government-only military customers (i.e. armed forces, ministries of defence, defence acquisition agencies, research and education Defence organisations).
Number of launched payloads per applications ‐ Worldwide (2000‐2013) 25,67% 11,30% 13,25% 6,78% 0,50% 10,42% 9,67% 22,41% Communication Earth Obs D&I Navigation Others Science Spaceflight Technology
CHARACTERISTICS OF THE SPACE ECONOMY
IN MAJOR SPACE NATIONS (2000-2013)
Next sections start by studying the characteristics of space markets within major space Nations (e.g., the U.S., the E.U., Russia, China, India and Japan) during the 2000-2013 period. Attention is first paid to the evolution of the relative share of total spacecraft ordered by military, institutional and private customers respectively. Then, research efforts are directed towards exploring the relative share of commercial versus non-commercial applica-tions. Finally, the last section aims at evaluating the level of internationali-sation of space industries by focusing on the relative share of domestic versus non-domestic spacecraft launched from 2000 to 2013.
Is the demand structure for space technology balanced?
Figure 5 depicts the distribution of total spacecraft launched per types of customers between 2000 and 2013. It is first observed that military cus-tomers ordered less than 19% of total spacecraft, while private cuscus-tomers accounted for 27%. 54% of total spacecraft have been funded by institu-tional customers, essentially by nainstitu-tional space agencies, central administra-tions other than defence & space, and universities. Among institutionally ordered satellites (867 orders), 95% has been funded by central-government agencies, the lasting 5% being funded and operated by non-government public customers, such as European and Japanese universities or German technical universities. Education and research organisations have been clas-sified as public, non-government, institutional customers, with the notable exceptions of U.S. universities which have been classified as private cus-tomers (U.S. universities are parts of the 27% of total spacecraft ordered by private customers). Finally, we estimated that government-only customers accounted for 70% of total spacecraft launched between 2000 and 2013, and non-government – both private and public – customers accounted for 30% (cf. Figure 6).
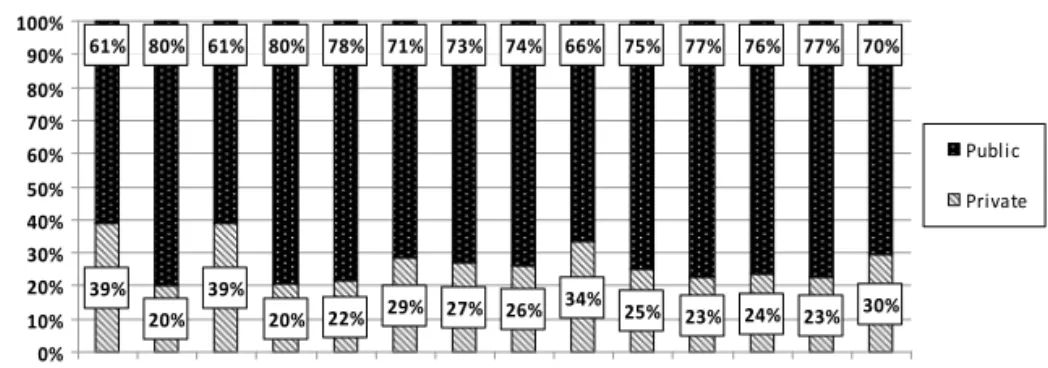
Interestingly (cf. Figure 6), privately funded spacecraft exceeded both military and institutional funded spacecraft, once in fourteen years: in 2000. This “peak” in space commercial activity, representing almost 40% of total spacecraft launched, coincided with the zenith of the “dot.com” bubble that involved high volumes of spacecraft orders from ICT sectors. Finally, with the notable exception of 2002, private customers’ orders accounted for one-quarter to one-third of total spacecraft since 2005.
Figure 5 – Distribution of spacecraft launched per types of customer (2000-2013)
Figure 6 – Evolution in percentage of public versus private orders in total spacecraft (2000-2013)
One cannot conclude by examining the evolution of total spacecraft launched between 2000 and 2013 that space industries are progressively relying on a balanced, 50/50, market structure between public and private customers. However, evidence is provided that space industries are not military-dependent any more, civil customers accounting for 81% of total spacecraft launched during the 2000-2013 period. In addition, since 2005, space industries’ global market structure achieved stability with a distribu-tion of government versus non-government spacecraft that equals 70/30 on average. Number of payloads funded per types of customer ‐ Worldwide (2000‐2013) 18,33% 54,43% 27,24% Military Institutional Private Private vs Public payloads launched ‐ Worldwide (2000‐2013) 39% 20% 39% 20% 22% 29% 27% 26% 34% 25% 23% 24% 23% 30% 61% 80% 61% 80% 78% 71% 73% 74% 66% 75% 77% 76% 77% 70% 0% 10% 20% 30% 40% 50% 60% 70% 80% 90% 100% 2000 2001 2002 2003 2004 2005 2006 2007 2008 2009 2010 2011 2012 2013 Public Private
Are space industries commoditised?
To estimate the level of commoditisation of space industries, one should discriminate between commercial and non-commercial spacacraft launched per applications. Basically, commercial applications include communi-cation and, to some extent, earth observation and navigation, and non-commercial applications are associated with D&I, transportation, science, and technology applications. However, frontiers between commercial and non-commercial applications are getting blurred. Novel entrepreneurial opportunities emerged within traditional non-profit, non-commercial, government-only space activities. For example, space transportation busi-nesses have become increasingly attractive for private investors (e.g. the Space Exploration Technologies Corporation, SpaceX, resupplying the ISS); in the same vein, research institutions are increasingly involved in the valorisation of space-related knowledge, and utilisation of the space milieu for Research and Technology (R&T) experimentations. It has also been acknowledged that Defence & Intelligence (D&I) space products and services rely more heavily on commercial space sectors, particularly in the U.S. It is therefore (very) difficult to identify clearcut delimitations between commercial and non-commercial applications of space technology by focusing on spacecraft launched per applications. In addition, custom-ers’ types provide incomplete information since a number of government, institutionally funded spacecraft aim at supporting the development of commercial businesses. The U.S. government space agency (NASA) for example, decided to promote the expansion of the transportation segment through direct funding of commercial companies. The program, called Commercial Crew Program (U.S. Government Accountability Office, 2014a) aims at stimulating private-sector interest in providing commer-cial space transportation capabilities which might be critical for the U.S. economy7 (U.S. Government Accountability Office, 2014b). There are
many other examples of publicly funded commercial activities, in par-ticular in the communication, navigation and earth observation markets. Commercial communication satellites are very oftenly funded and operated by national and/or multinational government agencies, such as Insat in
7. Both entrepreneurial firms such as SpaceX, and large aerospace and defence companies such as Boeing participate in this program. SpaceX received 460$ millions from NASA to develop the Dragon-Rider project, while Boeing was awarded a 480$ millions R&D contract for developing the CST projects. Each projects aim at experimenting with novel technological solutions (e.g. capsule, reusable launch vehicles) to enable cargo and crew transportation from low-Earth orbit (LEO).
India, NigComSat in Nigeria or Intelsat (before 2001), thus complement-ing the investments made by private companies.
In order to make things simple, this contribution assumes that D&I applications are fundamentally non-commercial (we do not consider “oth-ers” applications since they only represent 0.5% ot total spacecraft launched during the period). Six categories of applications are thus capable of gen-erating profit-oriented, commercial products and services: communication, navigation, earth observation, science, technology, and transportation. To evaluate the relative share of commercial versus non-commercial applica-tions in total launches, we start by studying customers’ types (cf. Figure 7). This provides a first basis for discriminating between commercial and non-commercial spacecraft launched during the 2000-2013 period.
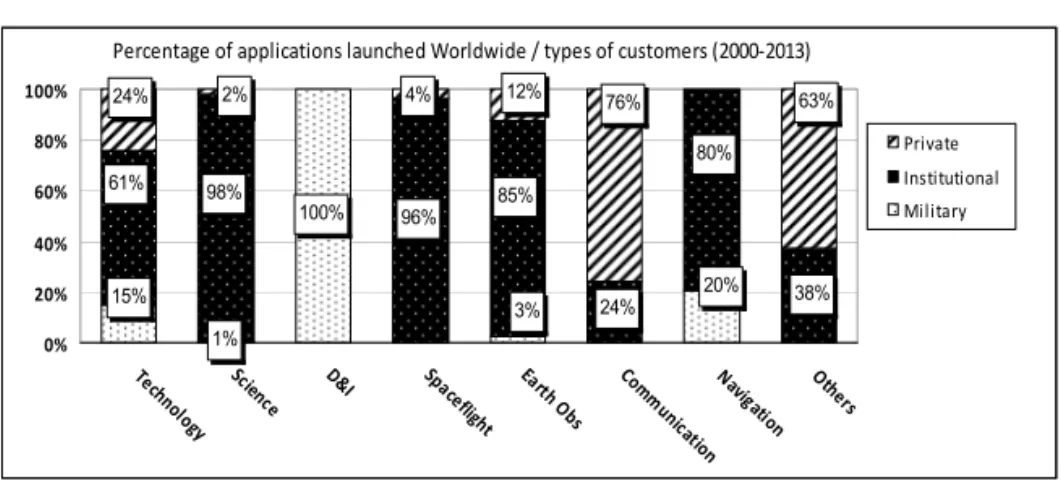
Figure 7 – Percentage of applications per types of customers (2000-2013)
Figure 7 provides evidence that science and technology applications are significantly funded by private customers (26%) and military organisations (16%). However, the majority of privately funded spacecraft launched for the purpose of scientific and technological experimentations is ordered by private universities and research laboratories, not commercial firms. In addi-tion, the economic value generated by science and technology is not realised instantaneously. When first launched, these technologies are basically non-commercial. We shall assume that the percentage of commercial satellites in the technology segment is null during the 2000-2013 period. We are aware that this assumption leads to underestimate the real quantitative share of commercial spacecraft, science and technology applications accounting for one-third of all the satellites, space probes, capsules and spaceships launched during the 2000-2013 period.
Percentage of applications launched Worldwide / types of customers (2000‐2013) 1% 100% 96% 15% 3% 24% 20% 38% 61% 98% 85% 80% 76% 63% 2% 24% 4% 12% 0% 20% 40% 60% 80% 100% Tech
nology Science D&I Spaceflight Earth Obs Commun ication
Nav
igation Others
Private Institutional Military
By contrast, communication applications are massively ordered by private companies (76%) that basically express commercial motives. In addition, when communication applications have been ordered by public institutions (e.g., Insat), they also aim at achieving commercial objectives. We thus con-sider that 100% of total spacecraft belonging to the communication seg-ment is commercial (please note that military communication spacecraft are already classified into the D&I application).
We now turn to the remaining applications capable of supporting com-mercial activities, namely transportation, earth observation, and navigation. Commercial activities in space transportation are heavily dependent upon the advance of suborbital reusable vehicles (SRV). The U.S. Federal Aviation Administration (FAA) identified eight distinct commercial markets SRVs could (potentially) address (FAA, 2013): human spaceflights, basic and applied research, aerospace technology test and demonstration, media and public relations, education, satellite deployment, remote sensing, and point-to-point transportation. With the notable exception of human spaceflights, other market niches are already classified into science, technology, commu-nication and earth observation applications. During the 2000-2013 period, only 7 launches corresponded to commercial human spaceflights. The fore-going accounted for 4.72% of total transportation activities, while 95.28% corresponded to ISS assembling and resupplying non-commercial missions.
Earth observation (EO) applications are massively ordered and operated by institutional customers (85%). But a significant percentage of total earth observation applications (12%) have been funded by private customers (e.g., imagery private companies such as Spot Image or ImageSat). We con-sider this percentage as a first basis for the purpose of estimating the weight of commercial applications within the earth observation market segment. This estimation must be consolidated through the integration of institution-ally funded spacecraft that support commercial activities. However, such an estimation is delicate. Among institutionally funded earth observation sat-ellites, we observe that 30% corresponds to meteorology applications, the latter being mostly non-commercial (if not, meteorology spacecraft would be operated by private customers and taken into account in the 12% share quoted above). In addition, for some countries, it has been very difficult to discriminate between institutional and military EO customers. As an illus-tration, 55% of all Chinese institutionally funded earth observation space-craft are – or are suspected to be – military spacespace-craft. They have not been integrated to Chinese D&I payloads (should they?) because of the insti-tutional ambiguity characterising China’s space economy. Anyway, many navigation spacecraft have already been classified as D&I (e.g., IMINT) or science applications (e.g., Earth science) in our database. By and large, we
estimated that the percentage of commercial EO spacecraft launched during the 2000-2013 equals 35% of total EO spacecraft.
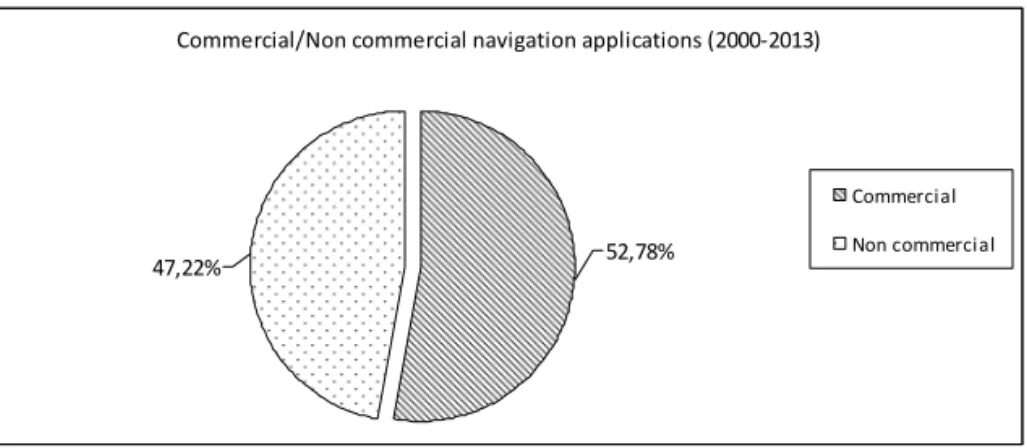
Finally, regarding navigation applications, 20% of total spacecraft has been ordered by military customers, and 80% from institutional custom-ers. Similar to earth observation applications, a significant share of insti-tutionally funded navigation spacecraft support the development of Global Navigation Satellite Systems (GNSS) commercial applications within a variety of industries (e.g., land and maritime transport, traffic management, mining, etc.). Pham (2013) estimated that during the period 2005-2010, the U.S. Global Positioning System (GPS) market – that is the world lead-ing navigation infrastructure- originated 25% of revenues from commercial equipement sales, 59% from non-commercial, civil applications, and 16% from military clients. Compare with the U.S. navigation system, other space Nations’ GNSS commercial applications are less developped. The European GNSS Agency (2013) estimated that only 20% of receivers are compatible with China’s “Beidou” GNSS for example. That percentage reached 30% for the European “Galileo” GNSS. Russian “GLONASS” navigation sys-tem, the second constellation of choice after GPS, is also heavily dependent upon government-only customers, but commercial applications are highly encouraged by Russian space authorities. As an illustration, the transport segment now represents 50% of total GLONASS commercial revenues with 2 millions of vehicles being equiped with GLONASS navigation com-patible devices (Kupriyanov, 2014). However, GLONASS interoperable equipments did not exceeded 50% of the market for receivers in 2013. As a consequence, to evaluate the volume of commercial navigation spacecraft launched between 2000 and 2013, we have multiplied the number of GPS, GLONASS, Galileo and Beidou spacecraft by the percentage of receivers that appear compatible with each system respectively. Results are presented in Figure 8.
Are space industries getting commoditised? Table 1 summarises the distribution of commercial versus non-commercial spacecraft for the com-munication, earth observation, navigation and transportation applications. Commercial applications accounted for 1/3 of total spacecraft launched dur-ing the 2000-2013 period8. It means that 33.65% of total spacecraft launched
engendered on average 80% ot total revenues of the space economy (in 2013,
8. Note that this estimation is superior to the percentage of spacecraft launched by private customers (i.e., 27.24%, see Fig. 5). Furthemore, since our estimation of the relative share of commercial space spacecraft launched does not take into account both science and technology applications (i.e., accounting for one third of total spacecraft), its true value certainly exceeds 33.65%. In our opinion, 38% to 40% is a realistic approximation.
76% of the global space economy turnover was dependent upon commercial space products and services, infrastructure and support activities; The Space Foundation Report, 2014, p. 4). Not surprisingly, 76% of total commercial spacecraft launched from 2000 to 2013 belongs to the communication mar-ket segment.
Figure 8 – Estimation of commercial versus non-commercial navigation spacecraft (2000-2013)
Table 1 – Percentage of commercial applications in total spacecraft (2000-2013) – Worldwide
Communication Earth Observation Navigation Transportation Total Spacecraft 409 180 108 154
Commercial spacecraft* 536 (33.65% of total spacecraft) Non-commercial spacecraft** 1057 (66.35% of total spacecraft)
*Commercial spacecraft (% of total spacecraft per application) include communication applications (100%), earth observa-tion (35%), navigaobserva-tion (53%), and transportaobserva-tion (5%).
**Non-commercial spacecraft (% of total spacecraft per application) include D&I (100%), science (100%), technology (100%), others (100%), earth observation (65%), navigation (47%), and transportation (95%).
Are space industries opening-up?
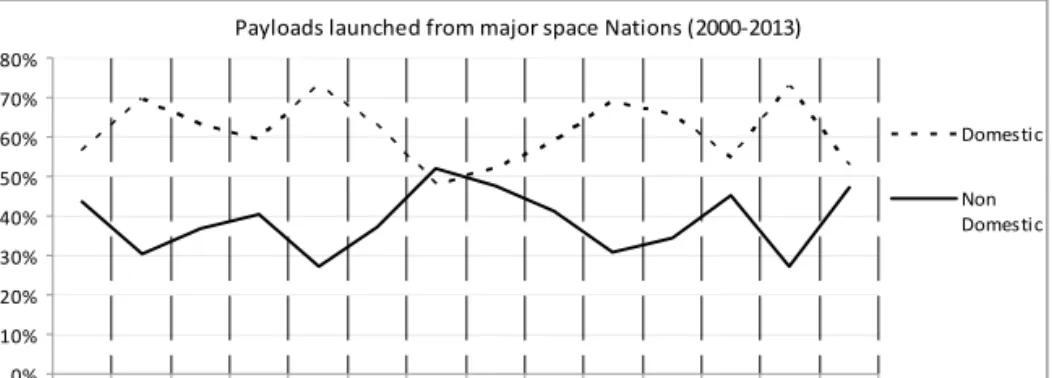
Figure 12 presents the evolution in percentage of domestic versus non-domestic spacecraft launched by the four major space Nations during the 2000-2013 period: the U.S., the E.U., Russia, and China. On average, 39% of total spacecraft have been ordered by non-domestic customers, reflect-ing a high degree of internationalisation of transactions. Non-domestic orders exceeded domestic ones in 2006, and a 50/50 equilibrium has been
Commercial/Non commercial navigation applications (2000‐2013)
47,22% 52,78%
Commercial Non commercial
approached in 2007, 2011 and 2013. The share of non-domestic spacecraft in total spacecraft launched did not reach the 30% threshold only twice in 2004 and 2012.
Figure 9 – Domestic versus non-domestic transactions
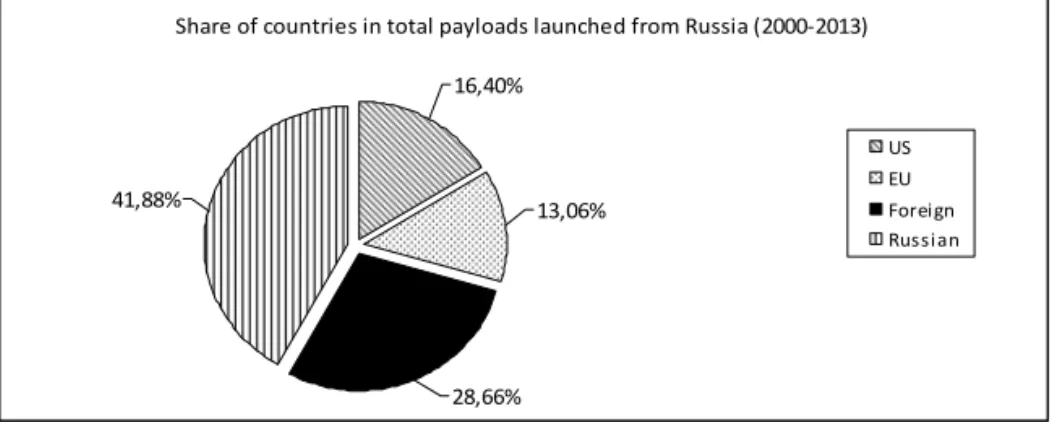
Beyond the global 60/40 distribution of domestic versus non-domestic orders, national circumstances exhibit sharp contrasts. The Russian space industry is very sensitive to non-domestic customers (cf. Figure 10). 58% of total spacecraft launched from Russian launch facilities (e.g. Baïkonour, Plesetsk, Dombarovskiy AB, Kasputin Yar, Svobodniy) has been ordered by foreign customers. One should therefore consider that the Russian Federation is akin to offer its launch facilities to the world, in particular to foreign private telecommunication companies. Interestingly, 50% of all privately funded spacecraft launched from Russia has been ordered by U.S. companies. A recent report of the U.S. GAO (2014b) pointed to high insur-ance costs in the U.S. that hamper privately funded satellites to be launched from domestic facilities. Only 6% of Russian privately funded spacecraft have been ordered by domestic customers. 17% has been ordered by European companies, and 26% by other Nations’ private firms. In addition, 50% of total institutional spacecraft launched from Russia has been ordered by non-domestic customers, with European agencies and universities accounting for 25% and other Nations for 74% (note that U.S. customers accounted for less than 1% of total institutional spacecraft launched from Russia).
The E.U. space industry’s structure is very similar to the Russian since almost 48% of total spacecraft launched from European launch facilities (i.e. Kourou) has been ordered by U.S. and other Nations (Russian customers did not ordered any launch from the E.U.). Interestingly, the distribution of privately funded spacecraft launched from the E.U. per types of customer,
Payloads launched from major space Nations (2000‐2013) 0% 10% 20% 30% 40% 50% 60% 70% 80% 2000 2001 2002 2003 2004 2005 2006 2007 2008 2009 2010 2011 2012 2013 Domestic Non Domestic
is well balanced: 28.57% of all privately funded spacecraft (and spacecraft) has been ordered by U.S. private companies, 33.04% by other countries, and 38.39% by European companies. Finally, 61.4% of spacecraft funded by institutional customers have been ordered by European organisations and 38.6% by foreign institutions (note that U.S. and Russian institutional cus-tomers did not order any launch from the E.U. out of multinational, coop-erative partnerships).
Figure 10 – Domestic versus non-domestic spacecraft launched from Russia (2000-2013)
The European and Russian space economies are in contrast with the U.S. and Chinese. These two major space Nations are indeed very insensitive to non-domestic investors. Surprisingly, the U.S. have the same distribution of domestic versus non-domestic orders as China: 92% of total spacecraft launched from the U.S. and Chinese launch stations has been ordered by domestic customers, with a majority of orders coming from government-only customers (i.e., military and institutional). We could have expected that the level of internationalisation of the U.S. domestic space economy would have been greater than the Chinese. But while Chinese customers are quasi-exclusively launching spacecraft from China (i.e., Taiyuan, Jiuquan, Xichang), a significant share of U.S. privately and institutionally funded spacecraft has been launched from Russian and, to some extent, European launch facilities. Indeed, U.S. customers (whatever their types) ordered 538 spacecraft during the 2000-2013 period (accounting for 33.7% of total space-craft launched worldwide). The geographical distribution of U.S. orders dur-ing the 2000-2013 period is as follows: 379 spacecraft from the U.S. territory (70%); 102 spacecraft launched from Russia (19%); 32 spacecraft launched from the E.U. (6%); 4 spacecraft launched from Japan (0.7%); and 15 space-craft launched by using Sea Launch facilities (2.7%), a multinational private
Share of countries in total payloads launched from Russia (2000‐2013) 16,40% 13,06% 28,66% 41,88% US EU Foreign Russian
company that is controlled by Russian public and private investors until 2009. In comparison to China, the U.S. space economy is more internation-alised as soon as we consider spacecraft that are funded by U.S. customers but launched from non-U.S. launch facilities. In addition, while 99% of total spacecraft launched from China have been ordered by government-only cus-tomers, the percentage of U.S. privately funded spacecraft reached 40%, exhibiting a more balanced demand structure (the remaining spacecraft funded by U.S. customers being distributed as follows: 33% by institutional customers, and 27% by the military).
IMPLICATIONS
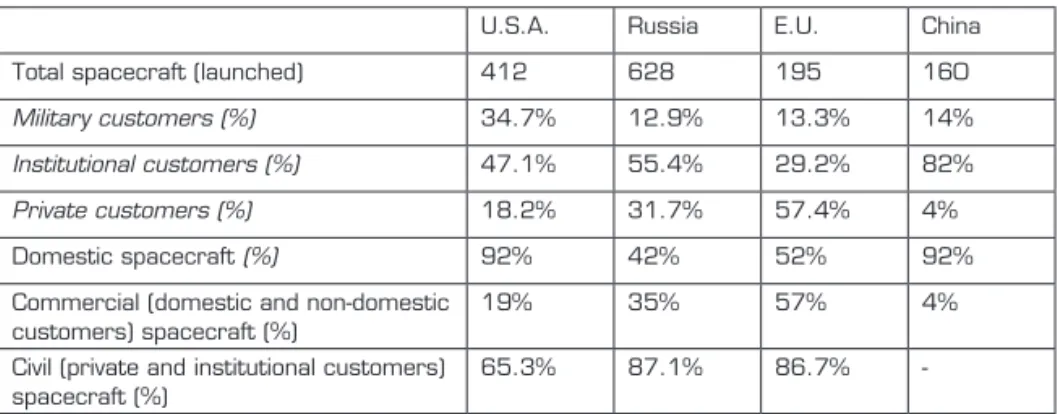
What is the answer to be brought to the question raised in this contribution? Are space industries becoming (more) open, civilianised, and /or commod-itised? Some would be tempted to answer “yes”. Indeed, at a global-level, it has been demonstrated that profit-oriented motives expressed by private and, to some extent, institutional customers are increasingly shaping the dynamics and structure of the world space economy. Evidence has also been provided that the distribution of domestic versus non-domestic spacecraft on the one hand, and of government versus non-government orders on the other hand, evolved towards getting more balanced during the 2000-2013 period. However, at a national level, descriptive statistics indicate that the shift toward a (more) balanced, commoditised, and internationalised market structure is not homogeneous among major space Nations. Table 2 summa-rises the major characteristics of space industries in the U.S., Russia, E.U., and China.
Table 2 – Main features of the four major space Nations’ industries (2000-2013)
U.S.A. Russia E.U. China Total spacecraft (launched) 412 628 195 160
Military customers (%) 34.7% 12.9% 13.3% 14%
Institutional customers (%) 47.1% 55.4% 29.2% 82%
Private customers (%) 18.2% 31.7% 57.4% 4%
Domestic spacecraft (%) 92% 42% 52% 92% Commercial (domestic and non-domestic
customers) spacecraft (%)
19% 35% 57% 4% Civil (private and institutional customers)
spacecraft (%)
65.3% 87.1% 86.7%
The first implication of this contribution is that the transformation of space industries is likely to take different forms depending on the particular national context. If one builds on launched spacecraft, then two distinctive groups among major space Nations emerge: the first group, made up with the E.U. and Russia, exhibits the features of an internationalised and commod-itised, balanced space economy; the second group, consisting of the U.S. and China, is aligned with the historical architecture of space industries, with strong asymmetries between domestic and non-domestic launches, govern-ment and non-governgovern-ment customers, and commercial and non-commercial applications. However, if attention is placed on funded spacecraft, then the world space economy changes its face. The U.S. and the E.U. space indus-tries for example, have more features in common than previously mentioned. At first glance, the U.S. and European space economies exhibit a balanced, civilianised and internationalised demand structure. As an illustration, the distribution of spacecraft between government and non-government cus-tomers is more equilibrated and stable (60/40) than in Russia and, a fortiori, in China.
The same balanced structure (60/40) is evidenced if one observes the distribution of commercial versus non-commercial spacecraft funded by the U.S. and European customers. By contrast, the Russian space economy appears less open, civilianised and commoditised than previously indicated, since the relative shares of both commercial, non-government, and privately funded spacecraft are very limited, and the volumes of spacecraft funded by Russian customers and launched from abroad, insignificant. If we now turn to military customers and their relative weight in both national and global demand structures, data analysis indicates that U.S. military organi-sations accounted for 49% of total D&I applications launched worldwide during the 2000-2013 period. At a national level, U.S. military customers ordered 37.7% of total domestic spacecraft launched from the U.S. This percentage is even superior to what has been observed in Russia. Indeed, Russian military customers accounted for 29.6% of total domestic spacecraft launched from Russian launch sites. By contrast, the E.U. space economy is more civilianised since military domestic customers represented “only” 23% of total domestic spacecraft launched from European launch facilities. However, the above percentage is similar to the U.S. if one accounts for the total spacecraft funded by all types of U.S. military customers, what-ever the nationality of the launch site. To summarise the first implication of this research, it first appears that the E.U. is the only major space Nation which space economy is altogether civilianised, internationalised, and com-mercially oriented. This is merely due to the particular political and eco-nomic context in Europe (e.g. weakness of public spending, public policies
oriented toward market competition within the E.U. and lack of political coordination on Defence and Security issues). By contrast, the Chinese space economy is closely aligned with the characteristics of pre-Cold War “centralised” space industries (in the sense of Whitney 2000). Second, if one focuses on domestic spacecraft launched, the U.S. space economy exhib-its characteristics similar to the Russian space economy. In particular, the U.S. and Russian domestic market structures are comparable9. A majority
of spacecraft launched from Russian and U.S. launch sites, and funded by domestic customers, are non-commercial. Indeed, U.S. private companies massively use foreign industrial facilities – notably Russian – for the purpose of launching commercial spacecraft.
The second implication of this research is more theoretical. It confirms that industrial and technological change result from the combined effects of supply and demand forces (DiStefano et al. 2012). Since the late 1970s, the question of the interplay between supply and demand forces has been central to many debates among economists (Mowery, Rosenberg, 1979; Dosi, 1982). It has been demonstrated that in some cases, supply forces alone can push the emergence and further development of an industry, while in others the expression of demand is considered as the main force that pulls an industry forwards. However, it has also been demonstrated that not all technologies and industries display historical patterns that fit standard life-cycle theories (Malerba et al., 2007). The space industry is a case in point. It did not start with a period of intense experimentation conducted by individual entre-preneurs as life-cycle theories would suggest. Instead, the birth of the space industry required massive investments by governments and public agencies. Furthermore, the role played by demand for space technology was not lim-ited to the selection of technological standards and successful firms during the growth and maturity of the space industry. Customers’ motivations and interests shaped the various phases of its life-cycle, including the last period studied in this paper, and constitute the driving force of the transforma-tion of the space economy. It follows that much research is still required to deepen our understanding of the role played by demand forces in shaping technological change and industrial evolution, particularly in the case of complex product systems (CoPS) industries that have an increasing influ-ence in our economies (Davies, Hodday, 2005).
9. In the U.S., the distribution of total spacecraft funded by U.S. customers and launched from the U.S. is as follows: 15.8% by private customers, 37.7% by military customers and 46.4% by institutional customers. In Russia, the distribution is as follows: 4.5% by private customers, 29.6% by military customers, and 65.6% by institutional customers. Therefore, domestic gov-ernment customers account for the largest part of total spacecraft launched from the U.S. and Russian domestic launch facilities.
FINAL COMMENTS
This article investigated the evolution of space industries by focusing on total spacecraft launched by major space Nations between January 2000 and December 2013. It suggested that the asymmetries between government and non-government customers, commercial and non-commercial applications, and domestic and non-domestic transactions decreased progressively, sug-gesting that the world space economy would be on the path towards getting civilianised, commoditised, and internationalised. However, this gradual shift towards a (more) balanced, competitive market structure took different forms within major space Nations.
This paper has several limitations. First, because our data is limited to a single industry, it follows that the implications drawn from our case study are circumscribed to specific technological, socio-organizational and historical contexts. The second limitation is related to our research design and meth-odology. We adopted a descriptive statistics analysis which does not provide empirical material on which elaborating on the underlying forces driving industrial change. Besides descriptive statistics, understanding the drivers of space economies’ current evolution requires a holistic analysis of the local and global circumstances characterising each national context. An in-depth study of the political, economical, regulatory and technological factors influ-encing the dynamics and structure of space industries is thus needed. The characteristics of the four major space economies are dependent upon such factors as national defence and security policies, defence and space budg-ets, macroeconomics, industrial and technological bases, and regulation bodies. Within this framework, a promising path for future research would be to investigate the relationship between these contextual factors and the expression of customers’ motivations, the latter being the leading force that shapes the dynamics of space industries.
REFERENCES
ADNER, R. (2003), When are Technologies Disruptive? A Demand-Based View of the Emergence of Competition, Strategic Management Journal, 23(8), 667-688.
ADNER, R., LEVINTHAL, D. (2001), Demand Heterogeneity and Technology Evolution: Implications for Product and Process Innovation, Management Science, 47(5), 611-628. AEROSPACE AND DEFENCE INDUSTRIES (2015), ASD Facts & Figures 2015, ASD
report, http://www.asd-europe.org.
BARBAROUX, P., DOS SANTOS PAULINO, V. (2013), Le rôle de la Défense dans l’émergence d’une nouvelle industrie : le cas de l’industrie spatiale, Innovations, Revue
d’Economie et de Management de l’Innovation, 42(3), 39-58.
BUCKERFIELD DE LA ROCHE, A. (2011), Space, Security and Resilience: Reflections on the Debate, Space Policy, 27, 247-249.
CHENGZHI, L. (2011), Agronomy in Space – China’s Crop Breeding Program, Space
Policy, 27, 157-164.
DAVIES, A., HOBDAY, M. (2005), The Business of Projects – Managing Innovation in
Complex Products and Systems, Cambridge University Press.
DI STEFANO, G, GAMBARDELLA, A., VERONA, G. (2012), Technology Push and Demand Pull Perspectives in Innovation Studies: Current Findings and Future Directions,
Research Policy, 41, 1283-1295.
DOSI, G. (1982), Technological Paradigms and Technological Trajectories, Research
Policy, 11, 147-162.
FAA (2013), Federal Aviation Administration Aerospace Forecast Fiscal Years 2014-2034, https://www.faa.gov/ (last view: 26/8/14).
GOVERNMENT ACCOUNTABILITY OFFICE (2014a), NASA – Assessment of Selected
Large-Scale Projects, GAU 14-338SP, http://www/gao.gov (last view: 5/8/14).
GOVERNMENT ACCOUNTABILITY OFFICE (2014b), Commercial Space Launches –
FAA’s Risk Assessment Process is not yet Updated, GAO-14-238T, http://www/gao.gov (last
view: 25/8/14).
HIRIART, T., SALEH, J. (2010), Observations on the Evolution of Satellite Launch Volume and Cyclicality in the Space Industry, Space Policy, 26, 53-60.
HOBDAY, M. (1998), Product Complexity, Innovation, and Industrial Organization,
Research Policy, 26, 689-710.
KREISEL, J., LEE, B. (2007), Space Entrepreneurship: Status & Prospects, in Yearbook
on Space Policy 2006/2007: New Impetus for Europe, ESPI, Springer, Chapter 10, 254-273.
KUPRIYANOV, A. (2014), Current State and Prospects of Development of Commercial Applications GLONASS/GNSS in the Russian Federation, United-Nations Symposium to
Strengthen the Partnership with industry commercial applications of GNSS, Vienna (Austria),
17 February.
LODGSON, J. (2011), A New Approach to Human Spaceflight?, Space Policy, 27, 15-19. MALERBA, F., NELSON, R., ORSENIGO, L., WINTER, S. (2007), Public Policies and Changing Boundaries of Rims in a “History-Friendly” Model of the Co-Evolution of the Computer and Semiconductor Industries, Journal of Economic Behavior & Organization, 67(2), 355-380.
Mc DOUGALL, W. (1982), Technocracy and Statecraft in the Space Age – Toward the History of Saltation, The American Historical Review, 84(4), 1010-1040.
MOREL, P. (2013), Advancing Earth Observation from Space: A Global Challenge, Space
Policy, 29, 175-180.
MOWERY, D., ROSENBERG, N. (1979), The Influence of Market Demand Upon Innovation: A Critical Review of Some Recent Empirical Studies, Research Policy, 8, 102-153.
PEETERS, W. (2002), Effects of Commercialisation in the European Space Sector, Space
Policy, 18, 199-204.
PETER, N., STOFFL, K. (2009), Global Space Exploration 2025: Europe’s Perspectives for Partnerships, Space Policy, 25, 29-36.
PETRONI, G., SANTINI, S. (2012), Innovation and Change? The Evolution of Europe’s Small Satellite Manufacturers, Space Policy, 28, 25-32.
SATELLITE INDUSTRY ASSOCIATION (2015), State of the Satelitte Industry Report, The Tauri Group, September, http://www.sia.org.
SHOVE, C. (2005), Emerging Space Commerce and State Economic Development Strategies, Economic Development Quarterly, 19(2), 190-206.
THE SPACE FOUNDATION REPORT (2014), The Authoritative Guide to Global Space
Activity, http://www.spacefoundation.org (last view: 8/8/14).
WHITNEY, P. (2000), Tracing the Evolutionary Path for Space Technologies, Space Policy, 16, 171-183.