Science Arts & Métiers (SAM)
is an open access repository that collects the work of Arts et Métiers Institute of
Technology researchers and makes it freely available over the web where possible.
This is an author-deposited version published in: https://sam.ensam.eu
Handle ID: .http://hdl.handle.net/10985/14039
To cite this version :
Benoit PERROUD, Stéphane RÉGNIER, Andras KEMENY, Frédéric MERIENNE - Effects of Latency on Aiming Performance for CAVE-like Immersive Virtual Reality Systems and Driving Simulators - In: Driving Simulation Conference 2018 Europe VR, France, 2018-09-05 - Driving Simulation Conference 2018 Europe - 2018
Any correspondence concerning this service should be sent to the repository Administrator : [email protected]
Effects of Latency on Aiming Performance for
CAVE-like Immersive Virtual Reality Systems and
Driving Simulators
Benoit Perroud1,2, St ´ephane R ´egnier2, Andras Kemeny1,2and Fr ´ed ´eric M ´erienne1
(1) LISPEN EA 7515, Arts et M ´etiers, UBFC, HeSam, Institut Image, 2 Rue T. Dumorey 71100 Chalon-sur-Sa ˆone, France. E-mail : [email protected]
(2) VR and Immersive Simulation Center, Renault, Guyancourt, France. E-mail : {benoit.perroud, stephane.regnier, andras.kemeny}@renault.com
Abstract - Studies on the influence of latency over performance are mostly made with head mounted displays.
The relation between end-to-end latency and performance in virtual and fully immersive environments such as CAVE-like display systems is investigated.
Keywords: Virtual Reality, Latency, Performance, CAVE-like Display System
Introduction
Renault, as others car manufacturers, is relying more and more on Virtual Reality (VR) simulation during the styling and product design of new vehicles. Re-nault is extending its use of VR to immersive dri-ving simulators and high-definition immersive display systems. Some of the later systems are immersive rooms frequently named CAVE (Cave Automatic Vir-tual Environment). CAVEs are 3-4m wide cubes with typically up to 4 or 5 faces that are screens. It may include a driver station in the middle for testing in dri-ving situations. These tools are being used for taking critical decisions in multiple engineering fields : de-sign, ergonomics, architecture, perceived quality, am-bient lighting, and others. Therefore, these simulators need to reach the maximum perceptual realism pos-sible so that engineers can take their decisions trust-fully. CAVE systems are commonly identified as pro-viding scale 1:1 perception of the 3D product, but li-mitations and questions remain regarding the realism of the perception of the user. Moreover, such systems are basically designed as individual and unique sys-tems, thus providing various levels of performance.
Research Question
There exist several definitions for latency in real time rendering systems [Pap11, Bla15, Wat98]. However, the most common and used definition is the ”end-to-end” latency. It can be described as the time elapsed between a movement of the user and its reflection in the virtual environment [Mee03]. It has also been shown that latency has an impact on performance and presence [Man04, Ell99, Mee03, Pap11]. When conducted in immersive environments, these studies were mostly made with head mounted dis-plays. We hence wanted to investigate two ques-tions :
— What is the relation between end-to-end latency and performance in virtual and fully immersive en-vironments such as CAVE-like display systems ? — What is the influence of latency on presence and
cybersickness in such systems ?
If the first question was addressed through perfo-mance monitoring, the second one was quantified through questionnaires. We focused specificly on the movement of the head and its tracking.
In the latency field, there are different thresholds that can be found in literature : the percep-tion threshold is considered to be around 15-20ms [Ell99, Ade03, Reg99, Man04] while the perfor-mance interaction threshold is rather located around 50-100 ms [Jot13, Bro99, Ell99].
Methodology
The subjects were confronted to a life-like situa-tion and asked to perform a typical daily task such as looking at precise locations in a vehicle, during short amounts of time. The immersion was done through the mean of a 4 faces CAVE-like display system, with the subject seated at 1 m far from the main screen. The subjects were to perform an identical routine at different levels of latency. The simulation ran at a smooth 60 frames per second. Performance indicators established beforehand were transparently recorded during the routines. In addi-tion, multiple questionnaires were filled throughout the entire experiment : immersion tendency [Wit98], presence [Wit98] and simulator sickness question-naires (Kennedy’s SSQ). The scientifically verified french translation of the questionnaires were used [Bou07, Bou09, Bou11].
Precisely, the subjects are immersed in a realistic-looking car and its environment. They were asked to
Figure 2: Technique for delaying the tracking information.
Figure 3: Distribution of the population of subjects for the experiment.
(actual height smaller than previous-frame height) the world was tinted red. We then applied a sinu-soidal vertical movement to the glasses and filmed the output (glasses + screens) at 120 Hz. By running frame by frame the thus obtained video, we could count the number of frames between a real change of direction of the glasses’ movement (ascendent or descendent) and its display (which was characteri-zed by a tint change of the 3D environment). The precision is hence half a frame, which means 4 ms. Our measurements report a total amount of latency of 160 ms for the reference system, and a correct ad-dition of 60 ms in the tracking loop, which leads to a total amount of latency of 220 ms for the degraded setup.
In our experiment, there were 12 subjects, 6 men and 6 women, aging from 23 to 54 years-old, with a mean value of 31 y.o. and a standard deviation pf σ = 11 y.o.. 9 of them declared being familiar to Virtual Rea-lity or playing video games (Fig. 3).
This study is carried out as a preliminary one and the-refore presents only a small panel of subjects with a low performance (high latency) CAVE. It opens the path to a future larger-scale study, especially with low-latency systems such as HMDs.
Results
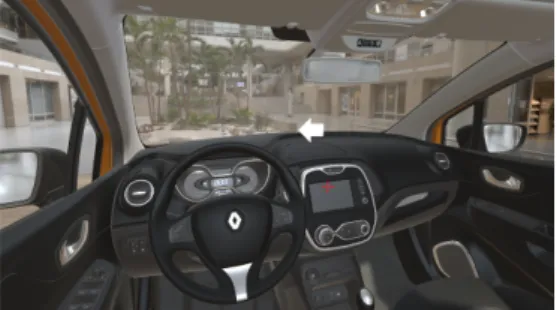
The immersion tendency questionnaire (Fig. 4) gave back an average value of 44.58 out of 70 (standard-deviation : σ = 8.81) while the presence question-naire had an average response value of 68.92 out of Figure 1: View of the life-like setup. The current indication is
”left target” while the red reticle is on the top of the central display.
visually aim at given points in the car, in a random or-der. The aiming was helped with a game-like virtual reticle follwing the movements of the head. The target to aim at were indicated by means of a white arrow pointing one out of four possible directions (left, up, right and down). Whenever the subjects assumed to be at the center of the designated target, they would hit a button on a joystick they held in their hands. There were four different possible targets, bounded to the direction of the arrow : the left and right mir-rors, the rear view mirror and the central display. The routine was made of 24 targets to hit (6 times each of the 4 targets) presented in a random order. The sub-jects were asked to replace their gaze at the arrow location after every aiming routine. The software au-tomatically and covertly recorded the hit position on the target (x-axis and y-axis coordinates) and the hit time. The hit position was then used to compute how far from the center of the target the subject shot. The output is relative to the size of the target and thus given between 0 and 1 on both axes.
The same 24 targets aiming routine was performed twice : once at the standard running capability of the immersive system (reference setup) and once in a degraded state of the system, latency-wise. The or-der was alternated between subjects in order to limit any bias. Latency was added on the tracking of the head. Technically, the tracking is correctly performed but delayed in time. We did not degrade the frame rate to be able to keep a high frame rate and thus a smooth (but late) simulation.
The latency offset we added in our experiment is ba-sed on the different values that were presented pre-viously in the Research Question section. In order to stay within the range of the performance interaction threshold, we chose to add an amount of 60 ms within the tracking loop of the head (Fig. 2). The addition of latency was made by applying a filter in the tracking software. The filter was set with a negative amount of anticipation time.
In order to properly conduct our experiment, some values needed to be verified u pstream. W e h ad to measure the total amount of latency, with and without added latency (and hence verify that the filter is well applied). There exist a lot of different techniques to measure end-to-end latency [Pap11]. Since our sys-tem tracks the VR glasses, we chose to apply a color tint to the 3D environment, based on the height diffe-rence of the tracked device (compared to the height at the previous frame). For a positive difference (ac-tual height greater than previous-frame height) the world was tinted green while for a negative diffrence
Figure 4: Comparison of the Immersive Tendency Questionnaire and the Presence Questionnaire for all 12
subjects.
Figure 5: Mean values and standard deviations for the aiming accuracy on both axes and setups.
91 (sd : σ = 10.96). The initial simulator sickness questionnaire (SSQ) returned an average value of 3.58out of 48 (sd : σ = 3.01) while the non-latency-degraded setup returned an average of 2.75 (sd : σ = 2.01) and the latency-degraded-setup returned 6.08(sd : σ = 6.42).
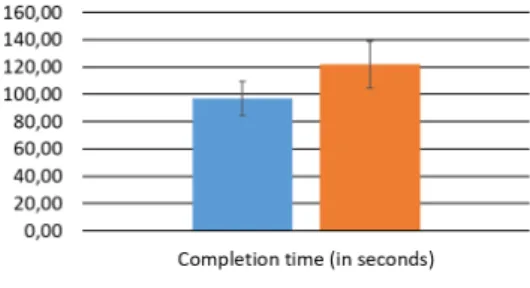
The aiming precision is calculated as the average precision on an axis for all targets (i.e. all 24 trials). For the non-latency-degraded setup (Fig. 5), the x-axis relative precision of the subjects shooting on tar-gets was 0.19 (sd : σ = 0.06) and, equally, 0.19 for the y-axis relative precision (sd : σ = 0.09). The average completion time was 96.79 seconds (sd : σ = 12.46). The time per target was evaluated at a mean of 4.03 seconds (sd : σ = 0.52).
On the second setup, latency-degraded (Fig. 5), the x-axis relative precision of the subjects shooting on targets was 0.24 (sd : σ = 0.06) and 0.20 for the y-axis relative precision (sd : σ = 0.09). The average completion time (Fig. 6) was 121.78 seconds (sd : σ = 17.07). The time per target was evaluated at a mean of 5.07 seconds (sd : σ = 0.71).
Most of the statistical tests were done using the Welch two sample t-test. The alternative hypothe-sis was ”less”. The significance threshold was set at α = 0.05. The Welch test was used to determine whether the latency conditions had influence on the precision of the subjects on the x-axis, the y-axis, on the total completion time, the time per target and the variation of the simulator sickness questionnaire re-sults (Tab. 1). In addition, a Pearson correlation test was used to explore the relationship between the im-mersion tendency questionnaire results and the pre-sence questionnaire results.
The immersion tendency versus presence test has a p-value of p = 0.280 and a correlation factor of
Figure 6: Mean values and standard deviations of the completion times for both setups.
ρ = 0.340. The statistical test between the two si-mulator sickness questionnaires returns a p-value of p = 0.0620.
The Welch tests on the influence of comparison bet-ween the x-axis precision at lower latency setup and higher latency setup returns a p-value of p < 0.05 while the one on the y-axis aiming precision returns a p-value of p = 0.395, the one on the completion time returns a p-value of p < 0.001 and the last one, on time per target, returns a p-value of p < 0.001. Table 1: p-values of the Welch two sample t-tests (alternative
”less”).
Response variable Degrees of freedom p-value
x-axis precision 22 0.0378 y-axis precision 22 0.395 completion time 20 0.0004
time per target 20 0.0004 SSQ value 13 0.0620
Discussion
Our results show a statistical influence of the latency on the accuracy. When the increase of latency hap-pend, the subjects were 26% more inaccurate on the lateral movements and 5% less accurate on the verti-cal movements. The inequality between the two axes could be explained by the greater movement ampli-tude needed to reach the left and right targets (left and right mirrors, between 40 et 60 degrees) com-pared to the amplitude needed to reach the top and bottom targets (central mirror and central display, 15 degrees). A larger movement means a longer inter-action time with the latency and hence a higher im-precision.
Another great parameter that must be taken into ac-count is the fast completion of the 24-targets routine that was asked. Keeping a high pace during the ex-periment implies less care given to to accuracy of the aiming. Hence, our results show a poorer accuracy compared to what could have been reached whether the order would have been to simply aim at the center of the targets. The average accuracy of the subjects above the median of completion time (in the higher la-tency setup) is greater than the average accuracy of the subjects below the completion time median : 0.26 against 0.21 on the horizontal axis and 0.23 against 0.16 on the vertical axis. Hence, as well as the in-teraction time, a higher pace under higher latency condition leads to a higher imprecision.
All in all, this opens the path to a new set of measu-rements and a comparison between our CAVE-like display system and a Head-Mounted Display (HMD). The new experiment would take place in the same 3D environment and on the same routine basis. This would allow to reach lower latency setups and to in-vestigate whether the subjetcs deploy the same stra-tegies within an other immersive display.
References
B. D. Adelstein, T. G. Lee and S. R. Ellis,Head Tracking Latency in Virtual Environments : Psychophysics and a Model,
Pro-ceedings of the Human Factors and Ergonomics Society Annual Meeting, vol. 47(20) : 2083–2087, 2003.
R. A. Blade and M. L. Padgett, Handbook of virtual environ-ments : design, implementation, and applications, Human
fac-tors and ergonomics, CRC Press, Taylor & Francis Group, Boca Raton, second edition ed., 2015, ISBN 978-1-4665-1184-2. S. Bouchard, G. Robillard and P. Renaud,Revising the factor structure of the Simulator Sickness Questionnaire, vol. 5, 117–
122, 2007.
S. Bouchard, J. St-Jacques, P. Renaud and B. K. Wiederhold,Side effects of imersions in virtual reality for people suffering from anxiety disorders, Journal of Cybertherapy and Rehabilitation,
vol. 2(2) : 127–137, 2009.
S. Bouchard, G. Robillard, P. Renaud and F. Bernier,Exploring new dimensions in the assessment of virtual reality induced sude-effects, Journal of Computer and Information Technology,
vol. 1(3) : 20–32, 2011.
F. Brooks, What’s real about virtual reality ?, IEEE Computer
Graphics and Applications, vol. 19(6) : 16–27, 1999.
S. R. Ellis, B. D. Adelstein, S. Baumeler, G. J. Jense and R. H. Ja-coby,Sensor spatial distortion, visual latency, and update rate effects on 3D tracking in virtual environments, in Proceedings
IEEE Virtual Reality (Cat. No. 99CB36316), 218–221, 1999. R. Jota, A. Ng, P. Dietz and D. Wigdor,How Fast is Fast En-ough ? : A Study of the Effects of Latency in Direct-touch Pointing Tasks, in Proceedings of the SIGCHI Conference on
Hu-man Factors in Computing Systems, CHI ’13, 2291–2300, ACM, New York, NY, USA, 2013, ISBN 978-1-4503-1899-0.
K. Mania, B. D. Adelstein, S. R. Ellis and M. I. Hill, Perceptual Sensitivity to Head Tracking Latency in Virtual Environments with Varying Degrees of Scene Complexity, in Proceedings of
the 1st Symposium on Applied Perception in Graphics and Visua-lization, APGV ’04, 39–47, ACM, New York, NY, USA, 2004, ISBN 978-1-58113-914-3.
M. Meehan, S. Razzaque, M. C. Whitton and F. P. Brooks,Effect of latency on presence in stressful virtual environments, in
IEEE Virtual Reality, 2003. Proceedings., 141–148, 2003. G. Papadakis, K. Mania and E. Koutroulis,A System to Measure, Control and Minimize End-to-end Head Tracking Latency in Immersive Simulations, in Proceedings of the 10th International
Conference on Virtual Reality Continuum and Its Applications in Industry, VRCAI ’11, 581–584, ACM, New York, NY, USA, 2011, ISBN 978-1-4503-1060-4.
M. J. P. Regan, G. S. P. Miller, S. M. Rubin and C. Kogelnik,A real-time low-latency hardware light-field renderer, 287–290, ACM
Press, 1999, ISBN 978-0-201-48560-8.
B. Watson, N. Walker, W. Ribarsky and V. Spaulding,Effects of Variation in System Responsiveness on User Performance in Virtual Environments, Human Factors, vol. 40(3) : 403–414,
1998.
B. G. Witmer and M. J. Singer,Measuring Presence in Virtual Environments : A Presence Questionnaire, Presence :
Teleo-perators and Virtual Environments, vol. 7(3) : 225–240, 1998.
on the global completion time (with an increase of 26% over the degraded setup) and the time per tar-get, which is directly linked. Finally, we can observe a large increase of the SSQ values between the two setups (+121%). However, the statistical significance is just above the threshold showing a weak correla-tion. This can be explained by the average SSQ de-graded setup value being bumped by very high sick-ness values from a few subjects. On top of the clas-sic vergence-accommodation conflict that causes si-ckening, there is an other conflict t hat contributes here to the increase of simulator sickness : the visio-vestibular conflict. The more latency, the more dispa-rity between vision and consciousness of the move-ment by the vestibular system and hence sickness. Unfortunatly, we were not able to predict the pre-sence feeling based on the immersive tendency questionnaire answers. The statistical correlation between the two could not be demonstrated. Howe-ver, this may be heavily resting on the system’s spe-cifications.
The more speed in the head movements, the more latency influences user experience ; both in accuracy degradation and in simulator sickness increase. The subjects were facing a choice : either they would slown down their movements to achieve better first in-tention target aiming or they would keep a good pace to the detriment of accuracy and sickness. The sub-jects seem to develop their own strategy to counter the offset of latency, based on how heavily they were burdened by latency. As a result, to ensure the best user experience and the minimize the effect of sicke-ning, it might be advised to suggest slow and small movements to the daily users of the immersives tech-niques.
Conclusion
and Future Works
An experimentation was performed to observe the in-fluence of ”end-to-end” latency on an seemingly daily task. Objective measurements were carried during the experiment. The subjects also had to fill seve-ral questionnaires such as immersion tendency ques-tionnaire, presence questionnaire and simulator sick-ness questionnaire.
Our results statistically show a degradation of the ac-curacy, for the lateral movements, on the targets to aim and an increase in the time required to perform the full 24 targets routine. In addition, there seems to exist a weak presomption of influence on the evolu-tion of simulator sickness with latency. However, we were neither able to significantly s how a n influence of latency on the vertical movements accuracy nor to prove the existence of a correlation between the immersive tendency questionnaire and the presence questionnaire. These results allow a better unders-tanding of the effects of latency on performance in CAVE-like immersive display and on the strategies subjets may be brought to deploy to maximize their experience.
Still, there are improvements that can be done to the current experimental setup. The aiming reticle is only attached to the movement of the head and could be driven directly by the movement of the eye. However, this technology takes a heavy toll as it typically adds around 100 ms to the global latency. In addition, our current ”end-to-end” latency could be drastically re-duced by upgrading our projectors.