Science Arts & Métiers (SAM)
is an open access repository that collects the work of Arts et Métiers Institute of Technology researchers and makes it freely available over the web where possible.
This is an author-deposited version published in: https://sam.ensam.eu
Handle ID: .http://hdl.handle.net/10985/15781
To cite this version :
Pierre-Marc FRANÇOIS, Baptiste SANDOZ, Sébastien LAPORTE, Philippe DECQ - Intra cranial volume quantification from 3D reconstruction based on CT-scan data - In: Intra cranial volume quantification from 3Dreconstruction based on CT-scan data, France, 2017 - Issue sup1: Société de Biomécanique Conference 2017 - 2017
Any correspondence concerning this service should be sent to the repository Administrator : [email protected]
Intra cranial volume quantification from 3D
reconstruction based on CT-scan data
PM. François, B. Sandoz, S. Laporte & P. Decq
To cite this article: PM. François, B. Sandoz, S. Laporte & P. Decq (2017) Intra cranial volume quantification from 3D reconstruction based on CT-scan data, Computer Methods in Biomechanics and Biomedical Engineering, 20:sup1, 81-82, DOI: 10.1080/10255842.2017.1382870
Intra cranial volume quantification from 3D reconstruction based on CT-scan
data
P. M. Françoisa, B. Sandoza, S. Laportea and P. Decqa,b
aarts et metiers paristech, institut de Biomecanique humaine georges Charpak, paris, France; bservice de neurochirurgie, hôpital Beaujon
(ap-hp), Clichy, France
KEYWORDS intracranial volume; Ct-scan; Craniosynostosis
1. Introduction
The evolution of some congenital diseases impacting the shape of the skull such as the Chiari malformation or Craniosynostosis condition can be quantify measuring the increasing of the intra cranial volume (ICV) (Gault et al. 1993). This volume could be calculated from ana-tomic measurements (Gordon 1966). Nevertheless, in case of important variations of shape, these techniques were not suitable to accurately assess ICV from measure-ments of global parameters. Some studies, using automatic segmentation combined with manual adjustments from MRI acquisition were used to assess the ICV (Reite et al.
2010). However, 3-4 hours were required for each patient to complete the process. Other studies used total auto-matic segmentation to calculate volume of the brain and the ICV (de Jong et al. 2017). But high quality of MRI was necessary to get accurate results.
The purpose of this study was to develop a fast, efficient and reproducible procedure to calculate the ICV, based on 3D skull reconstruction obtained from scanner imaging.
2. Methods
The method was divided in two steps. First, the recon-struction process from scanner images, and then the vol-ume calculation procedure.
2.1. 3D reconstruction
The segmentation had previously been realized using the software Mimics® (Materialse Leveun Belgique) with a lower limit for bone threshold of 150 HU.
For the segmented skull, a close geometric surface of 300000 polygons was exported in order to complete the volume calculation process (Matlab® MathWorks, 1984).
The midpoint (O) of the segment [left Porion; right Porion] projected on the Frankfort plan (FP) defined the origin for the 3D skull. The Y-axis was the vector [O; left Porion] projected on the FP. The Z-axis was set at the point O and perpendicular to the FP. The X-axis was the result of the cross product between the Y and Z axis. Between 20 and 30 min were required to get the complete recon-structed skull.
2.2. Intracranial volume calculation
As volume is a physical value calculated for closed surface, inferior part of the Foramen Magnum was closed with a mean square plan passing through manually selected nodes.
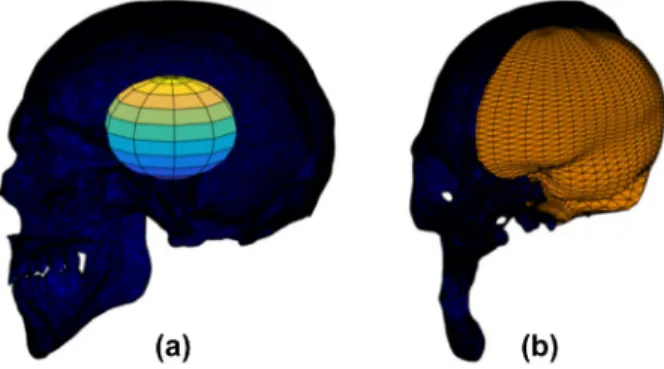
A first 92 nodes ellipsoid was set at the origin of the 3D reconstructed model (Figure 1a). Each node was pro-jected on the inner surface of the 3D model along the line [Origin; Ellipsoid node] (Figure 1). Centred on the barycenter of the obtained inner projected nodes cloud, the N nodes of a second meshed ellipsoid were projected on the inner surface of the 3D skull (N ≥ 92). Finally, a low-pass filter (Taubin 2000) was applied to smooth the resulting surface (λ=0.6307 ν=-0.6732) . The illustration of the process was presented on Figure 1b, with a 2452 nodes ellipsoid.
2.3. Application
Twelve skulls of patients from the Hôpital de la Pitié Salpêtrière were used for this survey, 6 females and 6 males (age = 52 ± 15 yrs, weight = 66.8 ± 12.2 kg, height = 167 ± 9 cm). The thickness of the scanner images was 2.5 mm.
For these skulls, the impact of the number of ellipsoid nodes on the calculating volume was studied (Ellipsoid with 92, 872, 1562, 2452, 6322 nodes).
be reached. Nevertheless, it was assumed that the corre-sponding volume could be neglected, compared to the global intra cranial volume. A validation procedure had also to be performed.
4. Conclusions
A fast and reproducible procedure was developed to extract the intra cranial surface and to calculate the cor-responding volume, based 3D reconstruction.
Further work is currently performed to avoid the seg-mentation process and to directly compute the nodes projections on the DICOM images, to prevent any error provided by the 3D reconstruction (Laurent et al. 2011).
Acknowledgments
Authors would like to thank François Girinon and Serge Ketoff for the accessibility of their scanner data base.
References
Gault DT, Renier D, Marchac D, Jones BM, Eppley BL. 1993. Intracranial Pressure and Intracranial Volume in Children with Craniosynostosis. J Craniofac Surg
Gordon IRS. 1966. Measurement of Cranial Capacity in Children. Br J Radiol.
De Jong LW, Vidal J-S, Forsberg LE, Zijdenbos AP, Haight T, Sigurdsson S, Gudnason V, van Buchem MA, Launer LJ, Launer LJ. 2017. Allometric scaling of brain regions to intra-cranial volume: An epidemiological MRI study. Hum Brain Mapp
Laurent CP, Jolivet E, Hodel J, Decq P, Skalli W. 2011. New method for 3D reconstruction of the human cranial vault from CT-scan data. Med Eng Phys.
Reite M, Reite E, Collins D, Teale P, Rojas DC, Sandberg E. 2010. Brain size and brain/intracranial volume ratio in major mental illness. BMC Psychiatry.
Taubin G. 2000. Geometric Signal Processing on Polygonal Meshes. Eurographics.
3. Results and discussion
Excluding the segmentation procedure, the volume calcu-lation lasted around 8 min (computer performance for the process: CPU 2.79 GHz and RAM: 6 Go) for the twelve patients studied. The table 1 presented the volume values calculated in Litre (L). The obtained intra cranial surfaces for two patients were presented Figure 2.
The differences of volumes calculated with the different number of nodes (less than 1% in mean between 2452 and 6322 nodes) regarding the time of calculation was neglected and an ellipsoid with 2452 nodes was used to obtain the final volume value.
The method presented worked well to obtain the intra cranial volume value from CT-scan reconstruction and the value of the calculated ICV are consistent the literature (de Jong et al. 2017) (Reite et al. 2010).
Due to the complexity of the shape of cranial bones such as the sella turcica, some part of the skull could not
Figure 1. (a) ellipsoid with 92 nodes set at the origin of the 3d reconstructed model; (b) reconstructed intracranial surface with a 2452 nodes ellipsoid.
Table 1. iCV (l) calculated according to the number of nodes of the ellipsoid for the twelve skulls. in green, the iCV calculated with the selected number of nodes of the ellipsoid (2452) for the study. Patient number Number of nodes 92 382 872 1562 2452 6322 1 1.22 1.33 1.35 1.36 1.36 1.37 2 1.19 1.29 1.30 1.31 1.32 1.32 3 1.11 1.21 1.23 1.24 1.24 1.24 4 1.25 1.36 1.38 1.39 1.39 1.40 5 1.25 1.36 1.38 1.39 1.40 1.40 6 1.21 1.37 1.40 1.42 1.42 1.43 7 1.14 1.27 1.31 1.32 1.32 1.33 8 1.27 1.38 1.40 1.41 1.42 1.42 9 1.16 1.32 1.34 1.36 1.36 1.37 10 1.28 1.44 1.47 1.48 1.49 1.49 11 1.27 1.40 1.42 1.43 1.43 1.44 12 1.15 1.29 1.32 1.33 1.34 1.34