HAL Id: pastel-00718604
https://pastel.archives-ouvertes.fr/pastel-00718604
Submitted on 17 Jul 2012HAL is a multi-disciplinary open access
archive for the deposit and dissemination of sci-entific research documents, whether they are pub-lished or not. The documents may come from teaching and research institutions in France or abroad, or from public or private research centers.
L’archive ouverte pluridisciplinaire HAL, est destinée au dépôt et à la diffusion de documents scientifiques de niveau recherche, publiés ou non, émanant des établissements d’enseignement et de recherche français ou étrangers, des laboratoires publics ou privés.
Gases in Thermodynamic Promoter Aqueous Mixtures
Veronica Belandria
To cite this version:
Veronica Belandria. Hydrate Phase Equilibria Study of CO2 Containing Gases in Thermodynamic Promoter Aqueous Mixtures. Other. Ecole Nationale Supérieure des Mines de Paris, 2012. English. �NNT : 2012ENMP0018�. �pastel-00718604�
MINES ParisTech Centre Énergétique et Procédés
35, rue Saint Honoré, 77305 Fontainebleau Cedex, France
présentée et soutenue publiquement par
Veronica BELANDRIA
le 18 juin 2012
Etude Expérimentale des Equilibres d'hydrates de Mélanges de Gaz Contenant
du CO
2en Solutions Aqueuses de Promoteur Thermodynamique
Hydrate Phase Equilibria Study of CO
2Containing Gases in
Thermodynamic Promoter Aqueous Mixtures
Doctorat ParisTech
T H È S E
pour obtenir le grade de docteur délivré par
l’École Nationale Supérieure des Mines de Paris
Spécialité “ Génie des Procédés ”
Directeur de thèse : Dominique RICHON Co-directeur de thèse : Amir H. MOHAMMADI
Jury
M. Arne GRAUE, Professor, Physics and Technology, University of Bergen Rapporteur
Mme Maaike C. KROON, Professor, Chemical Engineering and Chemistry, Eindhoven TU Rapporteur
M. Cornelis J. PETERS, Professor, Chemical Engineering, The Petroleum Institute, Abu Dhabi Président M. Luis A. GALICIA-LUNA, Professor, ESIQIE, Instituto Politecnico Nacional Examinateur
M. Rafael LUGO, Dr, Chimie et Physico-chimie Appliquées, IFP Energies Nouvelles Examinateur
M. Amir H. MOHAMMADI, Dr (HDR), CEP/TEP Fontainebleau, MINES ParisTech Examinateur
M. Dominique RICHON, Professor, CEP/TEP Fontainebleau, MINES ParisTech Examinateur
Ecole doctorale n° 432 : Sciences des Métiers de l’ Ingénieur
T
H
E
S
2
List of Figures 4
List of Tables 7
Nomenclature 8
Chapter 1:Introduction 12
1.1 The Growing Need for CO2 Capture 12
1.1.1 Carbon dioxide: Properties, formation, and phase behavior of the CO2 + water system 14
1.1.2 Solutions for Capturing CO2 17
1.2 Gas Hydrates: An Introductory Overview 20
1.2.1 Historical Background 20
1.2.2 Definition and Crystalline Structures 23
1.2.3 Phase Diagrams 25
1.2.4 Gibbs’ Phase Rule Consideration 29
1.2.5 Gas Hydrates Potential in Industry and Process Engineering 29
1.2.6 CO2 Capture by Gas Hydrate Crystallization 30
1.2.7 Use of Thermodynamic Promoters 35
1.2.8 TBAB Semi-Clathrates 37
1.3 Objective and Scope of the work 42
Chapter 2: Experimental Methods and Analysis Techniques for Gas Hydrates Phase
Equilibrium Measurement 47
2.1 Overview 47
2.2 Visual versus Non-visual Techniques 49
2.3 The Isochoric Method 51
2.4 Apparatuses for the Determination of Hydrate Phase Equilibria 52
2.5 Static-Analytic-Synthetic Measurements 56
2.6 Gas Chromatography 58
2.7 Calibrating Measuring Devices and Experimental Accuracies 61
2.7.1 Pressure Sensors Calibration 62
2.7.2 Temperature Probe Calibration 63
2.7.3 Volumetric Calibrations 64
2.7.4 GC Detector Calibration for Gas Mixtures 65
2.7.5 Refractometer Calibration 66
2.8 Criteria for Equilibrium 67
Chapter 3: Phase Equilibria of Clathrate Hydrates of Methane + Carbon dioxide: New
Experimental Data and Predictions 69
3.1 Introduction 71
3.2 Experimental setup and method 72
3.2.1 General hydrate formation and dissociation procedure 75
3
4.1 Introduction 89
4.2 Apparatus 92
4.2.1 Equilibirum cell 94
4.2.2 Sample supplying system 97
4.2.3 Composition analyzing system 97
4.2.4 Measurement, control and acquisition of temperature and pressure 100
4.3 Experimental Procedure 101
4.3.1 Preparation of the feed 101
4.3.2 Fluids supply to the equilibrium cell 102
4.3.3 Isochoric Pressure Search Method 102
4.4 Results and discussion 106
Chapter 5: Thermodynamic Stability of Hydrates from Gas Mixtures Containing CO2 114
5.1 Introduction 114
5.2 Gas Hydrate Formation in Carbon Dioxide + Nitrogen + Water Systems 116
5.2.1 Equilibrium Dissociation Conditions 117
5.2.2 Compositional Analysis of Equilibrium Phases 121
5.3 Study of Gas Hydrate Formation in (Carbon Dioxide + Hydrogen + Water) Systems 127
5.3.1 Equilibrium Dissociation Conditions 127
5.3.2 Compositional Analysis of Equilibrium Phases 129
Chapter 6: Thermodynamic Stability of Semi-Clathrate Hydrates 136
6.1 Phase Equilibria of Semi-Clathrate Hydrates of Carbon Dioxide, Methane and Nitrogen in
Non-Stoichiometric TBAB Aqueous Solutions 139
6.2 Thermodynamic Properties of Semi-Clathrate Hydrates of (Carbon Dioxide + Nitrogen) Gas
Mixtures in TBAB Aqueous Mixtures 145
6.2.1 Phase Equilibrium Measurements for Semi-Clathrate Hydrates of the CO2 + N2 +
Tetra-n-Butylammonium Bromide Aqueous Solution Systems 146
6.2.2 Compositional Properties for Semi-Clathrate Hydrates of the CO2 + N2 + Tetra-n-Butylammonium
Bromide Aqueous Solution Systems 154
Chapter 7: Conclusions and Outlook 163
7.1 Conclusions 164 7.2 Outlook 175 References 178 Acknowledgements 193 Curriculum Vitae 195 Publications 196
Appendix A: Measured Hydrate Phase Equilibrium Data for CO2 Containing Gases 199
Appendix B: Tetra-n-Butyl Ammonium Bromide + Water Systems: Density Measurements and
4
1.1 Worldwide CO2 industrial emissions and economic recessions in the past 50 years. ... 13
1.2 Carbon dioxide hydrates phase equilibrium in CO2 + water system. ... 15
1.3 Hydrate crystal unit structures: sI, sII and sH ... 23
1.4 Typical phase diagram for pure water ... 26
1.5 Pressure-temperature diagram for methane + water system in the hydrate region ... 27
1.6 Pressure-temperature phase diagram for hydrocarbon + water systems. ... 28
1.7 Pressure-temperature phase diagram for multicomponent natural gas systems. ... 28
1.8 Carbon dioxide hydrate phase boundary compared to nitrogen, hydrogen and methane ... 31
1.9 Flow diagram of a hydrate-based CO2 recovery process ... 33
1.10 Flow diagram of an integrated cryogenic and hydrate CO2 capture process ... 33
1.11 Conceptual separation stages required for recovering CO2 from (CO2 + N2) hydrates ... 34
1.12 Promotion effect of various quaternary ammonium salts on the phase equilibrium conditions of CO2 clathrate hydrates. ... 38
1.13 TBAB semi-clathrate structure ... 39
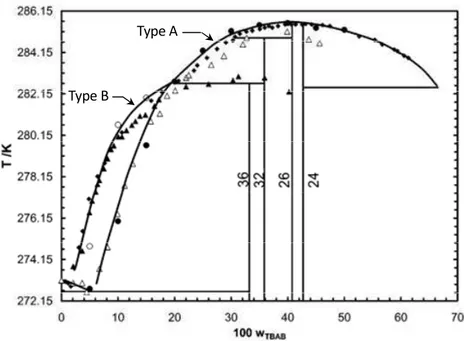
1.14 Temperature-composition phase diagram of (TBAB + H2O) semi-clathrates under atmospheric pressure, as reported by Arjmandi and coworkers (2007). Symbols represent experimental data and figures along the composition lines stand for hydration numbers. ... 40
1.15 Carbon dioxide + TBAB semi-clathrates phase boundary. ... 40
2.1 Process design strategy. ... 47
2.2 Detail of Deaton and Frost’s hydrate formation equilibrium cell ... 53
2.3 (a) Schematic diagram of the QCM, and (b) the QCM mounted within a high pressure cell. ... 54
2.4 High-pressure micro DSC VII measurement device. ... 55
2.5 Hydrate dissociation conditions (HDC) determination following the isochoric pressure-search method. ... 58
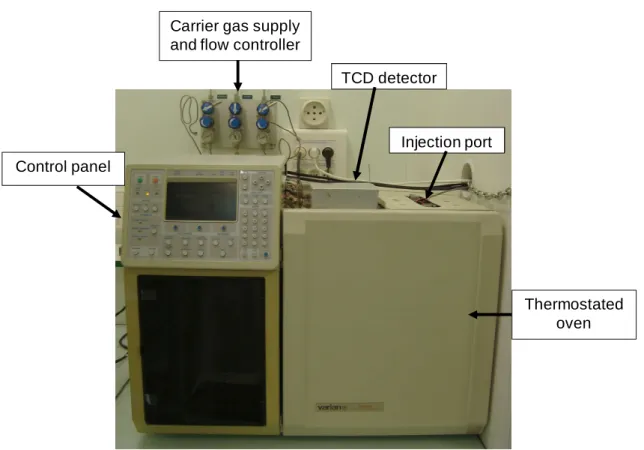
2.6 Front view of the gas chromatograph used in this work and main components ... 59
2.7 Gas chromatogram exhibiting an effective separation of a (CO2 + N2) gas mixture. ... 60
2.8 Calibration devices used in this work... 61
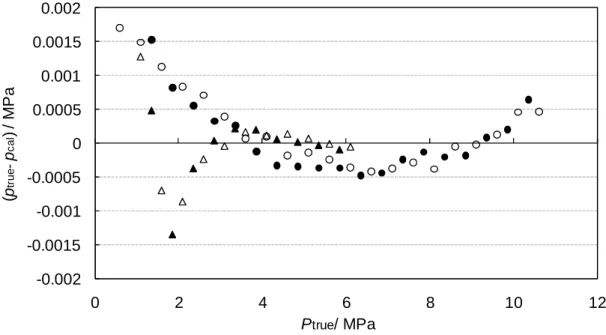
2.9 Relative uncertainty on pressure transducers calibration ... 62
2.10 Pt-100 Platinum resistance thermometer probe calibration. ... 64
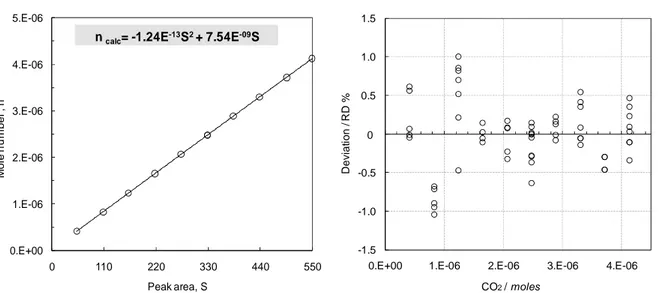
2.11 Thermal conductivity detector calibration ... 66
2.12 Refractive index calibration for TBAB aqueous solutions ... 67
2.13 Chromatogram profile for a (CO2 + N2) gas mixture in the presence of TBAB aqueous solution ... 68
3.1 Flow diagram of the experimental setup ... 73
3.2 Partial pictures of the apparatus ... 74
3.3 Representative isochoric curve, and pressure and temperature plots obtained during a hydrate formation/dissociation experiment. ... 76
3.4 Experimental dissociation pressures for methane simple hydrates ... 77
3.5 Experimental dissociation pressures for carbon dioxide simple hydrates. ... 77
3.6 Experimental dissociation pressures for various (methane + carbon dioxide) gas hydrates at different CO2 load mole fractions ... 78
3.7 Relative deviation of experimental dissociation pressures for (CO2 + CH4) clathrate hydrates and predictions of HWHYD thermodynamic model ... 80
3.8 Experimental, calculated (using eq. 3.2) and predicted (HWHYD model) dissociation pressures for (CO2 + CH4) clathrate hydrates ... 81
3.9 Relative deviation of the experimental and predicted (HWHYD model) dissociation pressures for various (CO2 + CH4) clathrate hydrates ... 82
3.10 Relative deviation of experimental and calculated pressures (using eq. 3.2) dissociation pressures for (CO2 + CH4) clathrate hydrates. ... 83
3.11 Experimental dissociation conditions for various (CO2 + CH4) clathrate hydrates and predictions of the thermodynamic model (HWHYD, 2000), at different CO2 mole fractions loaded ... 84
5
4.1 Schematic flow diagram of the new apparatus. ... 93
4.2 Partial pictures of the main components of the new apparatus ... 93
4.3 Cross section of the equilibrium cell and photograph of equilibrium cell on its aluminum support. ... 94
4.4 (a) Lateral section of the equilibrium cell (b) Detail of the protection grid for the capillary sampler. ... 95
4.5 (a) Lateral and (b) cross sections of the grid support. ... 96
4.6 Chromatogram profile for nitrogen gas samples under gas-hydrate-liquid water equilibrium ... 97
4.7 Flow diagram of the electromagnetic rapid on-line sampler-injector ... 98
4.8 Layout for chromatograms acquisition using Winilab III software. ... 99
4.9 Layout for temperature and pressure data acquisition software ... 100
4.10 Hydrate formation/dissociation process, cooling and heating isochors and determination of hydrate phase boundaries and composition of the equilibrium phases ... 103
4.11 Hydrate dissociation conditions measured in this work for (methane + carbon dioxide) clathrate hydrates at various CO2 load mole fractions. ... 106
4.12 Hydrate dissociation conditions (literature and this work) for (methane + carbon dioxide) clathrate hydrates at selected CO2 load mole fractions ... 107
4.13 (a) p-y phase diagram of (methane + carbon dioxide) clathrate hydrates at different equilibrium temperatures (b) p-z phase diagram of (methane + carbon dioxide) clathrate hydrates at 280.2 K ... 109
4.14 Pressure-composition phase diagram of the (methane + carbon dioxide) clathrate hydrates : This work and CSMGem model predictions ... 111
5.1 Experimental dissociation conditions for (nitrogen + carbon dioxide) clathrate hydrates at different CO2 load mole fractions. This work and HWHYD model predictions ... 118
5.2 Experimental dissociation conditions for (nitrogen + carbon dioxide) clathrate hydrates at different CO2 load mole fractions: Literature, this work and HWHYD model predictions... 119
5.3 ARD between experimental and predicted dissociation pressures for (nitrogen + carbon dioxide) clathrate hydrates at different CO2 mole fractions loaded. ... 121
5.4 Pressure - composition phase diagram for (nitrogen + carbon dioxide + water) systems under (Lw-H-G) equilibrium at different temperatures ... 122
5.5 Pressure - composition phase diagram for (nitrogen + carbon dioxide + water) systems under (Lw-H-G) equilibrium at selected temperatures. ... 124
5.6 Pressure - composition phase diagram for the (nitrogen + carbon dioxide + water) systems under (Lw-H-G) equilibrium: Experimental and literature ... 125
5.7 Pressure-composition phase diagram for the (nitrogen + carbon dioxide + water) systems under (Lw-H-G) equilibrium at selected temperatures. This work and CSMGem model predictions ... 126
5.8 Experimental (literature and this work) dissociation conditions for gas hydrates of (CO2 + H2) formed in the presence water at various feed gas compositions. ... 128
5.9 Pressure - gas phase composition phase diagram for (hydrogen + carbon dioxide + water) systems under (Lw -H-G) equilibrium at different temperatures ... 131
5.10 Pressure - gas phase composition phase diagram for (hydrogen + carbon dioxide + water) systems under (Lw-H-G) equilibrium at different temperatures. This work and literature ... 133
6.1 Experimental dissociation conditions (literature and this work) for (methane + TBAB) semi-clathrates. .... 142
6.2 Experimental dissociation conditions (literature and this work) for (carbon dioxide + TBAB) semi-clathrates ... 143
6.3 Experimental hydrate dissociation conditions (literature and this work) for (nitrogen + TBAB) semi-clathrates. ... 144
6.4 Dissociation conditions (Literature and this work) for semi-clathrates of (CO2 + N2) formed at various CO2 feed gas compositions in the presence of TBAB aqueous solutions ... 148
6.5 Experimental dissociation conditions for semi-clathrates of (0.749 mole fraction CO2 + 0.251 mole fraction N2) formed in the presence of TBAB aqueous solutions and predictions of CSMGem and HWHYD thermodynamic models in the absence of thermodynamic promoter ... 151
6
thermodynamic models in the absence of thermodynamic promoter ... 152 6.7 Experimental dissociation conditions for semi-clathrates of (0.151 mole fraction CO2 + 0.849 mole fraction
N2) formed in the presence of TBAB aqueous solutions and predictions of CSMGem and HWHYD
thermodynamic models in the absence of thermodynamic promoter ... 153 6.8 Pressure-composition (gas phase) diagram for semi-clathrates of the (CO2 + N2 + TBAB + H2O) systems at
various temperatures and 0.05 mass fractions TBAB ... 159 6.9 Pressure-composition (gas phase) diagram for semi-clathrates of the (CO2 + N2 + TBAB + H2O) systems at
various temperatures and 0.30 mass fractions TBAB ... 160 6.10 Pressure-composition (gas phase) diagram for semi-clathrates of the (CO2 + N2 + TBAB + H2O) systems at
selected temperatures and different initial TBAB concentrations. ... 161 6.11 Pressure-composition (TBAB in the liquid phase) diagram for semi-clathrates of (CO2 + N2 + TBAB +
7
1.1 Summary of major economic crises leading to important growth of global CO2 industrial emissions since the
1960s ... 13
1.2 Main features of post-combustion, pre-combustion and oxy-fuel combustion capture approaches ... 19
1.3 Significant research contributions relevant to clathrate hydrate formation of CO2 and tetra alkyl ammonium salts from 1778 to 2007 ... 22
1.4 Molecular diameter to cavity diameter ratio for cavity type for the gases of interest within this research. .... 24
1.5 Literature experimental studies for hydrate phase equilibria of gas mixtures containing CO2 + CH4, N2 and H2. ... 36
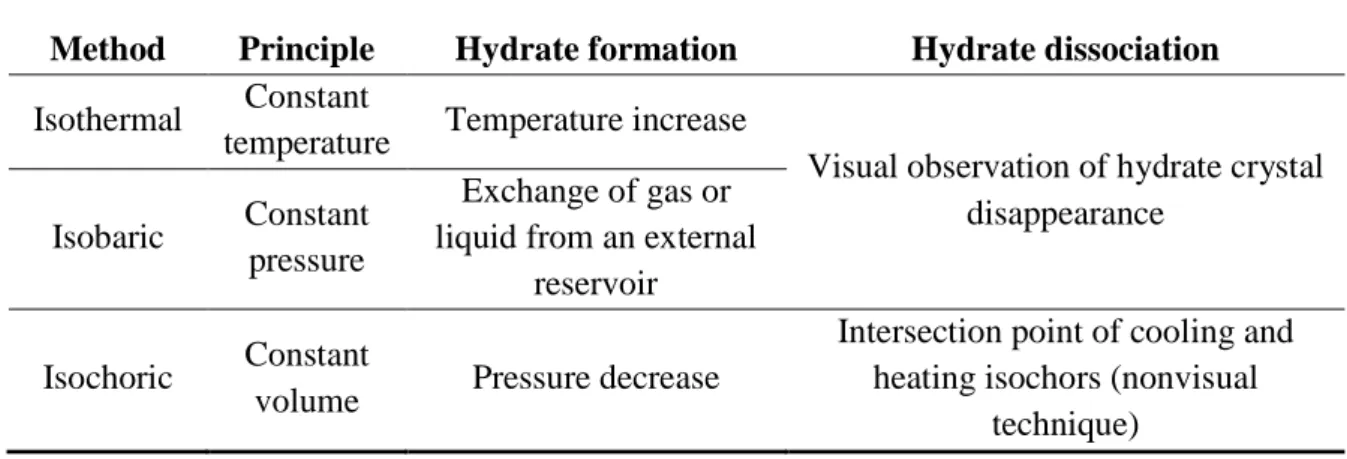
2.1 Commonly used experimental procedures for measuring hydrate dissociation conditions ... 50
2.2 Pressure transducers calibration coefficients... 63
3.1 Purities and suppliers of chemicals ... 72
3.2 Operating conditions of the gas chromatograph. ... 74
4.1 Experimental data reported in the literature for the dissociation conditions of the binary gas hydrates of (carbon dioxide + methane). ... 90
4.2 Experimental data reported in the literature for the p, T, and composition of the gas and hydrate phases at (Lw-H-G) equilibrium conditions for the binary clathrate hydrates of (carbon dioxide + methane) ... 90
4.3 Main characteristics of previous and new experimental setups. ... 91
5.1 Literature phase equilibrium data of the (carbon dioxide + nitrogen + water) ternary hydrate system. ... 115
5.2 Review of the compositions of the gas and hydrate phases at hydrate equilibrium conditions reported in the literature for (carbon dioxide + nitrogen + water) ternary system. ... 115
5.3 Literature review of the experimental data on compositions of the gas and hydrate phases for the (carbon dioxide + hydrogen + water) systems. ... 116
5.4 Summary of the hydrate phase equilibrium data measured in this work for (CO2 + N2 + H2O) systems. .... 124
5.5 Experimental studies on molar compositions of gas hydrates formed in the (CO2 + H2 + H2O) ternary systems. ... 132
5.6 Summary of the hydrate phase equilibrium data measured in this work for the (CO2 + H2 + H2O) systems 133 6.1 Experimental data available in the literature for (CH4 + TBAB) semi-clathrates ... 137
6.2 Experimental data available in the literature for (CO2 + TBAB) semi-clathrates. ... 137
6.3 Experimental data available in the literature for (N2 + TBAB) semi-clathrates ... 137
6.4 Experimental data available in the literature for (CO2 + N2 + TBAB) semi-clathrates. ... 138
6.5 Purities and suppliers of materials ... 140
6.6 Semi-clathrate hydrate phase equilibrium data for the (CO2 + N2 + TBAB + H2O) systems ... 149
6.7 Operating conditions of a conceptual CO2 hydrate-based separation process from (CO2 + N2) gas mixtures at two concentrations of TBAB in aqueous solutions. ... 158
8
List of symbols
AARD absolute average relative deviation [%] ARD absolute relative deviation [%]
B coefficient of density correlation DE differential evolution
e parameter of coefficient equation for density correlation
f fugacity or parameter of coefficient equation for density correlation
F number of independent variables or degrees of freedom
g parameter of coefficient equation for density correlation
G gas H hydrate
H Henry’s constant [MPa]
HDC hydrate dissociation condition L liquid n number of moles N number of components p pressure [MPa] q hydration number RD relative deviation [%] ttime (min, s) T temperature [K] V volume [m3]
v molar volume [m3/mol]
x mole fraction in liquid/aqueous phase y mole fraction in gas phase
w mass fraction
z water-free mole fraction of CO2 in hydrate phase
Greek Letters
η refractive index
π number of phases
ρ density
9
i i unknown variables
D refers to refractive index in nD
m refers to gas mixture
L = large cage S = small cage
R retention tine in gas chromatography W water
1 refers to carbon dioxide
2 refers to methane, nitrogen or hydrogen 3 refers to water
Superscripts
exp experimental G gas phase H hydrate phase L liquid phase pred predicted t total10
1
Introduction
P re s s u re Temperature Isochoric method 0 10 20 30 40 270 275 280 285 290 295 N2 CH4 CO2 Temperature (K) P re s s u re ( M P a ) Gas mixture suitable p, T conditions Liquid phase Hydrate-based CO2 Capture ProcessSuitably sized hydrate former
11
1
Résumé
Ce chapitre introductif présente le contexte industriel et les motivations liés à la recherche sur les hydrates de dioxyde de carbone. Cette thèse est consacrée à l´étude expérimentale des équilibres de phases de systèmes conduisant à la formation d´hydrates de dioxyde de carbone. En conséquence, nous donnons tout d´abord un aperçu général sur les hydrates et les clathrates, ainsi que sur leurs applications potentielles dans l'industrie et en génie des procédés, y compris dans le domaine du captage de CO2. Les principes fondamentaux des équilibres de phases en présence d´hydrates et l'utilisation de promoteurs thermodynamiques permettant d´améliorer les conditions de formation d'hydrates sont mis en évidence. Enfin, nous décrivons les objectifs et les grandes lignes de la thèse.
Abstract
This introductive chapter provides the industrial context and motivations behind carbon dioxide hydrate research. As this thesis is concerned with the phase equilibria of carbon dioxide hydrate-forming systems from experimental point of view, a general overview to clathrate hydrate compounds and their potential application in industry and process engineering, including CO2 capture is given. The fundamentals of hydrate phase equilibria and the use of thermodynamic promoters to enhance the hydrate formation conditions are highlighted and finally, the aims and the outline of the thesis are presented.
12
1
Introduction
1.1 The Growing Need for CO2 Capture
One of today’s major challenges within process engineering is the implementation of safer, economical and sustainable technologies to meet human ever-increasing needs. Accurate thermodynamic data form the basis in determining the feasibility of applying new processes in industry. This thesis deals with experimental thermodynamics aspects in the context of an alternative carbon dioxide (CO2) separation approach, through gas hydrate formation.
It is believed that global atmospheric concentrations of CO2, methane (CH4) and nitrous oxide
(N2O) have significantly increased as a result of continued economic development and
industrialization. Preliminary estimates show a global increase in CO2 emissions of more than
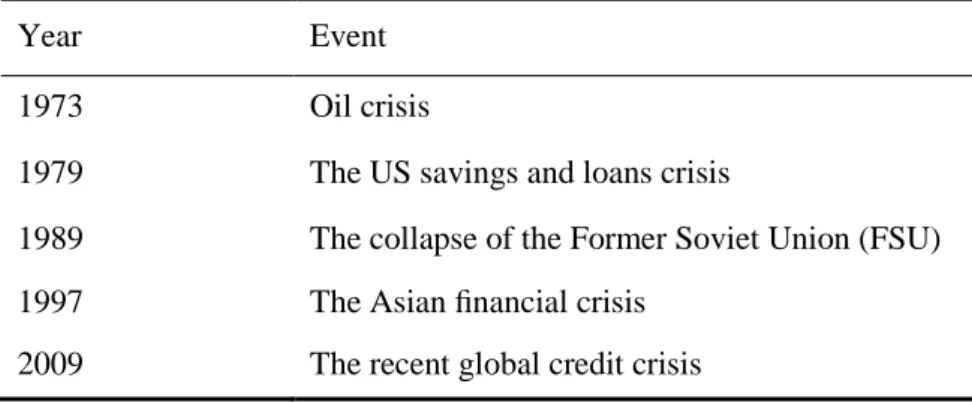
5 % in 2010 alone, which is the highest growth rate registered over the past two decades (Olivier et al., 2011),as evidenced in Figure 1.1. The major recent economic crises leading to important growth of global CO2 industrial emissions are listed in Table 1.1. In addition to the
increasing levels of CO2 and other greenhouse gases in the atmosphere, global mean surface
temperatures have also increased (IPCC, 2007).
As a result, two major issues arise from today’s global energy discussion. The first is centered on the role of CO2 in climate change and the second is the long-term sustainability of energy
supply. Doubling or even tripling of the global energy demand is expected by 2050 (World Energy Council, 2012), while the latest IPCC (2007) assessment calls for 50 to 85% reduction in global emissions during the same period, in order to avoid dangerous changes in the atmosphere.
In light of these issues, worldwide efforts for a coordinated cooperation in scientific and public policy matters around environmental and energy goals, have resulted in the creation of international conventions and treaties, such as the Kyoto Protocol, promoted by the United Nations Framework Convention on Climate Change (UNFCCC). Within this context, sustainable development, energy supply security and mitigating climate change are the main drivers for energy research beginning the twenty first Century (European Commission, 2007). Carbon dioxide Capture and Storage (CCS) have thus become a priority within energy research. CCS refers to capturing CO2 directly from the emission sources by technological
13 primarily concerned with CO2 capture applications, no further discussion is given to carbon
dioxide transportation or sequestration technologies.
Figure 1.1. Worldwide CO2 industrial emissions and economic recessions in the past 50 years
(modified from Peters et al., 2012). CO2 emissions are given in Petagrams (Pg) of carbon per
year. A Petagram is equal to a trillion (1,000,000,000,000) kilograms or a billion (1,000,000,000) tones. Linear trends are fitted to the five years preceding the beginning of each crisis.
Table 1.1. Summary of major economic crises leading to important growth of global CO2
industrial emissions since the 1960s, as shown in Figure 1.1 (Peters et al., 2012).
Year Event
1973 Oil crisis
1979 The US savings and loans crisis
1989 The collapse of the Former Soviet Union (FSU)
1997 The Asian financial crisis
14 As stated in the European Commission (2007) report, current priorities within CO2 capture
include: CO2 separation from flue gas (CO2 + nitrogen), CO2 separation from synthetic fuels
(CO2 + hydrogen) and CO2 separation from biogas (CO2 + CH4). Consistent with these
imperatives, this thesis contributes to the three preceding CO2 capture objectives.
In 2007, the SECOHYA CO2-Hydrate Separation project was established in France, jointly
with the Agence Nationale de la Recherche (ANR) and five academic partners. The goal of this project is to develop a separation process to capture CO2 based on a principle of gas
hydrate crystallization (SECOHYA, 2007). The Thermodynamics and Phase Equilibria Laboratory (CEP-TEP) from MINES ParisTech, as member of this partnership, was requested to perform accurate hydrate phase equilibrium measurements of (carbon dioxide and methane, nitrogen or hydrogen) gas mixtures in the presence of tetra-n-butyl ammonium bromide (abbreviated TBAB) aqueous solutions. The scope of the task was specifically targeted to enhancing the fundamental knowledge of hydrate formation and dissociation and elucidating the promotion effect of the latter additive, from thermodynamic point of view (SECOHYA, 2007).
Although the phase behavior of gas hydrates has been extensively studied for decades, better understanding of thermodynamics of CO2 hydrate-forming systems and reliable phase
equilibrium data in the presence of thermodynamic additives are fundamental for developing thermodynamically well-founded models and to establish the feasibility of industrial processes involving carbon dioxide hydrates.
1.1.1 Carbon dioxide: Properties, formation, and phase behavior of the CO2 + water system Before studying the stability of mixed hydrate systems containing carbon dioxide, it is useful to consider some properties of CO2 as a pure compound, as well as the phase behavior of CO2
+ water (H2O) mixtures.
Carbon dioxide is a colorless, non-polar compound. It is considered non-harmful (below 1%, by volume), naturally abundant, inert and relatively cheap. Carbon dioxide has a triple point at a temperature of 216.6 K and pressure of 0.519 MPa (NIST WebBook, 2001), and a critical point located at 304.2 K and 7.380 MPa (NIST WebBook, 2001). Along with methane, ethane and propane, carbon dioxide is one of hydrate formers typically found in natural gas (Sloan & Koh, 2008).
15
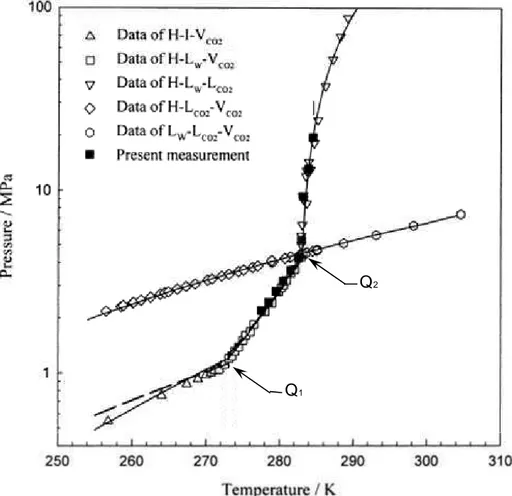
Q1
Q2
Figure 1.2. Carbon dioxide hydrates phase equilibrium in CO2 + water system. Symbols
represent experimental data and lines are calculated three-phase equilibrium pressures using a lattice fluid equation of state (Yang et al., 2000).
Most relevant properties of carbon dioxide hydrate include: a density of 1120 kg · m³ at 276 K, measured via X-ray diffractionby Udachin et al. (2001); and molecular weight and molar volume values of 0.1556 kg · kmol and 1.389 · 10-4 m3 · mol-1, respectively, reported by Anderson (2003).
Figure 1.2 illustrates the phase behavior of CO2 + water (H2O) system, involving the
formation of hydrate (H), water-rich liquid (LW), CO2-rich vapor (VCO2), CO2-rich liquid
(LCO2), and ice (I) phases. From this pressure-temperature phase diagram it can be seen that
the stability region of CO2 hydrates lies in the middle of the hydrate + ice + vapor (H–I–
VCO2), hydrate + liquid water + vapor (H–LW–VCO2) and hydrate + liquid water + liquid CO2
(H–LW–LCO2) equilibrium curves. Any pressure-temperature condition within this region will
lead to the coexistence of CO2 hydrates together with gaseous CO2 and liquid water. The
16 the (CO2 + H2O) system is 1048 KPa at 271.8 K (Larson, 1955). Two quadruple points are
distinguished, namely Q1 and Q2, located at (T = 273.1 K; p = 1.256 MPa) and (T = 283.0 K;
p = 4.499 MPa), respectively (Sloan, 1998).Q1 is the quadruple point, where ice + water +
hydrate + gas (I-LW-H- VCO2) coexist, while Q2 is a (LW-H-VCO2-LCO2) equilibrium point.
The idealized dissociation of CO2 hydrate to gaseous CO2 and liquid water at the (H–LW–
VCO2) equilibrium can be represented through the following equation:
CO2 · qH2O(s) ↔ CO2 (g) + qH2O (l) (1.1)
where q represents the number of hydrate water molecules per guest molecule, namely hydration number. The concept of hydration number is used later in Chapters 4 and 5 for determining the composition of mixed hydrate systems.
Based on reaction (1.1), the amount of energy required for dissociating CO2 hydrates (per
mole of CO2 in the hydrate) has been reported to vary from (57.7 to 65.22) kJ · mol−1
(Anderson, 2003). This advantageous exothermic nature of CO2 hydrate’s formation
compared to the heat of CH4 hydrate dissociation (54.49 kJ· mol−1) can be fully exploited for
sequestering CO2 with simultaneous production of natural gas from methane hydrates (Goel,
2006).
Gaseous carbon dioxide is mainly formed as a by-product from combustion of fossil fuels (e.g. natural gas, coal and oil). The combustion of all carbon-based fuels follows a very similar chemical reaction. As an example, the well-known reaction of carbon with oxygen is given below, where CO2 enthalpy of formation is -393.5 kJ · mol−1,as reported in the NIST
WebBook (2001).
C + O2 → CO2 (1.2)
The major industrial sectors releasing CO2 to the atmosphere include: thermal power
generation, cement production, natural gas and oil refining, gas flaring, iron and steel production, gas leakages and waste (OECD/IEA, 2008). Since fossil fuels are usually combusted with excess air, other compounds are also formed together with CO2, i.e. nitrogen
(N2), carbon monoxide (CO), water vapor, oxygen (O2), etc.The ratio of these products in the
exhaust gases and the exact temperature and pressure conditions depend on the plant type, operating conditions and the parameters of the combustion process (Tzimas & Peteves, 2003).
17 Indeed, the majority of CO2 emission sources have a molar CO2 concentration that has been
reported to vary from roughly 15 mole % in flue gases, to about 4 mole % in natural gas combustion in combined cycle (IEA, 2001). Whereas in other processes involving hydrogen (H2) production from fossil fuels, e.g. steam-natural gas reforming and/or integrated coal
gasification power plants, a stream of almost pure CO2 is produced (~ > 95 mole %.) In such
processes, it has been estimated that one ton of H2 produced may also produce about 9 tons of
carbon dioxide (Collodi & Wheeler, 2010).
As result of its increased concentration (0.039 %, by volume) in the atmosphere (NOAA, 2012), carbon dioxide is currently considered a primary greenhouse gas contributing to the so-called global warming effect. Regardless remaining controversies and debates on this issue, research efforts are currently undergoing worldwide for continuing the development of technological solutions to enable CO2 capture.
1.1.2 Solutions for Capturing CO2
According to the Intergovernmental Panel on Climate Change (IPCC) special report on CCS, the power plants activity constitutes more than 60 % of CO2 emissions, where N2 and CO2 are
the most significant components (IPCC, 2007). On the other hand, the IEA (2008) assessment states that CCS technology alone has the potential to reduce greenhouse gas emission by 20 % by 2050. CCS is thus recommended as “…one of the most promising solutions to stabilize atmospheric levels of CO2…”(IPCC, 2007).
Based on process conditions, such as: CO2 concentration, temperature, pressure, fuel type and
degree of required CO2 removal from the feed; most common CO2 capture technologies fall
under three general categories, namely: post-combustion, pre-combustion and oxy-fuel combustion. The first two approaches are considered economically feasible under specific conditions, while the third one is at demonstration phase (IPCC, 2007). The Lacq oxyfuel combustion CCS project, briefly described below, is an example of this. A variety of processes have been thus developed for separating and capturing CO2, and many of them are
commercially available, as indicated in Table 1.2.
These processes are generally based on gas phase separation, absorption into a liquid, i.e. amines absorption (Rubin & Rao, 2002), adsorption on a solid, and more recently, hybrid techniques such as adsorption/membrane systems, etc.
h a p te r 1 P h .D . D is se rt a tio n V . B E L A N D R IA 1 8 Drawbacks High regeneration costs Degradation of solvents due to the presence of impurities and by-products
Low CO2 loading capacity
Solvent can form corrosive solutions with flue gases. Lost solvent precipitates. Large equipment size
Sorbent susceptible to
degradation
Cannot handle easily large
concentrations of CO2
Adsorption time is not
practical
Low degree of CO2 separation
Poor selectivity of sorbents to
CO2
Operation costs higher than absorption processes
Requires a high partial
pressure of CO2 in the feed
Capacity proportional to CO2
partial pressure and
temperature
Low selectivity of solvent
causes H2 losses
Low degree of selectivity to
CO2
Corrosion might be caused by
SO2
High cost of O2 production
Operation and capital costs similar to post-combustion processes
Advantages Well established process Solvent can be recycled
Degree of CO2 purity > 95%
Non dependence on human
operators, minimizing labor
costs
Likely to be incorporated in existing power plants without significant modifications Commercially available Sorbent can be reused
Low concentrations of CO2
yield an optimum performance
Requires less energy for
regeneration than chemical
absorption processes
Less expensive than
post-combustion capture
Commercially available Low maintenance required Needs less energy than PSA
Flue gas is mostly CO2 and H2O
Water can be removed by condensation
Separation of CO2 is relatively
inexpensive
No need of control equipment for impurities
Smaller size of equipment since
only O2 is supplied for
combustion Current
application
Separation of CO2
from natural gas and flue gases
Production of hydrogen (mainly for fertilizer manufacture) Refinery of liquefied CO2 Method Absorption (Chemical solvents) Adsorption (Solid sorbents) Physical absorption
e.g. Pressure Swing
Adsorption (PSA) and Temperature Swing Adsorption (TSA). Membrane separation Cryogenic separation p T and feed composition Near atmospheric pressure < 373 K 4 – 15 mole % CO2 > 0.5 MPa > 373 K ~35 mole % CO2 > 5 MPa < 323 K ~90 mole % CO2 Separation task / feed Flue gas (CO2 / N2) Syngas (CO2 / H2) Oxyfuel exhaust gas (O2 / N2) Capture approach Post-combustion Pre-combustion Oxy-fuel combustion
19 Some other innovative concepts have been reviewed by Granite and O’Brien (2005). They include: electrochemical pumps, metal organic frameworks, ionic liquids, and enzyme-based, cryogenic and bio-mimetic approaches. The progress of CO2 capture technologies is an extensive topic itself and it has been well covered, with different levels of detail, in several reviews available in the literature (Tzimas & Peteves, 2003; Aaron & Tsouris, 2005; Zachary & Titus, 2008; Yang et al. 2008; Figueroa et al. 2008; Pennline et al. 2008 and Herzog, 2009). Essentially, the major benefits and drawbacks of the three CO2 capture approaches; as well as approximate process conditions are summarized in Table 1.2.
It is worthwhile to note that the conditions of the feed differ somewhat for the three approaches. As stated by Tzimas and Peteves (2003) “syngas has a higher CO2 concentration than flue gas and it is generally available at a higher pressure and temperature”. Besides, it has been estimated that the exhaust gas from oxyfuel combustion is produced at even higher pressures at ambient temperature.
As can be seen in Table 1.2, many of these technologies have proved their technical feasibility for capturing CO2 from industrial emissions. However, to address the current lack of demonstrated capabilities for large-scale CO2 capture (Figueroa et al., 2008; Folger, 2010), a number of demonstration projects are planned or undergoing worldwide. Examples are the Mountaineer power plant in West Virginia (USA) and the Lacq project in France. The first started capturing a portion of a 20 MW coal-based plant CO2 emissions in 2009 using chilled ammonia. About 100,000 tons of CO2 per year are stored in a deep saline aquifer injection well. The cost of the project is US$70 million, and it could be expanded to 235 MW in 2014-2015, as reported by the National Mining Association (NMA, 2012). The Lacq project is Europe’s first integrated CO2 capture and storage facility using oxyfuel combustion technology, including CO2 injection in a depleted on-shore hydrocarbon reservoir (TOTAL, 2007). The test started in 2010 and it plans to capture 120,000 tons of CO2 over two years, at a cost of US$85.6 million (TOTAL, 2007).
In continuation to the above efforts, critical issues regarding large energy consumption, corrosion, foaminess, low capacities, safety and environmental concerns are the focus of most current CO2 capture research projects. As a result, the development of alternative energy efficient and less costly processes for CO2 capture is necessary. In this regard, gas hydrates
20 crystallization approach has been proposed as an emerging concept to capture CO2 (Spencer, 1997; Kang & Lee, 2000; Duc et al., 2007).
As gas hydrates (also denoted clathrate hydrates) have the capacity to store/separate gases, there is a large field of potentially interesting applications, such as CO2 sequestration and CH4 recovery from natural gas hydrates in deep sea sediments (Ohgaki et al., 1994), natural gas processing, storage and transportation (Koh, 2002), H2 separation from steam reforming processes (Sugahara et al., 2005), H2 storage (Strobel et al., 2006), sea water desalination (Seo & Lee, 2001), etc.
1.2 Gas Hydrates: An Introductory Overview
The purpose of this section is to provide a concise overview of clathrate hydrates fundamentals in order to set the theoretical formalisms for studying the phase equilibria of gas hydrate forming systems.
1.2.1 Historical Background
Prominent scientists of the 18th and 19th centuries including Joseph Priestley (1778), Sir Humphrey Davy (1810) and Michel Faraday (1823) are associated with the early discovery of gas hydrates (Makogon, 1997; Sloan & Koh, 2008). An approximation to hydrates’ composition was first reported for Cl2 hydrates (Faraday, 1823). Afterwards gas hydrate research remained mainly a scientific curiosity for more than a century. A considerable number of hydrate formers together with the pressure and temperature conditions at which they are formed and their chemical compositions were identified over this period, including CO2 hydrate systems investigated by Polish physicist and chemist Zygmunt Florenty Wróblewski in 1882 (Wróblewski, 1882).
Traditionally, the progress of clathrate hydrates research and development has been divided into three historical periods. Hammerschmidt’s discovery of hydrate plugs in natural gas pipelines in 1934 marked the beginning of an industry-oriented second research period (Sloan & Koh, 2008),
21 under the auspices of oil and gas companies. Most relevant research contributions related to CO2 hydrates within this second period include the determination of the hydrate phase boundary between (273 and 283) K in the mid-1900s (Deaton & Frost, 1946), and the classification of CO2 hydrate crystal as a structure I for the first time via X-ray diffraction technique (von Stackelberg & Müller, 1954).
More recently, the existence of natural gas hydrates as an energy resource (Makogon, 1965) intensified worldwide hydrate research interest within the scientific community and energy industry. This event established the beginning of the third historical research period.
Today gas hydrates are known to exist in the universe. The most common research interests on Earth focus in three large fields: 1) its avoidance in the oil and gas industry (Sloan & Koh, 2008), 2) as an alternative energy resource (Makogon, 2010), and 3) their beneficial application to novel technologies, such as: transport of natural gas as frozen hydrate (Gudmundsson & Hveding, 1995), high pressure SIMTECHE CO2 hydrate separation process (Tam et al., 2001), air conditioning system using clathrate hydrate slurry (Obata et al., 2003), CO2 gas hydrate engine systems (Obara et al., 2011), etc.
The major scientific research achievements over the past two centuries are thoroughly reviewed by Davidson (1973), Makogon (1997), Sloan and Koh (2008), Giavarini and Hester (2011), etc. The contributions listed in Table 1.3 are meant to provide a chronological background to carbon dioxide hydrate research, from about 1778 until just before starting the present research (2007).
22 Table 1.3. Significant research contributions relevant to clathrate hydrate formation of CO2 and tetra alkyl ammonium salts from 1778 to 2007 (Makogon, 1997; Sloan & Koh, 2008).
1778 Priestley Formed SO2 hydrates
1st research period
1810 Davy Identified Cl2 hydrate
1823 Faraday Deduced Cl2 hydrate’s composition as
(C12·10H20)
1882 Cailletet and Bordet
Wróblewski
Measured mixed gas hydrate systems: CO2
+ PH3 and H2S + PH3
Studied CO2 hydrate formation in CO2 +
H2O system
1894 and 1897 Villard Determined CO2 hydrate composition as
CO2·6H2O and CO2 hydrate dissociation
curve in the range of (267 to 283) K
1902 de Forcrand Extensively used Clausius-Claypeyron
equation to determine enthalpies of dissociation and compositions of gas hydrates
1934 Hammerschmidt Realized that formation of natural gas
hydrates was responsible for plugging natural gas pipelines and discovered thermodynamic inhibitors
2nd research period
1940 Fowler Identified hydrates of tetra
alkylammonium salts (TBAX)
1946 Deaton and Frost Measured dissociation pressures of CO2
hydrates between (273 and 283) K
1949 Unruh and Katz Reported (LW–H–V) data for CO2 + CH4
mixed hydrates
1954 von Stackelberg and Müller Determined hydrate crystal structures I and II through X-ray diffraction and classified CO2 hydrate as a type I
1959 van der Waals and Platteeuw
(vdWP)
McMullan and Jeffrey
Proposed a statistical thermodynamic model for calculating hydrate formation conditions
Examined hydrates formed by quaternary alkylammonium salts using X-ray diffraction
3rd research period
1972 Parrish and Prausnitz Applied vdWP model to natural gases and
mixed hydrates
1984 Dyadin and Udachin Further investigated TBAX hydrates
1987 Ripmeester and coworkers Reported the existence hydrate structure H
hydrates
1997 Spencer Patented a method of selectively separating
CO2 from multicomponent gaseous
streams through CO2 clathrate formation
2000 Kang and Lee Proposed a new hydrate-based gas
separation process for recovering > 99 mole % of CO2 from flue gas using THF as
hydrate promoter
2003 Shimada and coworkers Found that TBAB hydrate crystals could
be used to separate small gas molecules
2007 Duc and coworkers Investigated (CO2 + N2) hydrates using
23 1.2.2 Definition and Crystalline Structures
Gas hydrates or clathrate hydrates are ice-like crystalline compounds, which are formed through a combination of water and guest molecules under suitable conditions of low temperature and high pressures (Sloan & Koh, 2008). In a gas hydrate, hydrogen-bonded ‘host’ water molecules form special cavities and ‘guest’ gas molecules are trapped inside the cavities. The hydrate structure is stabilized by the repulsive interactions between guests and hosts molecules (Sloan & Koh, 2008). The majority of gas hydrates are known three common crystal structures: structure I (sI), structure II (sII) and structure H (sH), where each structure is composed of a certain number of cavities formed by water molecules (Mohammadi & Richon, 2009a). Figure 1.3 provides a hydrate structure summary for sI, sII and sH.
As shown in Figure 1.3, all hydrate structures have repetitive crystal units. However, they differ in the number and sizes of the cages and in their unit cells.
Figure 1.4. Hydrate crystal unit structures: sI, sII and sH (Sloan, 2003). Shaded squares represent the number of cavity types, superscripts indicate the number of faces per cavity type and the shaded rectangles give the number of water molecules per hydrate structure.
24 Hydrate crystal structures I and II were first determined through x-ray diffraction methods by von Stackelberg and Müller (1954). They found that each structure is composed of a certain number of large and small cavities formed by water molecules. For example, structure I clathrate hydrates are composed of two 12-pentagonal (512) cavities and two 51262 (2-hexagonal face) cavities. The existence of a new hydrate structure, known as sH, was reported by Ripmeester and coworkers (1987). This third structure requires both large (~ 6-7 Å) and small (~ 4-5 Å)
molecules, such as light oil fractions and CH4, respectively. Many other structures beyond the scope of this work have been reported afterwards. Extensive reviews on clathrate hydrates crystalline structures are given by Sloan and Koh (2008) and Carroll (2009).
For a guest molecule to enter a cavity, it must meet dimensional, physicochemical and morphological criteria. Typical examples of hydrate forming substances include CH4, ethane (C2H6), propane (C3H8), CO2, N2, H2 and H2S. Of the gases of interest within this work, CO2 and CH4 are known to form sI as simple hydrates, while N2 and H2 have been classified as sII hydrate formers (Sloan & Koh, 2008). This could be explained by the ratios of molecular diameter to cavity diameter listed in Table 1.4. In simple hydrate formers, stable structures occur, as a rule, within the upper and lower limits in diameter ratios of about 1.0 and 0.76, respectively (Sloan & Koh, 2008). For instance, CO2 with a ratio of1.0 is capable of occupying both the small (512) and large (51262) cages of sI. Although the diameter ratio of CH4 to the small cavity of sII is 0.87, it has been determined that CH4 stabilizes the small and large cavities of sI with a diameter ratio of 0.86.
Table 1.4. Molecular diameter to cavity diameter ratio for cavity type for the gases of interest within this research (Sloan & Koh, 2008).
Guest hydrate
former Structure I Structure II
Molecule Diameter (Å) 512 51262 512 51264
H2 2.72 0.533 0.464 0.542 0.408
N2 4.1 0.804 0.700 0.817 0.616
CH4 4.36 0.855 0.744 0.868 0.655
25 In nitrogen hydrates, N2 stabilizes the small cavities of sII (size ratio of 0.82) and it also occupies in less degree the large (51264) sII cavities. At moderate pressures, in all three-hydrate structures, each cavity can contain at most one guest molecule (Englezos, 1993). However, it is interesting to note that since nitrogen is so small (~ 4 Å), more than one molecule can easily fit the large
cavities of sII. Hence, multiple cage occupancy can occur at pressures higher than 30 MPa (Sloan & Koh, 2008).
When two different guests molecules combine in a binary or mixed clathrate hydrate, the situation is quite different. Complex guest size–structural relations and/or transitions may occur and affect the thermodynamic equilibrium between coexisting phases. For example, the addition of 1 mole % C3H8 to pure CH4 hydrates has been reported to cause a decrease in the hydrate formation pressure of up to 42 % due to a structure change (Sloan & Koh, 2008). Crystalline structures thus play a significant role on the equilibrium state (three-phase temperature, pressure and gas hydrate composition) required for hydrate stability. The microscopic aspects discussed in the preceding paragraphs are meant to provide the basis for better understanding gas hydrates phase equilibria discussed in the following sections.
1.2.3 Phase Diagrams
The phase behavior of gas hydrates considerably changes depending on the size and chemical nature of guest molecules. The relationship between microscopic structure, just described, and macroscopic hydrate phase properties can be better understood through the study of phase diagrams. A brief description of phase diagrams for single-component, two-component, three-component and multithree-component systems is thus provided to gain a fundamental insight into the phase equilibria of hydrate forming systems.
A typical phase diagram for pure water exhibiting gas, liquid, and solid phases is shown in Figure 1.4. In the triple point, found at 273.16 K and 6.117 · 10-4 MPa (Lide, 2004), all three phases are in equilibrium. The phases are separated by phase boundaries, where phase transitions occur. The phase boundary between liquid and gas ends at the critical point, located at 647.1 K and 22.064 MPa (Wagner et al., 2000). Above this point a single fluid phase referred to as a supercritical fluid is formed.
26 Figure 1.3. Typical phase diagram for pure water (Perkins & Brady, 2007).
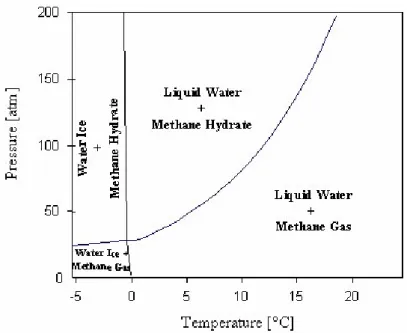
As an example of the phase behavior for two-component systems, the phase diagram of (CH4 + H2O) binary mixtures is considered. Depending on the pressure and temperature conditions, four stability regions are defined in Figure 1.5, namely: liquid water + methane gas (Lw + VCH4) located at high temperatures and moderate pressures; at high pressures crystallization occurs and the liquid water + methane hydrate (Lw + HCH4) zone appears; if temperature decreases, water ice + methane hydrate (I + HCH4) is formed; finally, a subsequent pressure decrease establishes the water ice + methane gas (I + VCH4) zone.
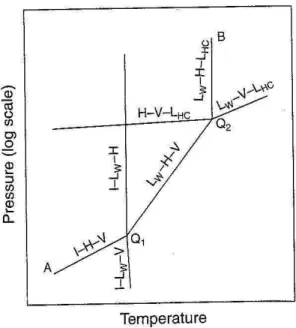
The phase diagram shown in Figure 1.6 is the equivalent of Figure 1.5 for systems containing hydrocarbon (e.g., C2H6, C3H8 or i-C4H10) + H2O, CO2 + H2O (Figure 1.1) or hydrogen sulfide (H2S) + H2O. In this diagram a three-phase (LW-V-LHC) equilibrium curve at high temperature and high-pressure conditions is depicted. Also, a second quadruple point, Q2, in which LW, H, V and LHC coexist, is formed at the intersection of the LW-V-LHC with the LW-H-V equilibrium curves. Similar to Figure 1.2, for systems with two quadruple points, the hydrate region falls in between the I-H-V curve (at conditions below Q1), the LW-H-V line (between Q1 and Q2), and the LW-H-LHC line at temperatures and pressures above Q2 (Sloan & Koh, 2008).
27 In Figure 1.7, the lower zone of the pressure-temperature phase diagram for natural gases without liquid hydrocarbon is similar to that shown in Figure 1.6. However, the main differences are that the LW-H-V curve occurs at a fixed composition of hydrocarbon mixture, and that the quadruple point (Q1) appears at a lower pressure. In the case in which natural gases contain heavier components, the (LW-H-V) phase boundary represents the hydrate formation region equivalent to the region between the quadruple point (Q1) and the upper quadruple point (Q2) of Figure 1.6(Sloan & Koh, 2008).
Figure 1.4. Pressure-temperature diagram for methane + water system in the hydrate region (GasHyDyn Center, ENSMSE).
28 Figure 1.5. Pressure-temperature phase diagram for hydrocarbon + water systems (Sloan & Koh, 2008).
Figure 1.6. Pressure-temperature phase diagram for multicomponent natural gas systems (Sloan & Koh, 2008).
29 In addition, the dew and bubble-point curves can be distinguished in the phase envelope region in Figure 1.7. At low pressures and moderate temperatures, the (LW-H-V) line intersects the phase envelope and a second liquid begins to form (LW-H-V-LHC). As pressure continues to raise, more of the second liquid forms as expected, until a point where the amount of the second liquid reaches a maximum. Beyond the critical point, the amount of the second liquid decreases until it totally disappears (Carroll, 2009).
1.2.4 Gibbs’ Phase Rule Consideration
In the above phase diagrams, the equilibrium relationships are established by the equality in all potentials likely to modify the system. Upon equilibrium, no further changes occur in the macroscopic properties of the system with time. Thus, the equilibrium state of a PVT system containing N chemical species and π phases is function of a certain number of intensive properties, namely: T, p, and composition of each phase (Smith et al., 2001). These measured quantities are independent of the amount of phase present.
In clathrate hydrates, the number of independent variables needed to specify the system (F), also called degrees of freedom, is given by the Gibbs’ Phase Rule for non-reacting systems, presented without derivation as (Smith et al., 2001):
F = 2 – π + N (1.3) The application of the Gibbs’ Phase Rule, in the thermodynamic analysis of systems under (hydrate + liquid + vapor) equilibrium, is addressed later in experimental Chapters 4 and 5.
1.2.5 Gas Hydrates Potential in Industry and Process Engineering
Although for many years gas hydrates have been considered an industrial concern, especially in oil and gas production and in processing and transportation facilities (Sloan & Koh, 2008), positive applications of gas hydrates are currently considered a subject of increasing research
30 interest, based on the number of studies recently published in the literature (Eslamimanesh et al., 2012).
Suitable conditions for clathrate hydrate formation may commonly occur in broad areas including energy and climate subject matters. During hydrocarbon production, gas hydrate formation may affect flow assurance and safety from wells to processing facilities (Sloan, 2003). In the natural environment, hydrates may be found in the sediments of the deep-sea continental margins, the subsurface of Arctic permafrost regions, and in deep glacial ice (Englezos, 1993). Other applications include hydrates as means of gas separation, storage material for H2, cool energy storage and recovery, seawater desalination, water removal from industrial effluents, edible products, and bioengineering (Sloan & Koh, 2008).
Domains of gas hydrates application also include power plants, oil and gas refining, hydrogen and ammonia processing, iron and steel manufacturing, cement production, natural gas production with high concentrations of acid gases (H2S and CO2), coal gasification, shift conversion, etc.
The role of gas hydrates in disasters such as the Macondo well blowout in the Gulf of Mexico in 2010 has been reported in the literature (Koh et al., 2011) and it is not addressed in this work.
1.2.6 CO2 Capture by Gas Hydrate Crystallization
Gas hydrates crystallization is a reversible process that has been proposed as an emerging concept for CO2 capture (Seo et al., 2000; Linga et al., 2007a). It has been estimated that hydrate-based processes are less energy intensive and thereby are considered a promising alternative for separating CO2 from industrial gases (Kang & Lee, 2000; Duc et al., 2007).
The approach of gas hydrates as means of separation, especially in CO2 capture, uses the van der Waals interactions between water molecules to encage gas molecules in the hydrate structure (SECOHYA, 2007). The concept consists in mixing water and a gas mixture containing CO2 under hydrate-forming conditions, typically (and unless some appropriate additives are used) at low temperatures (< 300 K) and moderate pressures (> 0.6 MPa).
31 1 10 100 1000 270 275 280 285 290 295 P re s s u re / M P a Temperature / K nitrogen methane carbon dioxide hydrogen
Figure 1.7. Carbon dioxide hydrate phase boundary compared to nitrogen, hydrogen and methane. CO2, CH4 and N2 hydrate phase boundaries were predicted using HWHYD model and the point for H2 hydrates is the data point reported by Mao and Mao (2004).
Based on the difference in the pressure and temperature conditions required for CO2 hydrate formation compared to other industrial/flue gases (Figure 1.8), it is expected that CO2 will preferentially enter the hydrate phase and thereby be separated.
Figure 1.9 shows a schematic flow diagram of the hydrate-based gas separation (HBGS) process suggested by Kang et al. (2000), especially for recovering CO2 from flue gas. The flue gas from a power plant is first passed through the commercial desulfurization facility for SOX removal. The pretreated flue gas goes to the first hydrator charged with an aqueous solution containing thermodynamic additive. However, the next two hydrators contain only water. More than 99
32 mole % of CO2 is expected to be removed from the flue gas through this process (Kang et al., 2000).
When gas hydrate crystals are formed the concentration of CO2 in the hydrate phase is different than that in the original gas mixture. The CO2-rich phase is then dissociated by depressurization and/or heating at ambient temperature to recover the enriched CO2 gas. This results in a fractionation similar to that between a gas phase and a liquid phase in a distillation column. The main difference is that the fractionation is between a gas phase and a solid phase (SECOHYA, 2007).
A noticeable progress in processes involving CO2 gas hydrates can be evidenced through the studies reported in the literature. Among the most recent proposals, Surovtseva et al. (2011) have suggested a CO2 capture technology incorporating two low-temperature processes, namely cryogenic condensation and hydrate formation. This separation approach, as shown Figure 1.10, can be applied to industrial gasification facilities, where more than 80 mole % of CO2 is expected to be captured at temperatures around 275 K and pressures above 5 MPa.
In CO2 recovering from flue gas, pressure, temperature and compositional data are useful for engineering purposes. The isothermal p-x diagram given in Figure 1.11 conceptually illustrates the two-stage separation required to achieve the recovery of more than 95 mole % CO2 from a (CO2 + N2 + H2O) mixture by hydrate crystallization (Kang & Lee, 2000). Because of the importance of such data, simultaneous compositional analysis and hydrate phase equilibria measurements have been considered within the scope of this work.
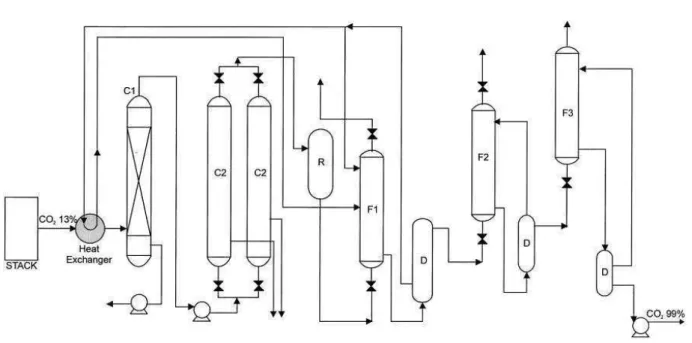
33 Figure 1.8. Flow diagram of a hydrate-based CO2 recovery process, as proposed by Kang and Lee (2000). C1: precipitator, C2: condenser, D: dissociation unit, R: reservoir, F1: first hydrator containing thermodynamic additive aqueous solution, F2 and F3: second and third hydrators.
Figure 1.9. Flow diagram of an integrated cryogenic and hydrate CO2 capture process, as suggested by Surovtseva et al. (2011).
34 Figure 1.10. Conceptual separation stages required for recovering CO2 from (CO2 + N2) hydrates at three different temperatures, as proposed by Kang and Lee (2000).
As shown in Figure 1.8, high pressure conditions are in theory required to form hydrates from gas mixtures containing N2 or H2. However, flue gas emissions are in general close to atmospheric pressure (Table 1.2). Operative costs would significantly increase if compression of these gases is considered in order to satisfy hydrate formation conditions. This is a major drawback of hydrate-based separation processes that reduces its energy efficiency. The impact of such phenomenon could be, however, minimized by using thermodynamic promoters. Consequently, there has been recently an increased interest in some large guest molecules that promote hydrate formation, known as thermodynamic additives. Such chemicals shift the hydrate phase boundary, reducing the pressure and amount of cooling required for gas hydrate formation.
As mentioned earlier, potential domains of application of hydrate crystallization approach include: seawater desalination, wastewater treatment, oil and gas separation, storage and transportation of natural gas, and CO2 capture. Thus, the study of thermodynamic additives capable of reducing the hydrate formation pressure and increasing the gas hydrate equilibrium temperature and/or formation rate along with possible modification of the selectivity of hydrate
35 cages for encaging various gas molecules in the water cages (Mohammadi et al., 2011a) has become an emerging subject of industrial and scientific interest.
1.2.7 Use of Thermodynamic Promoters
Gas hydrate based-separation processes could be improved by looking for appropriate thermodynamic additives to decrease the operative pressure when necessary. Since the presence of thermodynamic additives alters the state of the liquid phase, the pressure-temperature conditions at which hydrates form are consequently shifted to milder conditions. In recent years, considerable efforts have been made to investigate gas hydrate crystallization approach for separating a specific gas constituent from a multi-component gaseous mixture under favorable temperature and pressure conditions.
Table 1.5 provides an overview of the state-of-the-art on hydrate phase equilibrium studies reported in the literature by the time this research began (in 2008). Emphasis is given to gas mixtures containing CO2, CH4, N2 or H2. Up to date studies are referred in later sections. Furthermore, an exhaustive compilation of hydrate phase equilibrium data is provided by Sloan and Koh (2008). Also, other studies can be found in a comprehensive review by Eslamimanesh and coworkers (2012).
The selection of appropriate thermodynamic additives is subjected to the potential field of application. Various intermediate sized hydrocarbons have been identified as thermodynamic promoters, namely the sII hydrate-formers: cyclopentane, neopentane, benzene, and cyclohexane, and the sH hydrate-formers: methylcyclopentane, methylcyclohexane, neohexane, and 2,2,3 trimethylbutane. Such intermediate sized hydrocarbons are known as heavy hydrate formers (HHF). Common for the HHFs is their relatively low solubility in water. This characteristic may be attractive when considering, e.g., desalination or wastewater treatment where the main purpose of hydrate formation is to produce a cleaner water phase (SECOHYA, 2007).
36 Table 1.5. Literature experimental studies for hydrate phase equilibria of gas mixtures containing CO2 + CH4, N2 and H2.
1949 Unruh and Katz CO2 + CH4 + H2O
Reported phase equilibrium data and determined vapor phase concentration indirectly
1971 Robinson and
Mehta CO2 + H2O
Measured CO2 hydrate phase equilibrium at T = 274
– 283 K and p = 1.3 – 4.5 MPa 1983 Berecz and
Balla-Achs CO2 + CH4 + H2O
Hydrates exhibited instability at CO2 mole fraction >
50% 1991 Adisasmito and
coworkers CO2 + CH4 + H2O
Confirmed and extended Unruh and Katz data. Demonstrated feasibility of using gas hydrates as separation method of CO2 from CH4-rich gases.
1996 Ohgaki and
coworkers CO2 + CH4 + H2O
Measured P and compositional (LW–H–V)
equilibrium data at 283 K 1997 Spencer CO2 + H2 + H2S + H2O
Patented the principle of CO2 capture by gas hydrate
crystallization 1999 Fan and Guo CO2 + CH4 + H2O
CO2 + N2 + H2O
Concluded that a 3.48 mole % CH4/CO2 slightly
increases the hydrate formation pressure and N2
significantly increases hydrate formation pressure compared to pure CO2 hydrates
2000 Seo and coworkers
CO2 + CH4 + H2O
CO2 + N2 + H2O
Measured (H-Lw-V) equilibrium dissociation conditions and hydrate and vapor phase compositions
2001 Kang and
coworkers CO2 + N2 + H2O
Studied p-T ranges of hydrate stability with and without hydrate promoter. Demonstrated high pressure requirements in the case without additive 2002 Hachikubo and
coworkers CO2 + CH4 + H2O Reported (LW-H-V) equilibrium data 2004 Tajima and
coworkers CO2 + N2 + O2 + H2O
Compared various CO2 separation processes and
showed that gas hydrate technology consumes the largest amount of energy due to the higher pressure conditions required to form hydrates
2005 Uchida and
coworkers CO2 + CH4 + H2O
Measured the change of vapor-phase composition using gas chromatography and Raman spectroscopy 2005 Sugahara and
coworkers CO2 + H2 + H2O
Investigated isothermal phase equilibrium (pressure–composition in the gas phase) in
the presence of gas hydrate phase
2006 Kumar and
coworkers CO2 + H2 + H2O
Determined incipient equilibrium hydrate formation conditions 2007 Duc and coworkers CO2 + H2O N2 + H2O CO2 + N2 + TBAB + H2O
Compared equilibrium pressure of CO2 and N2 pure
hydrates with and without TBAB. Concluded hydrate crystallization pressure decreases by a factor from 10 to 50 for both CO2 and N2 hydrates when
adding TBAB 2007 Linga and
coworkers
CO2 + N2 + H2O
CO2 + H2 + H2O
Provided basic thermodynamic and kinetic data for conceptual process design
2008 Beltran and
Servio CO2 + CH4 + H2O
Measured (LW–H–V) equilibrium conditions and gas
phase compositions 2008 Bruusgaard and
coworkers CO2 + N2 + H2O
Measured (LW–H–V) equilibrium conditions