HAL Id: hal-01145798
https://hal.univ-lille.fr/hal-01145798
Submitted on 29 Apr 2015HAL is a multi-disciplinary open access
archive for the deposit and dissemination of sci-entific research documents, whether they are pub-lished or not. The documents may come from teaching and research institutions in France or abroad, or from public or private research centers.
L’archive ouverte pluridisciplinaire HAL, est destinée au dépôt et à la diffusion de documents scientifiques de niveau recherche, publiés ou non, émanant des établissements d’enseignement et de recherche français ou étrangers, des laboratoires publics ou privés.
Usage of e-journals in French business schools
Claire Leduc, Joachim Schöpfel
To cite this version:
Claire Leduc, Joachim Schöpfel. Usage of e-journals in French business schools. Electronic Library, Emerald, 2015, 33 (2), pp.258-272. �10.1108/EL-03-2013-0046�. �hal-01145798�
Usage of E-Journals in French Business Schools
Claire Chédot Leduc
1and Joachim Schöpfel
2Introduction
Most of the usage studies on academic e-journals have been conducted with samples from research organisations or universities. This is not surprising in so far as they are the most important consumers of scientific information. Yet, they are not the only ones, and there are other institutions and organisations subscribing to e-journals, such as industrial research laboratories, engineering schools or business schools.
Business schools are interesting in so far as they are in a rapid transition. Initially, their goal was to develop business skills for top-level executives. Today, their scope is larger and includes management and other economic fields. In the past, they generally gave priority to the quality of teaching, professional experience and knowledge transfer from the corporate sector. Today, they also invest in research in order to gain scientific status and credibility and to improve their position in academic rankings (Shanghai, Financial Times etc.). For instance, they develop “impact strategies” and “centres of excellence” in specific domains so as to increase international visibility, attraction and expertise (social economy, wines and spirits market, Asia Pacific region etc.). At the same time, they are merging into more important structures, on different sites (multi-campus Paris/regions), with international partnerships. In France, there are around 250 business schools. Some are public structures, for instance the IAE institutes3, others are private institutions or run by local or regional Chambers of Commerce (consular schools). A few of them enjoy a wide renown and excellent reputation, such as HEC, Insead or ESSEC.
On account of the Bologna process, many French business schools have adapted their programmes to common European standards, with three (degree), five (executive) or even eight years (PhD programmes), and have often recruited academic faculty members for the development of research and scientific activities.
In this dynamic environment it is interesting to explore their usage of digital resources, especially of academic e-journals as the main vector of scientific information.
In past studies we described trends in usage of French universities and compared them to international findings (Boukacem-Zeghmouri & Schöpfel 2008). More recently, we conducted a nationwide usage study with French public and private customers of an international academic publishing house specialising in management, business and marketing (Schöpfel & Leduc, 2012). Our empirical data allowed for comparisons of usage from different sectors. In this sample, business schools represented 23% of the customer accounts but 36% of the overall budget, 69% of the subscriptions and 82% of the usage statistics. These figures were somewhat intriguing, suggesting specific features and high usage compared to other sectors. For this reason we decided to re-analyse our empirical data with a focus on business schools. What is their usage in terms of widely-known indicators? How do they compare to their public competitors, namely universities? What do we know from other studies? This is the first usage study involving French business schools.
1 International Business Institute ISCID-CO, University of the Littoral and Côte d’Opale, Dunkirk, France 2 Information and Document Science, University of Lille 3,Villeneuve d’Ascq, France
3
Review of literature
Recent research on usage and practice of academic e-resources reveals the disparity of digital usage and information behaviour between different disciplines or subjects (Boukacem & Schöpfel, 2013). Among this growing body of evidence and knowledge, so far only a small number of papers have been published on business schools and related disciplines such as business, management and economics.
The published data on usage related to business schools provides three different kinds of information:
Evidence on usage of digital resources in business schools as a specific environment. These are studies on usage statistics and digital information behaviour in business schools.
Evidence on usage of digital resources in Higher Education institutions that differentiates between scientific departments, including business, management and/or economics. These are mostly papers with results of usage studies in universities that distinguish between statistics and information behaviour from scientists, scholars and students from different scientific departments.
Evidence on usage of digital resources in different subjects, including business, management and/or economics. These are papers that compare usage statistics from different journals and journal packages.
Some studies focus on usage statistics derived from weblog analysis while others deal with quantitative or qualitative data on information behaviour. Yet it is generally admitted that usage and practice are closely related and that “computer usage logs provide an accurate picture of online behaviour” (Nicholas et al., 2010).
In the following section we outline some recent papers which focus on business schools, together with other studies that include business schools in their sampling or that cover the subjects mentioned above. These papers are exploratory and empirical, and they mostly apply COUNTER standards for data and metrics, such as full text article requests.4
Swain & Panda (2009a) highlight the specificity of usage in business schools, such as “their keenness on the use of various (...) e-resources available exclusively in the broad subject areas of management which includes economics, finance, marketing, international business, human resource management, and more” and their interest in keeping “a very close watch of the fast changing economic scenario of the world market (...) through some precise strategies for which they might prefer to access specific business-related web sites, e-news, and e-reports (...)”. At the same time, they state that the most preferred e-resources remain journals and articles.
Their interesting paper from India was accompanied by two other publications: Swain (2010) evaluated “the extent of students’ curiosity in the use of e-information for supplementing their scholarly needs” in the business schools of Orissa (India). His objective was to optimize the usage of electronic resources. Swain & Panda (2009b) conducted a survey with librarians to raise awareness, create tools and make available more e-resources.
This need for collaboration between library and academic areas, i.e. specific training and promotion, was put forward by Colvin & Keene (2004). In a study on a business school at the University College Worcester they observed that introducing new and more digital materials is not enough to change students’ research behaviour and to increase usage.
In a quite different environment – a Greek campus - high use of e-resources in a business school was reported by Korobili et al (2006): “Faculty within the School of Business
4 COUNTER is an “agreed international set of standards and protocols governing the recording and exchange of online usage data” that is useful for understanding, interpretation and comparison of usage statistics. See Shepherd 2010 and the COUNTER website at http://www.projectcounter.org/
Administration and Economics are heavier users of all the sources”. High usage means here, “higher than in other academic departments”.
Another, quite unique publication by Dewland & Minihan (2011) compared usage statistics with citation data for the local business school’s faculty, in order to evaluate the value of journal titles from the business library. Their usage data from 200 journals “while slightly concentrated, fell close to what the Pareto model predicts with 18% (36) of the journals accounting for 80% (14,558) of the use”. They also drew attention to the fact that a business collection is not homogenous but made up of different specialties that may be used and cited in different ways and by different communities.
Some of the research the CIBER group at University College London5 conducted in the last decade contains results that are of interest for business schools. In 2008, CIBER published data from a survey on information behaviour with 757 researchers matched to log files from Elsevier (Nicolas et al., 2008). 4% of the surveyed sample belonged to economics, mostly from Western Europe, the USA and UK. Compared to ten other subjects (life and medical sciences, social sciences …), this subsample differed in regard to five aspects:
They performed a lower number of visits.
They viewed a lower number of articles and journals per session.
They showed a high use of abstracts and regular or current material, but a lower use of articles in press or older material.
They used less material from other disciplines, i.e. they were less interdisciplinary compared for instance to researchers from engineering, chemistry or computer sciences.
They relied to a high extent on the journal and its prestige for the quality of an article. Another study with usage statistics from the Oxford University Press journal collection included data from 19 titles in economics, 31% of the total corpus (Nicholas et al., 2009). Based on 24,490 sessions and 66,827 page views, the data confirmed the high use of abstracts in this discipline but also, in contradiction to the former study, the use of older articles with a median age of six years. The authors added that apparently “economists use working paper repositories, such as SSRN and personal websites, for disseminating research but continue to rely upon society and commercial journals for final, archival publication” (see Harley et al., 2010 for further evidence).
Nicholas et al. (2010) produced evidence on usage and practice from a qualitative survey with 1,400 researchers belonging to six subjects. The subsample “economics and econometrics” was rather small and less representative, with only 1.7% respondents. Again, the study revealed a high use of abstracts but, inconsistent with the 2008 paper, stated that “economics researchers held (peer reviewed) journals in the lowest esteem (...) probably explained by the ‘working paper’ system in economics”. More than in other disciplines, they gave preference to team work, also for their information needs, and were least likely to undertake advanced searching.
Data from a joint JISC-CIBER project illustrated “considerable subject diversity in information seeking behaviour with respect to e-books” (JISC, 2009). The paper presented evidence that e-book collections were highly popular in business and management studies : “super-users (are) more likely to be found in business studies”. For instance, people spent longer time on page views in this subject.
Taken together, this small body of empirical evidence is not really consistent. There may be a variety of reasons, such as small samples, different methodology (quantitative vs. qualitative data), and different objects (usage vs. behaviour, researchers vs. journals/e-books). Moreover, usage and information behaviour may have changed since the cited studies were conducted (nomadism, mobile device, new services for example). Our intention is to add more evidence
5
to this field, applying a confirmed standard methodology of usage assessment to a consistent and representative sample of business schools and e-journals on business, management and economics. The objective is to explore the usage in this specific field and to compare the results with data from higher education and research, whenever possible.
Methodology
The empirical data on usage and subscriptions was provided by an international academic publisher considered as one of the most relevant and best known publishers of business and management journals (Swain & Panda 2009a). The sample consisted of 253 English language journals, all of them available via the publisher’s online platform, and of 21 business schools with nearly 56,000 authorized end users (students, scholars, staff). The surveyed usage period was January to December 2010. In other words, we analyzed all usage statistics from January 1, 2010, to December 31, 2010, as produced by the publisher for all business schools and all journals.
The surveyed sample contained only privately run business schools in Paris (seven schools) and in other French towns (fourteen schools); no public university business schools of management - “Instituts d'Administration des Entreprises” (IAE) - were included in this analysis, because IAE are integral parts of universities and it is not possible to distinguish their resources and usage from those of other university departments. A recent survey6 listed 65 private business schools in France. Because of their sometimes complex organisation and partnership structures it is not always easy to identify if and how schools are working together and sharing resources or if they are simply part of the same entity. Sometimes a business school is just a programme of another school; other schools are part of a network located in different towns. Not all of our surveyed schools could be matched against this list. Yet, even if the data is not totally reliable, the representative nature of the sample (i.e. the publisher’s market share) can be estimated at 20%. The 14 French business schools with accredited full-time or part-full-time Master of Business Administration (MBA) programmes are often considered as the best and most attractive establishments for graduate business education. With the exception of one, all of these schools are part of the sample. Two of them are among the top 20 schools in the Global MBA Rankings 2012 published by the Financial Times.7
A total of 2,302 subscriptions and 54,751 online requests were analysed. The usage statistics were analysed in the JR1 format of the COUNTER Code of Practice as produced by the publisher, counting successful full-text article requests by month and journal (=usage)8. This means that in the following, if not otherwise indicated, usage will always be understood as “successful full-text article requests”.
Some journal subscriptions were ordered individually, title by title, with acquisition of the print version and access to the online version on the publisher’s platform. Other subscriptions were part of big deals, e.g. access to journals on the publisher’s platform was licensed via packages (bundling). Our study did not consider the potential level of access for each customer institution (number of subscriptions) but put the focus on the real usage and on the actual costs (expenditures, budget) for digital resources from this specific publisher.
Online requests which could not be associated with a subscription were removed, and the usage data was enriched by additional data on packages, subjects and customers from the publisher’s catalogue and customer file.
Our methodology follows former studies such as Bevan et al. (2005), Boukacem-Zeghmouri & Schöpfel (2008) or the cited CIBER papers, with additional data on the cost of digital
6 Published by the French magazine of economics Challenge 2011(255). 7 http://rankings.ft.com/businessschoolrankings/global-mba-rankings-2012 8
subscriptions (from the publisher) and on the number of students (from the schools’ web sites). In those studies, the indicators proved to be efficient. The presentation of local metrics generally keeps to the COUNTER definition9 if not otherwise indicated.
The discussion relies on the comparison with the French universities that were present in the sample. Indeed those institutions offer similar teaching and research features, unlike specialized research centres. Moreover, they count up to a significant number that allows for the comparison with business schools.
Findings
Full-text article requests
During the surveyed period (January to December 2010), all business schools except three requested and accessed the subscribed journals on the publisher’s platform. Together, they performed 54,751 full-text article requests in 2010, ranging from 29 to 13,237 requests, with a median of 1,894 (mean value 3,220). The deviation from the mean is important: standard deviation is 3,703. The vertical axis in figure 5 shows significant differences between business schools. Apart from two institutions with high figures, most of the business schools had relatively low usage statistics, often with less than 3,000 requests in 2010.
Full-text article requests per title
The business schools accessed together 245 different journals with a large range from only 1 to 229 titles (median 153 titles, mean value 131, standard deviation 71). Again, the scattergram reveals significant differences (horizontal axis in figure 5).
Three schools had low values, and while the majority had request figures around the mean value, a group of five schools accessed a relatively high number of journals.
The average number of full-text article requests per title was 223, again with important differences, ranging from zero to a maximum of 2,646 requests for the European Journal of
Marketing.
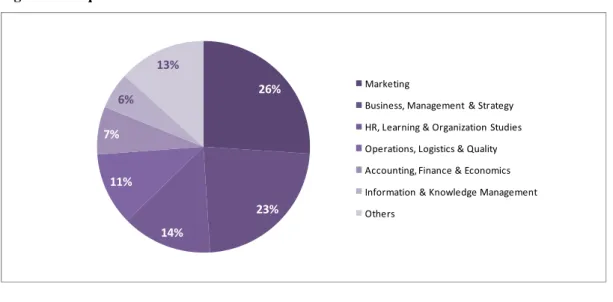
Full-text article requests per domain
The journal titles belong to thirteen different editor eras, according to the publisher’s indexing. Two of them – Marketing and Business, Management & Strategy – attracted 49% of all requests. Figure 1 shows the most important domains.
Figure 1 : Requested domains
26% 23% 14% 11% 7% 6% 13% Marketing
Business, Management & Strategy HR, Learning & Organization Studies Operations, Logistics & Quality Accounting, Finance & Economics Information & Knowledge Management Others
9
The category “Others” covers subject such as tourism, library studies, education, health and engineering – all more or less marginal with regards to business schools.
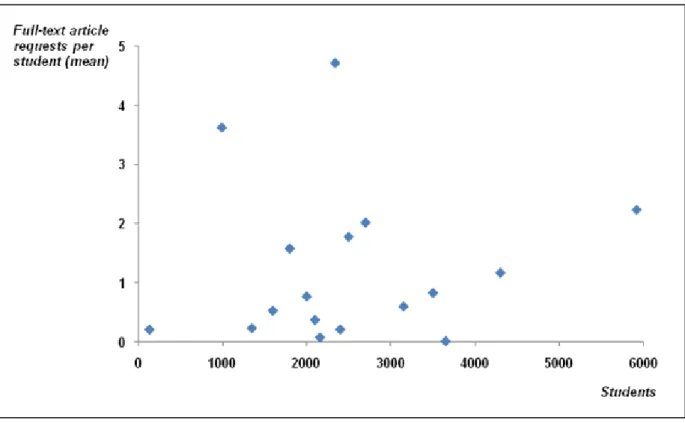
Full-text article requests per user
The mean number of article requests per user (student) for the whole sample in 2010 was 1.24, with a variation ranging from 0.01 to 4.72 requests. For the major part of the schools, students requested on average less than two articles in 2010.
Figure 2 : Mean number of full-text article requests per student (vertical axis) vs number of students (horizontal axis)
There is no strong link between the school size and the average full-text article request per student (figure 2). The points are rather scattered; in addition, some outliers should be, because of the small sample size, interpreted with caution. Spearman's rank-order correlation coefficient rho is .1642.
Most requested titles
The ten most requested titles or “high range titles” (Conyers 2006) received 27% of the overall traffic which indicates a relatively “centralised” usage, a result that confirms observations made by Dewland & Minihan (2011) on concentrated use and no real long tail. All these titles are in the fields of marketing or management. The most requested titles were the European Journal of Marketing, the Journal of Consumer Marketing, Management
Decision, the Journal of Product & Brand Management and the International Journal of Retail & Distribution Management.
Cost per full-text article request
The mean cost per full-text article request in 2010 was €9.11. Yet, the variation between institutions was important, with costs ranging from €1.04 to €30.41, and a standard deviation from the mean equaling €9.31. For about 60%, the costs per article request ranged between €1 and €5 (median €4.33). On average, larger schools had lower costs per article request than medium or small-sized schools; the highest cost (€30.41) matched with the smallest school. The Pearson correlation coefficient between the number of users and the cost per full-text article request is .49.
Cost per user (students)
Related to the number of students, the differences of investment were significant, ranging from €0.15 to €15.75. The average cost per user was €4.58 (median €4.17). Here again, larger schools usually performed better than smaller ones in so far as they spent on average less money per student. Perhaps a kind of economy of scale?
Extent of usage
A significantly large proportion of the journals were subscribed via big deals (packages or bundling) while others were ordered individually, title by title.
62% of the titles subscribed individually were not accessed at all on the publisher’s platform, probably because of a preference for the print version.
The extent of online usage for journals subscribed via packages was significantly higher – the business schools requested on average about 85% of the journals that are part of big deals. Four schools downloaded articles from more than 95% of the subscribed journal titles.
Obviously the mode of subscription has an impact on the usage of online resources. This difference is interesting because it may indicate that schools with a preference for individual subscriptions are just at the start of the transition from traditional print documentation to the hybrid or total digital library.
Discussion
Methodological shortfalls
The significance of our empirical results may be impacted by two methodological shortfalls. It was difficult to obtain reliable figures on user numbers. Thus, we only considered students as users, excluding faculty and other staff. Also, in some cases it may be difficult to attribute a request to a business school or a university since sometimes they overlap. Indeed, as mentioned above, many partnerships have been established between the two types of institution (even if in the surveyed sample none of the universities was a parent institution of a business school, but they have their own business programs), and one user may take advantage of the resources offered by the other.
It has to be noticed that in our sample, the number of users for business schools is less important than for universities (up to 8 times less, in average). Indeed, since resources are available for all students in universities, the number was not limited to students following business studies. As a consequence, cost per user may appear more advantageous for business schools, and cost per request less advantageous.
While these aspects do not appear to invalidate our results, we should be careful not to over-interpret our data because of the so-called “law of the small numbers” (Kahnemann 2011), i.e. statistical anomalies caused by a small sample.
Comparison with universities
Compared to university data from our national study on usage statistics of the same publishers and the same collections (Schöpfel & Leduc 2012), we can observe some significant differences (tables 1 and 2) which may be characteristic for business schools, at least for this sample and these special collections in business, marketing and management.
Table 1 : Cost metrics, in euros
Cost per full-text
article request Cost per user Mean nb (std dev) Mean nb (std dev)
Business Schools 9.11 (9.31) 4.58 (3.29)
Universities 114.67 (222.38) 2.25 (5.91)
In terms of expenses per user (students), the business schools spend more for the subscription of these journal collections than universities do.
At the same time, the average cost per full-text article request is lower than in universities. Note that the maximum value (€901.96) is reached by a university with only one request! Taken together, these results indicate a more intensive usage per student of these collections than in universities. Business schools pay more but their students use these resources more heavily than in universities. There may be more than one explanation: greater ease of use of English material because of the international orientation of business schools, a collection portfolio that fits better with the programmes and needs of business schools, perhaps also the lack of traditional academic library infrastructure.
Also, the annual distribution (monthly variation) of online usage is different especially between April and July when the usage statistics are higher in universities (period of exams) than for business schools (period of internships) (figure 3).
Figure 3: Annual distribution of usage statistics (full-text article requests)
The study also reveals different preferences at the level of domains and journal titles. Business schools accessed relatively more articles from the fields of Business, Management,
Strategy, Operations, Logistics and Quality while universities requested relatively more
documents from Accounting, Finance, Economics, Library Sciences, Information and
Knowledge Management and Engineering, topics which are (at least partially) not covered by
business schools. In contrast, journals from the domain of Marketing appear to be of similar high interest for both institutions, just as titles on Human Resources, Learning and
Organization Studies. These differences may, at least to some extent, reveal a kind of
cartography of contents, programmes and research interests from both institutions.
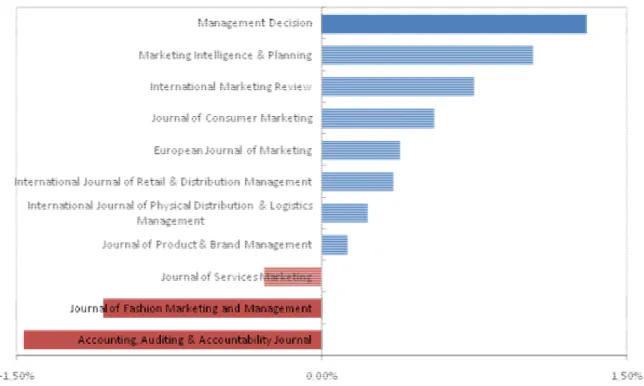
The comparison of the twenty most requested journals for both types of institutions reveals significant differences for one part of them (figure 4).
Figure 4: Usage differences for the 20 most requested journals (business schools in blue, universities in red)
For instance, the journals Management Decision (+1.3%) and Marketing Intelligence &
Planning (+1.2%) are more requested in business schools than in universities, while the Journal of Fashion Marketing and Management and the Accounting, Auditing & Accountability Journal have more success in universities than in business schools.
Compared to results from other studies, with different publishers, collections and customers and in other disciplines (in particular, Bevan et al. 2005, Boukacem & Schöpfel 2008 or Suseela 2011), we can add that the average number of full-text article requests per title is higher in business schools, which confirms a higher and more intensive use of subscribed digital resources (table 2).
Table 2 : Usage metrics
Full-text article request
Full-text article request per title
Full-text article request per user Mean nb (std dev) Mean nb (std dev) Mean nb (std dev)
Business Schools 3,220 (3,704) 131 (71) 1.24 (1.28)
The mean number of requests per user (student) is higher in business schools than in universities, which means that students of business schools accessed the resources more often than university students especially in the fields of science, technology and medicine (STM). The average costs per user and per full-text article request correspond to the mean level in French academic departments of business, law, social sciences and humanities but are higher than in STM (Boukacem & Schöpfel 2008).
The overall usage distribution in business schools is more centralised, with a concentration on some high ranked titles, i.e. a reduced number of journals attract a larger part of the requests, without a long tail of usage statistics, which may point to the same observation as made by Nicholas et al. (2008) – that users in the field of business, management and marketing rely more on quality and reputation of journals than others.
Clusters of business schools
We already spoke of some specific features and differences between business schools woth regards to full-text article requests and requests per title. Merged together in the same graphic, both usage data, i.e. number of full-text article requests (vertical axis) and number of accessed journal titles (horizontal axis) reveal four or five clusters of business schools (figure 5).
Figure 5: Full-text article requests (vertical axis) and requested journal titles (horizontal axis)
1. Low usage: On the left side, three business schools have very few journals and perform
only a small number of requests.
2. High usage: On the opposite side, two business schools have a high number of journals
and a high number of full-text requests.
These clusters may correspond approximately to the Bevan et al. (2005) description of “high use, high cost subscription” vs. “lower use but lower cost” institutions. Between these two extreme clusters, we can identify a group of twelve institutions with a mean to high number of journals and low or mean usage statistics. In fact, we can distinguish three clusters:
3. Limited usage: Five business schools produce low usage statistics in spite of a higher
number of accessed journals.
4. Mean usage: Four schools with mean levels of journals and usage.
5. Reduced usage: Three schools with a higher number of accessed journals but a
comparatively low level of usage statistics.
Maybe these last three clusters need advice and help for more intensive usage of their online subscriptions.
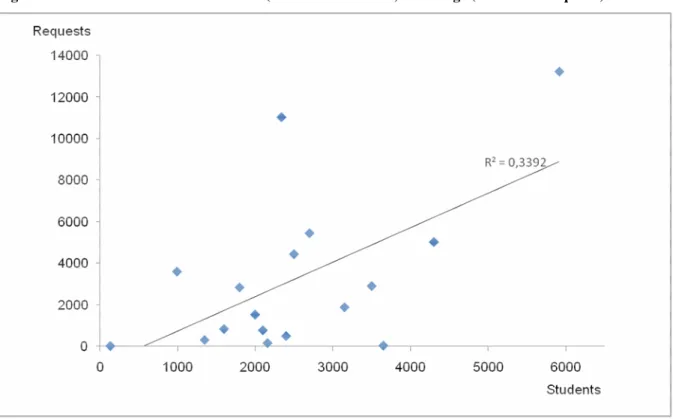
Metrics
Number of students (size) and usage statistics are correlated but the correlation is relatively weak, obviously because of some “extremes”, two or three schools with relatively high requests and three or four schools with relatively low requests, with regards to their size (figure 6).
Figure 6: Correlation between school size (number of students) and usage (number of requests)
But again, attention should be paid to the small sample size and the risk of statistical extremes (“law of the small numbers”). It may be more useful for this reason to consider the relationship between the ranking of size and usage and then to compare only the two clusters of “small and low usage” schools (top right) and “big and high usage” schools (bottom left), without interpreting the two other quarters (see figure 7).
Figure 7: Ranking of schools by size (number of students) and usage (number of requests), with medium rank (horizontal line).
The greater the usage (resp. size), the lower the rank. The best ranked French business schools appear on the lower side of the figure ( ).
The French business schools generally top ranked in national and international rankings, such as HEC, ESSEC or INSEAD, are all in the lower side of the figure, with relatively high usage figures even in smaller institutions. This may be related to more research activity (Williams et al. 2010) and/or a higher degree of internationality and usage of English-language resources.
Conclusion
Our study provided empirical evidence for usage of digital resources in business schools. As expected, the usage appears to be relatively intensive, especially when compared to usage statistics from universities in the same fields. This result may reflect an emerging research activity in business schools and a projected and required international orientation. Yet the study also reveals important differences between schools, a fact that should not be overestimated because of the small sample size, even if the sample is representative for French business schools.
Our recommendation for the business schools would be that, in order to increase usage and efficiency of subscribed digital resources, they should improve promotion and communication on these resources, facilitate access through portals, gateways and discovery tools, and monitor usage statistics and metrics.
Furthermore, we did not try to analyse the sample in connection with the disciplines and fields covered by the subscribed and accessed journals and collections. Subscriptions and usage figures reveal domain-specific preferences and options that may, following Dewland & Minihan (2011), explain and be the source of variations and differences in usage features. This could be the object of another study with a larger sample, with more institutions and different collections. In order to distinguish usage-related clusters of schools, we could also
apply more sophisticated scientometric approaches inappropriate in a smaller sample, such as concentration metrics and multifactorial analysis. In addition, we did not take into account all the other digital resources available in business schools, on-site or at distance.
Yet, usage is not practice. Statistics contain valuable information but do not explain information behaviour. For this reason we suggest a follow-up study that would integrate quantitative usage statistics and qualitative survey methodology, such as interviews, questionnaires and observations in the field, and include other items than journal collections, such as databases, working papers, reports, proceedings and dissertations. Nevertheless, so far as we can see, it is to be anticipated that such a study would probably confirm the intensive use and need of digital resources, outside of traditional library structures, which are quickly evolving and related to the development strategy of the business schools.
References
Bevan, S., Dalton, P. and Conyers, A. (2005), “How usage statistics can inform national negotiations and strategies”, Serials: The Journal for the Serials Community, Vol. 18, No. 2, pp. 116-123.
Boukacem-Zeghmouri, C. and Schöpfel, J. (2008), “On the usage of e-journals in French universities”, Serials, Vol. 21, No. 2, pp. 121-126.
Boukacem-Zeghmouri, C. and Schöpfel, J. (2013), “Beyond the Google generation: towards community-specific usage patterns of scientific information”, in Baker, D. and Evans W. (Ed.), Trends, Discovery, and People in the Digital Age, Chandos Publishing, Oxford.
Colvin, J. and Keene, J. (2004), “Supporting undergraduate learning through the collaborative promotion of e-journals by library and academic departments”, Information Research, Vol. 9, No. 2, paper 173.
Conyers, A. (2006), “Building on sand? Using statistical measures to assess the impact of electronic services”, Performance Measurement and Metrics, Vol. 7, No. 1, pp. 37-44. Dewland, J. and Minihan J. (2011), “Collective serials analysis: the relevance of a journal in supporting teaching and research”, Technical Services Quarterly, Vol. 28, No. 3, pp. 265-282. JISC (2009), “National E-Book Observatory Project. Key Findings and Recommendations”, Final Report, JISC, London, November.
Harley, D., Acord, S.K., Earl-Novell, S., Lawrence, S. and King, C.J. (2010), “Assessing the future landscape of scholarly communication: an exploration of faculty values and needs in seven disciplines”, Project Report, Center for Studies in Higher Education, University of California, Berkeley CA.
Kahneman, D. (2011), Thinking, fast and slow, Allen Lane, London.
Korobili, S., Tilikidou, I. and Delistavrou, A. (2006), “Factors that influence the use of library resources by faculty members”, Library Review, Vol. 55, No. 2, pp. 91-105.
Nicholas, D., Huntington, P. and Jamali, H.R. (2008), “User diversity: as demonstrated by deep log analysis”, The Electronic Library, Vol. 26, No. 1, pp. 21-38.
Nicholas, D., Clark, D., Rowlands, I. and Jamali, H.R. (2009), “Online use and information seeking behaviour: institutional and subject comparisons of UK researchers”, Journal of
Information Science, Vol. 35, No. 6, pp. 660-676.
Nicholas, D., Williams, P., Rowlands, I. and Jamali, H.R. (2010), “Researchers' e-journal use and information seeking behaviour”, Journal of Information Science, Vol. 36, No. 4, pp. 494-516.
Schöpfel, J. and Leduc, C. (2012), “Big deal and long tail: a case study on e-journal usage and subscriptions”, Library Review, Vol. 61, No. 7, pp. 497-510.
Shepherd, P.T. (2010), “COUNTER: current developments and future plans”, in The
Suseela, V.J. (2011), “Application of usage statistics for assessing the use of e-journals in University of Hyderabad: A case study”, The Electronic Library, Vol. 29, No. 6, pp. 751-761. Swain, D.K. (2010), “Students' keenness on use of e-resources”, The Electronic Library, Vol. 28, No. 4, pp. 580-591.
Swain, D.K. and Panda, K.C. (2009a), “Use of e-services by faculty members of business schools in a state of India: a study”, Collection Building 28, No. 3, pp. 108-116.
Swain, D.K. and Panda, K.C. (2009b), “Use of electronic resources in business school libraries of an Indian state: a study of librarians' opinion”, The Electronic Library 27, No. 1, pp. 74-85.
Williams, P., Nicholas, D. and Rowlands, I. (2010), “E-journal usage and impact in scholarly research: a review of the literature”, New Review of Academic Librarianship, Vol. 16, No. 2, pp. 192-207.