Automated data collection and management at
enhanced lagoons for wastewater treatment
Mémoire
Queralt Plana Puig
Maîtrise en génie des eaux Maître ès sciences (M.Sc.)
Québec, Canada
Automated data collection and management at
enhanced lagoons for wastewater treatment
Mémoire
Queralt Plana Puig
Sous la direction de: Peter A. Vanrolleghem
Resumé
Les stations de mesure automatiques sont utilisées pour suivre et contrôler des usines de traitement des eaux usées. Ce suivi en continu à haute fréquence est devenu indispensable afin de réduire les impacts négatifs sur l’environnement car les caractéristiques de l’eau varient rapidement dans l’espace et dans le temps.
Toutefois, même s’il y a eu des progrès considérables, ces dernières années, de la technologie de mesure, les instruments sont encore chers. Aussi des problèmes de colmatage, d’encrassement ou de mauvaise calibration sont assez fréquents à cause du contact avec les eaux usées. La fiabilité des mesures en ligne et en continu est affectée négativement. Par conséquent, un bon entretien des instruments est essentiel, ainsi que la validation des données collectées, afin de détecter d’éventuelles valeurs aberrantes.
Dans le contexte de ce mémoire, en collaboration avec Bionestr, une méthodologie est
pro-posée pour attaquer ces problèmes. Deux cas d’études en étangs aérés au Québec ont été considérés, avec l’objectif d’optimiser les activités d’entretien, de réduire les données non fi-ables et d’obtenir des grandes séries de données représentatives.
Abstract
Automated monitoring stations have been used to monitor and control wastewater treatment plants. Their capability to monitor at high frequency has become essential to reduce the negative impacts to the environment since the wastewater characteristics have an elevated spatial and time variability.
Over the last few years, the technology used to build these automatic monitoring stations, for example the sensors, has been improved. However, the instrumentation is still expensive. Also, in wastewater uses, basic problems like fouling, bad calibration or clogging are frequently affecting the reliability of the continuous on-line measurements. Thus, a good maintenance of the instruments, as well as a validation of the collected data to detect faults is required. In the context of this thesis, in collaboration with Bionestr, a methodology has been developed
to deal with these problems for two facultative/aerated lagoon case studies in Québec, with the objective of optimizing the maintenance activities, of reducing the fraction of unreliable data and of obtaining large representative data series.
Contents
Resumé iii
Abstract iv
Contents v
List of Tables vii
List of Figures viii
List of Abbreviations xi
Acknowledgments xiv
1 Introduction 1
2 Literature review 3
2.1 Need for water quality monitoring . . . 3
2.2 Water quality monitoring . . . 5
2.3 Data validation . . . 10
2.4 Water quality databases . . . 11
2.5 Facultative aerated lagoons for wastewater treatment . . . 12
2.6 Problem statement . . . 15
2.7 Objectives . . . 16
3 Materials and Methods 17 3.1 Site description . . . 17
3.2 Installation of RSM30 monitoring stations . . . 20
3.3 Data validation procedures . . . 34
3.4 Databases: data storage and management . . . 43
4 Results 46 4.1 datEAU base . . . 46
4.2 Making monitoring stations work properly . . . 59
4.3 Validation of time series . . . 67
4.4 Examples of data quality problems . . . 80
4.5 Observation and interpretation of lagoon system dynamics . . . 82
6 Recommendations 93
Bibliography 95
A datEAU base 104
A.1 Database basic concepts . . . 104
A.2 datEAU base tables . . . 105
List of Tables
2.1 Criteria supporting the choice of monitoring approach in agreement with the
needs (Thomas and Pouet,2005). . . 6
3.1 Summary table of the used sensors. . . 27
3.2 Fault detection data features (Alferes et al.,2013). . . 43
4.1 Result of the query described in the text. . . 55
4.2 Result of the query described in the text (continued).. . . 56
4.3 Result of the query described in the text. . . 57
4.4 Schedule of cleaning, validation and calibration proposed for a F/ALs inlet. . . 62
4.5 Schedule of cleaning, validation and calibration proposed for a F/ALs outlet. . 62
A.1 Explanation of different data types used in the datEAU base. . . 105
A.2 Detail of the Value table in the datEAU base. . . 106
A.3 Detail of the Metadata table in the datEAU base. . . 107
A.4 Detail of the Comments table in the datEAU base. . . 107
A.5 Detail of the Parameter table in the datEAU base. . . 108
A.6 Detail of the Unit table in the datEAU base.. . . 108
A.7 Detail of the Equipment table in the datEAU base. . . 108
A.8 Detail of the Equipment_model table in the datEAU base. . . 109
A.9 Detail of the Procedures table in the datEAU base. . . 109
A.10 Detail of the Equipment_model_has_Parameter table in the datEAU base. . . 109
A.11 Detail of the Equipment_model_has_Procedures table in the datEAU base. . . 109
A.12 Detail of the Parameter_has_Procedures table in the datEAU base.. . . 110
A.13 Detail of the Purpose table in the datEAU base. . . 110
A.14 Detail of the Weathe_condition table in the datEAU base. . . 110
A.15 Detail of the Sampling_point table in the datEAU base. . . 111
A.16 Detail of the Site table in the datEAU base. . . 112
A.17 Detail of the Watershed table in the datEAU base. . . 112
A.18 Detail of the Urban_characteristics table in the datEAU base. . . 113
A.19 Detail of the Hydrological_characteristics table in the datEAU base. . . 114
A.20 Detail of the Contact table in the datEAU base. . . 115
A.21 Detail of the Project table in the datEAU base. . . 115
A.22 Detail of the Project_has_Sampling_point table in the datEAU base. . . 116
A.23 Detail of the Project_has_Contact table in the datEAU base. . . 116
List of Figures
2.1 Schema of the different measurement types (Rieger, personal communication). . 6
2.2 Examples of the fouling environment.. . . 8
2.3 Out-of-control situations (Thomann et al.,2002) . . . 10
2.4 First datEAU base model developed by Plana (2013). . . 13
2.5 General schema of a lagoon (Grady et al.,2011). . . 14
2.6 Schemas of a facultative/aerated lagoons. . . 14
3.1 Location of the Wemotaci case study site. . . 17
3.2 Location of the RSM30 stations (red squares) in the Bionest media (blue square) enhanced lagoons of Wemotaci. . . 18
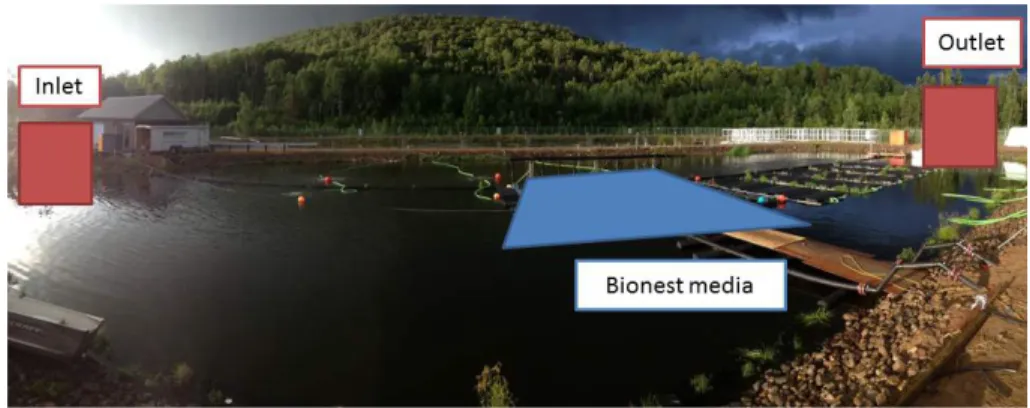
3.3 Wide angle picture of the enhanced lagoon of Wemotaci. . . 18
3.4 High and low daily air temperatures in Wemotaci during January 2014. . . 19
3.5 Location of the Grandes Piles case study site. . . 19
3.6 Location of the RSM30 stations (red squares) to study the performance of the Bionest media (blue square) in Grandes Piles. . . 20
3.7 Automated monitoring station installation. . . 21
3.8 Installed Primodal RSM30 cabin. . . 22
3.9 Equipment inside the Primodal RSM30 station. . . 22
3.10 Set-up of the monEAU water quality monitoring network (Rieger and Vanrol-leghem,2008). . . 23
3.11 BaseStation software graphical user interface (Primodal, 2015a). The small squares in green indicate the sensor is working correctly, in yellow indicate a warning problem on the sensor, and the red indicate an error on the sensor. . . 24
3.12 Influent TSS time series on a graph on BaseStation software interface (Primodal, 2015a). Data collected at Grandes-Piles. . . 24
3.13 Influent temperature and pH time series on a graph on BaseStation software interface (Primodal,2015a). Data collected at Grandes-Piles. . . 25
3.14 ana::pro software interface for two different s::can sensors (e.g. spectro::lyser and ammo::lyser) (s::can,2006).. . . 25
3.15 Hach pH sensor used in the RSM30 stations. . . 26
3.16 Hach Conductivity sensor used in the RSM30 stations. . . 28
3.17 Hach LDO sensor used in the RSM30 stations. . . 28
3.18 Hach Solitax sensor used in the RSM30 stations. . . 29
3.19 s::can spectro::lyser sensor used in the RSM30 stations. . . 30
3.20 Inserting piece to reduce the path length. . . 30
3.21 s::can ammo::lyser sensor used in the RSM30 stations. . . 31
3.23 Main menu display of the sc1000 controller (Hach,2012). . . 32
3.24 Univariate methods for water quality data assessment (Alferes et al.,2013). . . 34
3.25 Model of a typical control chart (Montgomery,2008).. . . 35
3.26 Method to detect outliers with an outlier just detected (Alferes et al.,2013).. . 40
3.27 Method to detect outliers with the detected outlier replaced (Alferes et al.,2013). 41 3.28 Method for fault detection (Alferes et al.,2013). . . 43
4.1 Modular design of the datEAU base. . . 46
4.2 datEAU base structure. . . 47
4.3 datEAU base model with the links between the tables. Details for different groups of tables are given in figures 4.4 - 4.7. . . 48
4.4 Metadata, value and comments tables of the datEAU base. . . 50
4.5 Instrumentation information tables of the datEAU base. . . 51
4.6 Sampling location information tables of the datEAU base. . . 52
4.7 Project information table and its relation with other tables of the datEAU base. 53 4.8 Superuser GUI of the datEAU base.. . . 58
4.9 Different sensor supports made for the Wemotaci F/AL. . . 59
4.10 Different sensor supports made for the Grandes-Piles F/AL. . . 60
4.11 Heater installed in the outlet container at Wemotaci. . . 60
4.12 Example of low temperature at the Wemotaci lagoon case study. . . 61
4.13 Protection for the cable connections at the Wemotaci F/AL. . . 61
4.14 Housing to work safely under severe environmental conditions. . . 62
4.15 Schema of the maintenance protocol for on site calibration and validation for the pH, conductivity, LDO, Solitax and ammo::lyser sensors. . . 63
4.16 Schema of the maintenance protocol for spectro::lyser sensor. . . 64
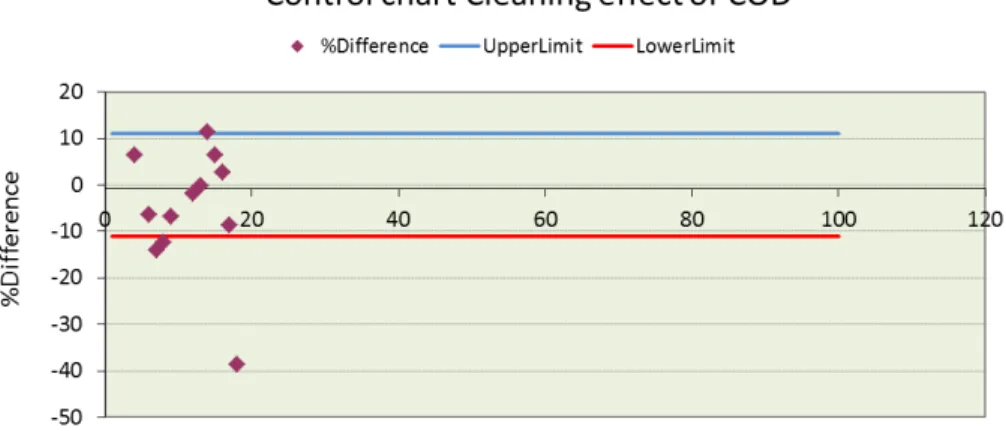
4.17 Control chart to evaluate the cleaning effect for the COD at the outlet in Grandes-Piles. . . 65
4.18 Control chart to evaluate the cleaning effect for soluble COD measured with the spetro::lyser installed at the outlet of the Grandes-Piles F/AL. . . 65
4.19 Six months of DO data from the outlet in Wemotaci indicating cleaning events with a vertical red lines. . . 66
4.20 One week of filtered ammo:lyser data from the outlet in Grandes-Piles indicating a calibration activity with a vertical red line. . . 66
4.21 Control chart based on standard solutions to determine out-of-control situations for the conducivity sensor installed at the inlet of the Grandes-Piles F/AL. . . 68
4.22 Control chart based on reference values measured with a portable sensor to determine out-of-control situations for the pH sensor installed at the inlet of the Grandes-Piles F/AL.. . . 69
4.23 A week of raw and lab data of nitrogen parameters at the inlet of the Grandes-Piles F/AL. . . 69
4.24 A week of raw and lab data of COD parameters at the inlet of the Grandes-Piles F/AL. . . 70
4.25 A week of raw data from the spectro::lyser installed at the inlet of the Grandes-Piles F/AL. . . 72
4.26 A week of filtered data from the spectro::lyser installed at the inlet of the Grandes-Piles F/AL. . . 72
4.27 Raw and filtered data with the red and blue forecast limits of CODs from
the spectro::lyser installed at the inlet of the Grandes-Piles F/AL. (x) indicate outliers; (.) are the accepted values and yellow dots indicate out-of-control
situations. . . 74
4.28 A week of fault detection data features of CODsfrom the spectro::lyser installed
at the inlet of the Grandes-Piles F/AL. (a) % of replaced data. (b) Residuals’
runs test. (c) Slope. (d) Residuals’ standard deviation. . . 75
4.29 Seven months of filtered data from the conductivity sensor installed at the inlet
of the Grandes-Piles F/AL. . . 76
4.30 A week of raw and well filtered data from the conductivity sensor installed at
the inlet of the Grandes-Piles F/AL. . . 76
4.31 A week of raw and poorly filtered data from the conductivity sensor installed
at the inlet of the Grandes-Piles F/AL. . . 77
4.32 A week of raw and filtered data from the conductivity sensor installed at the
inlet of the Grandes-Piles F/AL. . . 77
4.33 A week of feature data graphs from the conductivity sensor installed at the inlet of the Grandes-Piles F/AL. (a) % of replaced data. (b) Residuals’ runs test.
(c) Slope. (d) Residuals’ standard deviation.. . . 78
4.34 Two weeks of temperature measurements from four different sensors (pH, con-ductivity, LDO, ammo::lyser sensors) installed at the outlet of the Wemotaci
F/AL. . . 79
4.35 A week of pH measurements from the pH and ammo::lyser sensors installed at
the inlet of the Grandes-Piles F/AL. . . 79
4.36 Raw data from the spectro::lyser installed at the outlet of the Grandes-Piles
F/AL showing a data gap. . . 81
4.37 Raw data from the conductivity from the outlet of the Grandes-Piles F/AL
showing a data gap. . . 81
4.38 Raw data from the spectro::lyser installed at the inlet of the Grandes-Piles F/AL. 83
4.39 Raw data from the ammo::lyser installed at the inlet of the Grandes-Piles F/AL. 83
4.40 Two days of filtered CODs data from the inlet and the outlet of the
Grandes-Piles F/AL. . . 84
4.41 Two days of filtered ammo::lyser data at the inlet of the Grandes-Piles F/AL. . 84
4.42 Two days of filtered pH and temperature data at the inlet of the Grandes-Piles
F/AL. . . 85
4.43 Two days of filtered conductivity and temperatures data at the inlet of the
Grandes-Piles F/AL. . . 86
4.44 Two weeks of filtered COD and CODs data from the inlet of the Grandes-Piles
F/AL showing daily variations. The two red bands indicate the weekends. . . . 87
4.45 Two weeks of raw COD and CODs data from the inlet of the Wemotaci F/AL
showing daily variations. The two red bands indicate the weekends.. . . 87
4.46 Five months of temperatures raw data from the outlet of the Wemotaci F/AL. 88
4.47 Two weeks of filtered conductivity data from the inlet and the outlet of the
Grandes-Piles F/AL during the snow melting period. . . 89
4.48 Two weeks of high and low daily air temperatures of the Grandes-Piles area
during March 2015 (source Environment Canada). . . 89
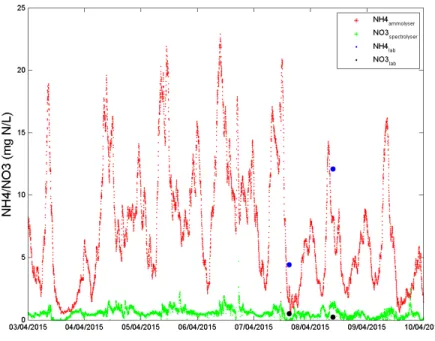
4.49 Seven months of filtered data of NH+
4 and NO3 from the outlet of the
List of Abbreviations
AC Alternating currentADQATs Automatic data quality assessment tools AMS Automated monitoring stations
APHA American Public Health Association API Application programming interface AR Autoregression
ASTM American Society of Testing and Materials
ATV-DVWK Abwassertechnischen Vereinigung - Deutscher Verband für Wasserwirtschaft und Kulturbau
BDSO Banque de données des statistiques officielles BOD Biochemical oxygen demand
COD Chemical oxygen demand
CODs Soluble chemical oxygen demand
CUAHSI Consortium of Universities for the Advancement of Hydrologic Science, Inc. CWA Clean Water Act
DO Dissolved oxygen EC Environment Canada
EPA U.S. Environmental Protection Agency
EPA STORET U.S. Environmental Protection Agency, Storage and Retrieval EU European Union
F/ALs Facultative/aerated lagoons GEKO Gerätekontrolle
GEMStat Global Environment Monitoring System water quality database GFCI Ground fault circuit interrupter
GUI Graphical user interface
IEEE Institute of Electrical and Electronics Engineers ISO International Organization of Standardization IWA International Water Association
LCL Lower control limit
LDO Luminescent dissolved oxygen LED Light-emitting diode
LIMS Laboratory Information Management System LWL Lower warning limit
MDDELCC Ministère du Développement durable, de l’Environnement et de la Lutte contre les changements climatiques
modelEAU Canada Research Chair on Water Quality Modeling monEAU Automated Monitoring Station
N Nitrogen
NMKL Nordisk Metodikkomité for Næringsmidle NTC Negative Temperature Coefficient
NTU Nephelometric turbidity unit ODM Observations Data Model R R programming language RMSE Root-mean-square error
RSM30 River Side Monitoring System SQL Structured Query Language
STORET Storage and Retrieval TSS Total suspended solids UCL Upper control limit
UPS Uninterruptible power supply USGS U.S. Geological Survey
USGS NWIS U.S. Geological Survey, National Water Information System UWL Upper warning limit
UV-VIS Ultraviolet-visible spectroscopy WHO World Health Organization
WSDOT Washington State Department of Transportation WWTP Wastewater treatment plant
Acknowledgments
During my studies in Québec City, I had the opportunity of meeting great people who have helped me in the past two years.
First of all, I wish to express my appreciation to my supervisor, Prof. Peter A. Vanrolleghem. Thank you to give me the opportunity to come back to Québec City. Your vast knowledge and experience helped me to get through my project.
I cannot forget Janelcy, a former postdoc, whom I have been working with. My sincere gratitude for your patience and help.
Also, I have to thank the Bionest company and its employees, especially Étienne and Coralie, to be supportive during my project.
And obviously, I have to mention the modelEAU team (both current and former members), it is always a pleasure to work with a hard-working team. It hasn’t just been work, it has been a life experience... So, special thanks to all of you for everything.
In addition, I acknowledge the financial support of MITACS, to fund the project and my scholarship.
Finally, I want to thank my family, my parents and my brother. Even if you are far, you are close. Thank you for your support and encouragements.
Chapter 1
Introduction
Monitoring and control of wastewater treatment plants (WWTP) have become more impor-tant in the last few years to reduce the negative impacts and contamination of freshwater bodies, i.e. the control of the water quality of the effluent has received increased attention (Vanrolleghem and Lee,2003). This special interest has been translated in regulations, such as the 91/271/EEC Directive in the EU, the CWA in the USA, and more recently in Canada, the SOR/2012-139.
In view of complying with these regulations, and considering that wastewater characteristics have an important spatial and time variability, automatic on-line monitoring of several param-eters to determine the quality of the wastewater is evidently required (Bourgeois et al.,2001). Besides, the technology to satisfy these needs, like the use of sensors, has been improved with the target to obtain reliable continuous measurements, optimizing maintenance and costs of operation (Lynggaard-Jensen,1999).
Sensors are essential to monitor and control WWTPs, providing on-line data (Jeppsson et al., 2002). For this, automated monitoring stations have been presented as the next generation of water quality monitoring systems. Rieger and Vanrolleghem(2008) proposed the monEAU concept (monitoring of water, "eau" in French) as one of these new monitoring systems, combining state-of-the-art technology and with the visions to provide flexibility to connect any sensor, to be installed anywhere and to be used for different monitoring purposes. However, the new sensors are still quite expensive and they also still cause problems. Har-remoës et al. (1993) identified these basic problems as fouling, bad calibration and reliability of the sensors. Over the last few years, the performance and the reliability of the sensors has improved, but there are still not a lot of water professionals that feel sufficiently confident to fully rely on them. Moreover, the current WWTPs are often not prepared for automated con-trol systems or to take advantage of the on-line information (Campisano et al.,2013;Jeppsson et al.,2002).
These problems are present and common for any type of on-line sensor used in the WWTP chain due to anomalies in sensors, insufficient maintenance, severe environmental conditions or other external factors. Therefore, good maintenance to minimize these unreliable data remains a challenge, and so does the management of the high quantity of data without loosing their quality.
In Canada, 67 % of the WWTPs are aerated lagoon systems (Lafond,2009). These aerated lagoons operate at a high hydraulic retention time (around 5 days) compared to conventional WWTP and they are designed to remove total suspended solids (TSS) and reduce the bio-chemical oxygen demand (BOD) (Metcalf and Eddy, 2003). However, in July 2012, a new regulation, named SOR/2012-139, was launched that is more restrictive for TSS and BOD removal and also imposes nitrogen removal when unionized ammonia exceeds 1.25 mg N/l (Government of Canada,2012). Thus, there is a need to upgrade the current lagoons.
Bionest Technologies has developed a new technology, KAMAKT M (meaning "living lake"
in Atikamekw), to tackle this necessity. With the objective to allow for lagoons with reduced hydraulic retention time, promote nitrogen removal and prevent the wash-out of nitrifiers, this technology consists of the integration of fixed-media in a lagoon subdivided in baffled reactors and clarification zones.
With the installation of the KAMAKT M media in aerated lagoons, the process becomes
more intense, the reactions and the dynamics are faster, and the installation can suffer biofilm sloughing. To determine these variations, grab samples are not enough to reach a detailed understanding of the system. Thus, monitoring stations were installed to continuously collect data allowing the study of the system dynamics.
According to the monEAU vision given above, this thesis presents a methodology to deal with basic problems in getting reliable and useful data for aerated lagoon WWTP, including:
• How to maintain and keep the monitoring stations working properly
• How to handle data quality problems to provide the required or useful information • How to manage the huge amount of data collected
Chapter 2
Literature review
Anthropogenic activities have a big influence on the environment, and during the past few decades, it has been increased due to the development of large urbanized areas and the in-dustrial revolution and technological progress (Harremoës et al.,1993;Chapman,1996). This effect can be translated as pollution to terrestrial ecosystems, freshwater and marine environ-ments and the atmosphere.
Environmental monitoring concerns collecting and analyzing information on the state of the environment to identify any variation or trends over time (EC, 2012; Corbitt,1990). Moni-toring also comprises verifying whether policies and programs are having the desired results and activities are according to legislation.
Within the field of water, water quality deterioration has become a problem since it is a finite resource and fundamental to life. Besides, water pollution threatens development projects and makes wastewater treatment essential (Bartram and Ballance, 1996; Chapman, 1996). Therefore, there is a need to comprehend and assess water quality (Quevauviller et al.,2007). For that, reliable monitoring data is fundamental.
In this chapter, a water quality monitoring literature overview is presented and in particular its issues and challenges specially in case of wastewater treatment.
2.1
Need for water quality monitoring
Some WWTPs experience process disturbances, faulty design, overloading and inadequately trained operators (Vanrolleghem,1994;Metcalf and Eddy,2003). These facts affect the effluent quality and may lead to violate discharge limitations. However, the negative impacts to the environment can be reduced by incorporating monitoring and control strategies into the wastewater treatment operation. These monitoring activities can be conducted for many purposes. In case of a WWTP, EPA (2012a) and (Bartram and Ballance, 1996) propose the main purposes as follows:
• determine whether the WWTP is working in compliance with pollution regulations • characterize waters along the WWTP and identify changes or trends in water quality
over time
• identify current and forthcoming contamination problems in views of hazards prevention • gather information to design a specific treatment program or to optimize WWTP
oper-ation
• respond to emergencies, such as floods or spills
Basically, proper control may allow achieving an optimum performance and avoiding opera-tional problems (EPA,1977;Olsson et al.,1998). Furthermore, it is known that wastewater is a huge problem for the environment thus, regulations have been launched to reduce its negative impacts and deterioration by the deleterious substances discharged by the WWTP effluents in freshwaters (Lovett et al.,2007;Government of Canada,2012).
Existent regulations, like the 91/271/EEC Directive in the EU, the CWA in the USA, and the SOR/2012-139 in Canada, indicate the basic monitoring requirements of the WWTP depending on treatment capacity. TheCouncil of the European Union(1991), theGovernment of Canada (2012) and the EPA(2015) mentioned that a monitoring plan has to ensure:
• an appropriate monitoring program to control some parameters (physical, chemical or biological)
• a proper analysis of samples by using standard methods • an adequate frequency of monitoring to:
– monitor discharges from wastewater treatment plants – assess the amounts and compositions of the wasted sludge
Summing up, monitoring and control of WWTPs have become essential to track and improve the performance of the system and to ensure that the water quality of the effluent agrees with the policies and regulations. Moreover, quality measurements are essential to make the correct decisions related to management of water resources, monitoring issues, biological quality, etc. (Quevauviller et al.,2007).
2.2
Water quality monitoring
Water quality monitoring is the activity to collect information about various water character-istics at determined points with a certain frequency (Bartram and Ballance,1996;Chapman, 1996). Subsequently, the obtained information can be used to evaluate the physical, chem-ical and biologchem-ical status of the water body as well as to understand its dynamics, identify pollution problems, establish trends and make necessary decisions (WHO,1963). This global procedure is known as water quality assessment.
Generally, two different basic functions are established for water quality monitoring according toDandy and Moore(1979);Karpuzcu et al.(1987): prevention and abatement. The objective of the prevention is to maintain the existing unpolluted or acceptable status of water quality, while, the goal of abatement is to control the system and reduce its pollution conditions (Harmancioglu et al.,1999).
Besides, behind the monitoring concept, it is possible to distinguish three different types of monitoring activities. Depending on long-term, short-term and continuous programs,Bartram and Ballance (1996);Chapman(1996) define these procedures as follows:
• Monitoring is a long-term activity, measurement and observation of the water quality for a specific purpose.
• Surveys are finite duration activities, intensive programs to measure and observe the quality of the water body for a specific purpose.
• Surveillance is a continuous activity with specific measurement and observation for the purpose of water quality management and operational activities.
In the specific case of WWTP, surveillance is the best practice to estimate the quality of the wastewater (Vanrolleghem,2010). In particular, this type of monitoring permits to determine the status of the water quality, to assess the impact of long time changes, and to evaluate whether the WWPT operates according to the regulation’s objectives (EC,2003).
Furthermore, depending on the objectives of the measurements, two different approaches of water quality monitoring can be carried out in a WWTP (Thomas and Pouet,2005):
• off-site measurements based on sampling and laboratory analysis
• on-site measurements with on-line measurement systems or field portable devices According to the main needs for monitoring presented in section2.1,Thomas and Pouet(2005) propose that the choice of appropriate measurement approach should be made following table
Table 2.1: Criteria supporting the choice of monitoring approach in agreement with the needs (Thomas and Pouet,2005).
Off-site On-site
Regulation compliance X
Process control X
Hazards prevention X
Scientific knowledge X X
Normally, both monitoring approaches are combined to accomplish all needs presented. How-ever, it seems that in case of wastewater quality monitoring, on-site measurements are prefer-able to better estimate the wastewater quality throughout time and space.
On-site and off-site measurements can be classified in three different types (Figure 2.1). For the in situ type, sensors are placed inside the water to be monitored (e.g. Beaupré (2010) and Kaelin et al. (2008)). The second type, the on-line configuration, the wastewater is pumped through a hydraulic loop in which the sensors are installed (e.g. van Griensven et al. (2000)).The third type is the simple measurement from a sample analyzed with portable sensors or standard methods in a lab (e.g. Berthouex and Hunter (1975)).
Figure 2.1: Schema of the different measurement types (Rieger, personal communication).
2.2.1 Monitoring program
As several regulations demand, a monitoring program has to be conducted to assess the dis-charges from WWTP, including such information as their flow and composition (Vanrolleghem and Lee,2003;Jeppsson et al.,2002).
One of the main purposes of a monitoring program is to collect sufficient good quality data to evaluate spatial and/or temporal variations in water quality. Along with achieving a successful program to produce the expected information, Harmancioglu et al. (1998); Chapman(1996) propose some basic stages to be followed:
• Definition of the objectives of the monitoring • Preliminary surveys and background information
• Monitoring design: location, parameters to measure, timing and frequency of monitoring, etc.
• Monitoring including field monitoring, hydrological monitoring and laboratory activities • Data quality control
• Data storage, treatment and reporting • Data interpretation
• Water management recommendations and decision making
Even if there is not a simple specific model for the structure of a monitoring program, it has to be consistent. Also, Chapman (1996) suggests that a program should be flexible to meet short-term objectives with the possibility of the program to be modified over longer periods to accommodate for new interests and priorities. It is recommended to review and update the program regularly according to the current needs. Moreover, once the program is prepared, it should be communicated to all participants (Bartram and Ballance,1996). If the participants are not completely informed about the updates, the quality of the program will suffer.
2.2.2 On-line water quality monitoring
Water quality can change regularly over time and space, and to accurately characterize these variations of the water conditions, frequent and repeated measurements on-site are needed. According to Wagner et al. (2000), when the time between repeated measurements is suffi-ciently small1, the resulting water quality record can be considered continuous.
In the context of continuous monitoring, when data collection is happening in real-time, this type of monitoring is also called on-line monitoring.
In this case of on-line water quality monitoring, multiple water quality probes and sensors con-figured into monitoring stations are used. They are placed throughout the wastewater treat-ment system and transmit usable information automatically and continuously in real-time. These stations are known as automated monitoring stations (AMS) and they are described in more detail in section 3.2.1.
1
The sampling frequency is considered sufficiently small when this sampling rate is at least twice of the frequency (Nyquist sampling theorem) which can be able to full reconstruct water quality changes (Olshausen,
2.2.3 Issues of on-line water quality monitoring
On-line monitoring programs have some challenges and associated limitations. A good moni-toring program is not enough to obtain the desired and useful information about the wastew-ater conditions. It is also necessary to choose carefully among the available technologies and select the location with care (Dippenaar et al.,2000).
Due to the adverse environment in which they are installed, automated monitoring in wastewa-ter systems is not used as much as in other processes. Rieger and Vanrolleghem(2008) present the basic limitations of the use of AMS: the lack of standardization, data quality problems, and insufficient flexibility of the stations.
Bourgeois et al. (2001) and Campisano et al.(2013) agree that the existing equipment is not well prepared for long-term on-line monitoring in a fouling environment (e.g. figures 2.2a
and 2.2b). Thus, the instrumentation requires additional equipment for cleaning, regularly maintenance and the implementation of data fault detection methods. All this adds to the cost and leads to extra work.
(a) Matter accumulation attached on a sensor’s cable.
(b) Matter accumulation on a sensor.
Figure 2.2: Examples of the fouling environment.
In contrast to grab or composite samples, automatic data acquisition systems are producing a huge amount of data with uncertain quality. Since manual data validation requires time and is very tedious, automatic data quality assessment tools (ADQATs) are necessary to validate the time series to be useful (Alferes et al.,2012). In that sense, poor quality data could drastically affect the results of their application, namely water quality models, WWTP control actions, decisions regarding design and operation, etc.
Summing up, the challenge associated with automated monitoring programs is to collect data that consistently represent water quality. This requires clear planning and protocols for data collection, and quality assurance and quality control. The quality of data collected by
auto-mated monitoring equipment is dependent on the methods used to handle, configure, operate, and maintain the equipment. For each station field procedures must be standardized and documented.
2.2.4 monEAU project
monEAU (monitoring of water, "eau" in French) is presented as the next generation of water quality monitoring networks. According to the limitations presented in section 2.2.3, Rieger and Vanrolleghem (2008) present the new vision of AMS with the following characteristics to be considered for its design:
• A Flexible System. A multi-objective monitoring network to be used for different pur-poses, wherever it is desired, with any type of sensor.
• An Open and Modular System. A system that can be adapted to the current needs, keeping the integrity of the robust framework.
• A High Quality/Performance Database. A platform to store the large data series is needed. Like the monitoring system, the database has to be robust and flexible enough to be adapted to any station application.
• Remote Use. Sometimes the access to the stations is not easy. The design of the system has to consider the minimization of maintenance requirements and energy demand, and remote access to the entire monitoring station including the sensors.
• Automatic Data Quality Assessment. Data evaluation is to be done with reference sam-ples, sensor status/diagnosis data and time series information.
• User-Friendly and User-Oriented Software Concept. The required information is pro-vided and visualized depending on the user level and the location.
• Proactive and Flexible Maintenance Concept. A protocol on maintenance and a schedule for the operators has to be provided. This furnished information is based on sensor self-diagnosis, the company or user experience and a proactive set of station-triggered experiments.
In this context, previous studies have been been conducted by the modelEAU research group dealing with some of these characteristics. These works focused on sensor characterization and validation (Beaupré, 2010), data collection and management (Plana, 2013), and automatic data quality evaluation (Poirier,2015;Saberi,2015).
2.3
Data validation
On-line continuous monitoring is used to collect data at high frequency. However, the collected data can be beneficial only if it is accessible, accurate and reliable (Copp et al.,2010). This is the reason why an efficient monitoring system has to assure a good quality control and quality assessment (Alferes et al.,2013).
In case of a WWTP, due to the extreme environment where the sensors are put in, the raw data present some problems such as noise, missing values or systematic errors (Mourad and Bertrand-Krajewski, 2002). Detecting and replacing doubtful or wrong data is essential to avoid wrong decisions at the level of control, process modeling or planning of new treatment infrastructure (Thomann,2008;Branisavljevic et al.,2010). Some data validation procedures have to be implemented before further use of the data.
Generally, the control of on-line sensors is done by comparing the on-line measurement data and and the values obtained from grab samples analyzed by reference methods (ATV-DVWK, 2000; Häck et al., 1999). This allows detecting out-of-control situations like drift, shift or outlier situations (See figure 2.3) (Thomann et al.,2002).
Figure 2.3: Out-of-control situations (Thomann et al.,2002)
Despite the fact that this methodology is often used and allows to verify the reliability of the data, it just permits to compare one single value of the situation at a determined moment. Thus, ADQATs for continuous validation will be more efficient and reliable to detect any bias (Rieger et al.,2004).
An example of a dynamic validation is the GEKO (GEraeteKOntrolle) monitoring software presented by Rieger et al.(2004). This software has been designed to meet an efficient moni-toring by minimizing laboratory analysis and operator efforts, and detecting systematic errors as fast as possible.
Following the same idea, Alferes et al. (2013) proposed a combination of univariate methods as a dynamic validation to detect faults and outliers in the context of the monEAU project. This methodology has been used in this thesis and is presented in more detail in section 3.3.
2.4
Water quality databases
On-line water quality monitoring generates large data sets. Thus, the tasks of storage, analysis and the interpretation of the collected data are crucial. Washington State Department of Transportation assure that the interpretation and evaluation of the data cannot be performed without good data storage and analysis (WSDOT,2008).
To carry out these activities successfully, a water quality database has to be built (Peng et al., 2011). Such database should provide the simplicity to store and document all relevant data, and should be easy to use for further data evaluation (Rieger et al.,2004). However, to obtain a long-term database, there are some data management challenges. Camhy et al.(2012) and Holmes and Poole (1998) identify the following challenges:
• The variability of the collected raw data formats
• The database is continually growing and must be adaptable according the modifications of the monitoring program
• Data store and collection have to be adapted over time corresponding to the needs of high-performance storage and data access
• Personnel who is collecting and managing data is changing over time which can lead to some inconsistencies
• Archiving and documenting data sets like raw or validated data, as well as their meta-information (data about data)
Especially, the latter challenge is critical because without the storage of these metadata, the database has no meaning. Ideally, a database should answer at least the following questions:
• What has been measured?
• When has the value been measured? • Where has the value been measured? • How has the value been measured? • Who has collected the value? • Why has the value been measured?
Over the last few years, some water quality databases have been developed trying to tackle these challenges, e.g. the STORET database from EPA (2012b), the NWIS database from
USGS (2012), the GEMStat database from UNEP (2015) and the ODM database from CUAHSI (2015).
However, the storage and access to the metadata is still missing (Copp et al., 2010). Some authors, Camhy et al.(2012),Copp et al.(2010) andRieger and Vanrolleghem(2008), affirm that metadata is a basic need for data evaluation and understanding, as well as for further studies and data exchange.
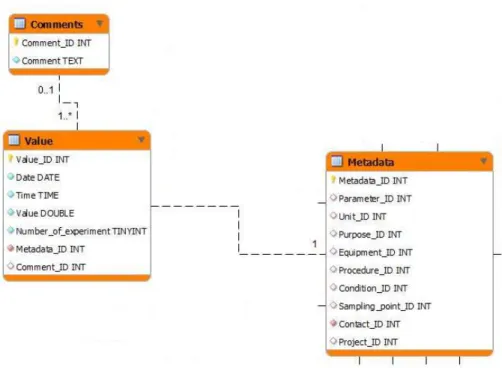
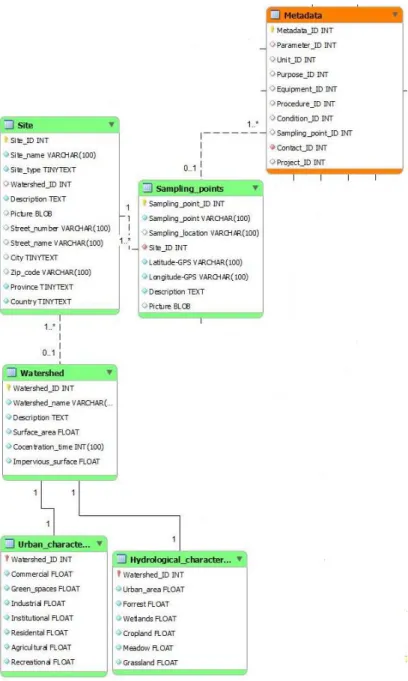
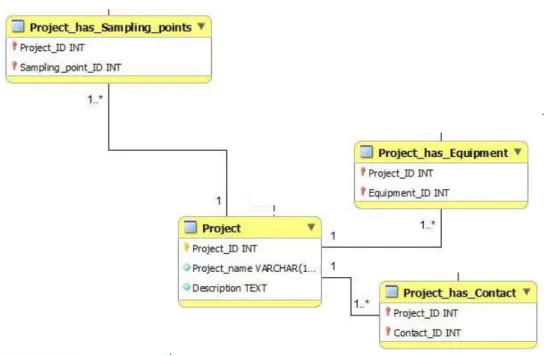
Furthermore, most of the published databases, in their design and in the way the metadata are stored, focus on measurement details, giving priority to data collection activities and data set characteristics rather than monitoring programs and locations (Sheldon et al.,2011). Within the monEAU concept, a robust, fast and flexible database is needed. Previously, Plana (2013) developed a first database to manage and store the data. Named datEAU base, it consists in two different parts:
• A relational database built with MS Access.
• A user interface and tools to facilitate data entry, exporting and viewing data from the database, built with MS Excel and the R programming language.
The design of the datEAU base deals with the different challenges presented above (See figure
2.4). It provides uniformity of the data format, sufficient flexibility for further modifications, relevant metadata storage, and documentation according to the monitoring program. However, the used softwares had several limitations with reference to their capacity.
2.5
Facultative aerated lagoons for wastewater treatment
After activated sludge, lagoon WWTPs are the second most popular natural system. For instance, in Canada, it represents 67 % of the number of WWTPs (Lafond,2009). Generally, they are used to stabilize biodegradable organic matter (Grady et al.,2011). In some occa-sions, nitrogen and phosphorous removal can be observed but it occurs only in warm climates (Metcalf and Eddy,2003).
The design of lagoons is simple, so low investment and operating costs are required. However, the understanding of the chemical and biochemical reactions is limited due to their complexity (Grady et al.,2011). Due to this complexity, lagoons sometimes present several issues such as a poor quality effluent and excess algae growth.
Typically, the lagoon is a basin excavated in the soil with sloped sidewalls (See figure 2.5). Depending on the lagoon characteristics, such as depth and biological reactions, the system can be classified in three different types: aerobic, facultative/aerated and anaerobic (Grady
Figure 2.5: General schema of a lagoon (Grady et al.,2011).
et al., 2011; Vesilind, 2003). In the context of this thesis, partially mixed aerated lagoons, named facultative aerated lagoons (F/ALs), are studied.
In this system, aerators are installed at the bottom or on the surface to oxygenate the lagoon. However, in F/ALs, the provided air is insufficient to keep the lagoon completely mixed (Grady et al.,2011;MDDELCC,2001). Thus, the biodegradable organic matter is stabilized by both aerobic and anaerobic processes (See figure 2.6a). Part of the suspended solids settle to the bottom of the basin where anaerobic digestion is occurring. The other part of the suspended solids and the soluble organic matter are oxidized in the aerobic zones (MDDELCC,2001).
Inlet Outlet
Aerator
Aerobic zone
(a) Schema of a F/ALs with floating surface aerators.
Inlet Outlet
Aerobic zone
(b) Schema of a F/ALs with submerged diffused aeration. Figure 2.6: Schemas of a facultative/aerated lagoons.
F/ALs systems are able to remove from 50 to 200 mg/L of TSS and the overall BOD removal rate is from 0.5 to 0.8 d−1(Metcalf and Eddy,2003). The hydraulic retention time is typically
In the province of Québec, 37 % of the 540 F/ALs are overloaded (BDSO,2014). Moreover, since these systems are installed outside and the retention time is long (around 20 days in Québec, (MDDELCC, 2001)), under winter conditions, the organic matter degradation be-comes slower and the effluent load is higher. Thus, overloaded lagoons have to be upgraded, e.g. their treatment capacity needs to be increased.
To increase the treatment capacity of a F/ALs system, different possibilities exist (Gerardi and Lytle,2015;Metcalf and Eddy,2003):
• Change the lagoon’s hydraulics. A completely mixed system or the addition of baffles are the most common processes to reduce dead zones and decrease hydraulic retention time. However, wash-out of the biomass can occur as a result and more energy is needed. • Integration of fixed-film. Adding inert media, on which biofilm develops, prevents the wash-out of the nitrifiers and a complete nitrification and CBOD removal can be achieved. And as a result more energy is needed.
Bionest Technologies has developed a fixed-film media, KAMAKT M, to augment the
treat-ment capacity of F/ALs reducing the hydraulic retention time, promoting nitrogen removal and avoiding biofilm sloughing even under the winter conditions occurring in Québec.
2.6
Problem statement
In the context of this thesis, the following research challenges have been identified:
• Measurement in raw wastewater: at the inlet of the wastewater system, clogging and fouling is typical due to the high pollution load of the water. It produces the hardest measurement conditions and it affects the reliability of the measurements.
• Environmental conditions: since the study concerns continuous monitoring, the installa-tion has to be prepared for dry and wet weather condiinstalla-tions, large temperature changes and seasonal loads. In particular, for the use of sensors under winter conditions and considering that the lagoon system is outside with long retention times, proper instal-lation will be critical to keep the sensors ice-free and to ensure a suitable temperature in the whole monitoring system. Also, it is important to guarantee safe access to the technicians and researchers for maintenance.
• Optimize the laboratory analyses to make it cost-time effective: Reduce the number of analyses without jeopardizing validation of the sensors
• Data management and storage: Due to the huge amount of collected data, there is a lack of tools to manage and store the data adequately. The existing databases do
not have enough capacity and their design do not allow complete, organized storage of the metadata. Furthermore, this lack of useful tools affects the accessibility to the information and reduces the use of the data for further studies.
2.7
Objectives
According to the monEAU research line and the issues of water quality monitoring, the main objective of this thesis is to combine and improve upon the previous studies performed by the modelEAU research group by Beaupré (2010), Plana (2013), Poirier (2015) and Saberi (2015) to assure a good operation of the monitoring stations in WWTP followed by robust procedures of data validation.
Furthermore, in the context of this thesis, a new application scenario has been studied: F/ALs under really cold conditions where two monitoring stations are installed to evaluate the system performance, one at the inlet and another one at the outlet of the F/ALs. Thus, the approaches developed so far had to be adapted.
To minimize unreliable data due to sensor failure, lack of maintenance, environmental condi-tions or any other factor, the specific objectives are translated into:
• Collect and interpret daily, weekly and yearly good water quality time series, which entails:
– Designing and testing monitoring stations working on the new F/ALs scenario under really cold conditions
– Establishing a maintenance procedure of the monitoring stations
– Establishing on-line data validation procedures (on the new F/ALs scenario)
Moreover, to sustain easy management and use of the large amounts of collected data and metadata and to achieve the goals presented above, the design and the further development of the datEAU base developed by Plana(2013) has been included as another objective.
Chapter 3
Materials and Methods
This section will describe the case study site, the materials that make up the stations to collect the water quality data, as well as all methods used to obtain and store quality data.
3.1
Site description
As mentioned in section2.3, this thesis has focused on an enhanced lagoon wastewater treat-ment scenario. Below, the two case studies are presented.
3.1.1 Wemotaci
The first implementation was located in a reserve called Wemotaci on the north shore of the Saint-Maurice river in the Mauricie region of Québec, Canada (Coordinates: 47°54’25”N 73°47’00”W) (Figure 3.1).
Figure 3.1: Location of the Wemotaci case study site.
The sewer system in Wemotaci is combined. All wastewater going to the WWTP is residential. And its characteristics agrees with the typical untreated domestic wastewater composition
proposed by Metcalf and Eddy (2003): 120 - 400 mg/l of TSS and 110 - 350 mg/l of DBO5.
The WWTP consists in two aerated lagoons in series treating a maximum daily flow of 866 m3/d (Figure 3.2). The corresponding volumes of each lagoon are 6525 m3 for the biggest
one, and 4352 m3 for the smallest one. Thus, the retention time of these lagoons is 12.5 days.
On both lagoons, aerators are installed at the bottom.
Specifically, the study was located at the smallest one (see figure3.2). This lagoon was divided in two halves by a watertight membrane to compare a standard lagoon and a lagoon enhanced with BIONEST media (see section 2.5). To evaluate the performance of the system, two monitoring stations were installed, one on the inlet and the other on the outlet (see figures
3.2 and3.3).
Figure 3.2: Location of the RSM30 stations (red squares) in the Bionest media (blue square) enhanced lagoons of Wemotaci.
Figure 3.3: Wide angle picture of the enhanced lagoon of Wemotaci.
The experienced period of this installation was between September 2013 and April 2014, so it allowed studying the operation of the monitoring stations under cold climate conditions (e.g.
figure 3.4).
Figure 3.4: High and low daily air temperatures in Wemotaci during January 2014.
3.1.2 Grandes-Piles
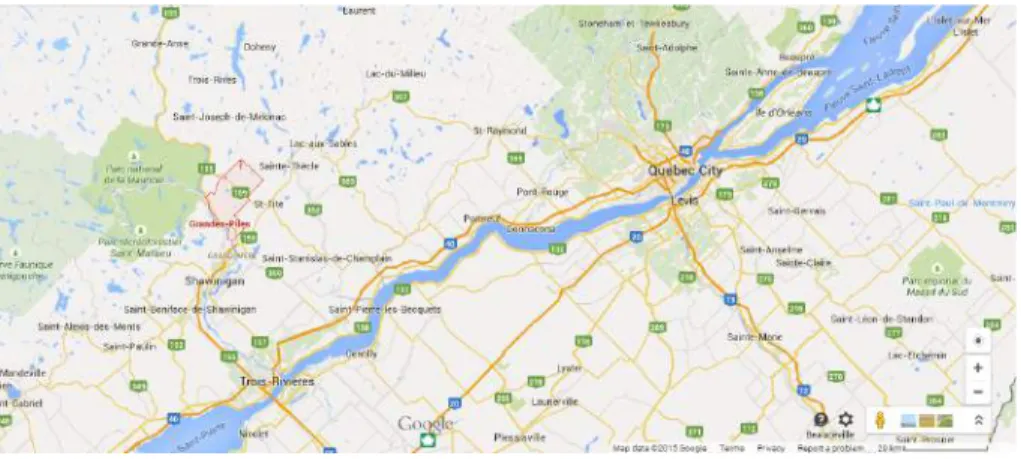
The second case study was also located in the Mauricie region, more specifically in the regional county municipallity of Mékinac, called Grandes-Piles (Coordinates: 46°41’12”N 72°44’33”W) (Figure 3.5).
Figure 3.5: Location of the Grandes Piles case study site.
As in Wemotaci, the sewer system in Grandes-Piles is combined. And the wastewater origin is basically residential. Also its composition agrees with the standard municipal characteristics
proposed by Metcalf and Eddy (2003).
The WWTP consists in one circular concrete aerated lagoon separated by a baffle in two different cells with aerators installed at the bottom of the lagoon (see figure 3.6). Its total volume is 1564 m3 and it treats 129 m3/d. Thus, the retention time is about 12 days.
The Bionest media is installed in the middle of the first cell. The RSM30 stations were installed at the inlet and at the end of the media permitting to study its performance (see figure3.6).
Figure 3.6: Location of the RSM30 stations (red squares) to study the performance of the Bionest media (blue square) in Grandes Piles.
This second installation was set up at the end of November 2014. It is still working to obtain a yearly series of data for further studies.
3.2
Installation of RSM30 monitoring stations
In this section, the equipment used for on-line monitoring is presented, as well as the mainte-nance required to keep the equipment working properly.
3.2.1 Automated monitoring stations
The applied RSM30 (Primodal) monitoring stations are a versatile design of water side moni-toring equipment according to the monEAU vision (Rieger and Vanrolleghem,2008): pursuing flexibility to be deployed wherever it is wanted, to connect different sensors from several man-ufacturers and to obtain the desired output.
The used monitoring stations are built as in figure 3.7. The main part of the installation includes sensors placed into the water (in situ measurements), and the station in which the sensors control and data storage are housed. The station is installed inside a cabin to protect it from extreme environmental conditions and vandalism.
Figure 3.7: Automated monitoring station installation.
3.2.2 RSM30 station description
An example of a monitoring station is the equipment developed by Primodal Systems, named RSM30. The RSM30 is a water quality monitoring station that registers, transmits real-time data and analyses the data in real-real-time using its custom-designed PrecisionNow software (Primodal,2015c).
The RSM30 is encased in a secure NEMA 4X rated fiberglass enclosure designed for a range of diverse environmental conditions and ease-of-deployment (Figure 3.8). The stations are equipped with a computer where the software to store the data runs, a controller, a router to provide remote access to the stations and a climate controller to mitigate extreme temperature fluctuations (Figure4.5). Also, an uninterruptible power supply (UPS) is installed to provide emergency power when there is a short power failure. Moreover, equipment safety is assured through surge and GFCI (Ground Fault Circuit Interrupter) protection inside the unit. Additionally, next to the temperature controller incorporated inside the RSM30, another tem-perature controller has been installed into the cabin, given the extreme cold climate conditions that the stations were exposed to during the winter.
3.2.3 Softwares
The RSM30 system includes a robust software framework serving as the mainstay of the stations and server network permitting the simple connection of various modules through a specified API (Application Programming Interface) (Copp et al.,2010).
Some modules provide basic functionality like data input or output but the main purpose for this framework structure is the capability to incorporate new developments or to implement data evaluation modules (Rieger and Vanrolleghem, 2008; Copp et al., 2010). Thus, robust
Figure 3.8: Installed Primodal RSM30 cabin.
(a) Installed equipment inside the Pri-modal RSM30.
(b) Schema of the equipment inside the Primodal RSM30.
Figure 3.9: Equipment inside the Primodal RSM30 station.
operation is combined with the required flexibility. Figure 3.10represents the monEAU con-cept.
In these stations, measurement, meta, LIMS (Laboratory Information Management System) and log data from sensors are controlled by Primodal’s own PrecisionNow BaseStation software (Primodal,2015c) and ana::pro software (Advanced Process Software) provided by the sensor manufacturer s::can (s::can,2012).
PrecisionNow software
The PrecisionNow software is provided by Primodal (Hamilton, Canada) and is used to con-figure sensor inputs and data evaluation modules, to establish the communication with the
Figure 3.10: Set-up of the monEAU water quality monitoring network (Rieger and Vanrol-leghem,2008).
central server and the data visualization system (Figure 3.11). Current and historical time series data can also be visualized inside the software as single or as multiple time series on one graph (see figures3.12and3.13). Also, the collected data can be exported in different file formats such as text, xml, csv or Excel files (Primodal,2015c).
This software provides flexibility to add, remove or change sensors rapidly and easily. Fur-thermore, sensors from different manufacturers can be configured on it (Primodal,2015b). Each Base Station can operate alone or as part of a monitoring network, as presented on figure
3.10. Every unit is fully equipped to operate in isolation, store and visualize measurements and meta- data, as well as it has the communication tools to transmit the data to a central storage location (Central Server) (Primodal,2015b). Moreover, the RSM30 has sufficient capacity to store years of data.
The Central Server is programmed to retrieve data from any Base Stations within the network. This functionality permits an automated comparison of the data from multiple locations in real-time minimizing the effort needed for post-processing and the manual comparison of data.
Figure 3.11: BaseStation software graphical user interface (Primodal, 2015a). The small squares in green indicate the sensor is working correctly, in yellow indicate a warning problem on the sensor, and the red indicate an error on the sensor.
Figure 3.12: Influent TSS time series on a graph on BaseStation software interface (Primodal, 2015a). Data collected at Grandes-Piles.
ana::pro software
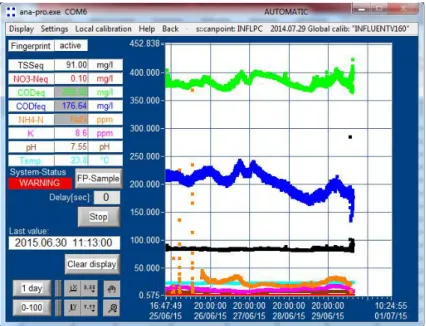
The ana::pro software was created by s::can (Wien, Austria) to offer numerical and graphical data and advanced multiparameter process visualization of s::can sensors (Figure 3.14). It offers advanced spectral analysis, derivative and delta spectra access, an autocalibration mod-ule, data-logger access, automatic or manual transfer of data, interpretation of measurements, off-line data analysis, interfaces for data transfer and automatic verification (s::can, 2006).
Figure 3.13: Influent temperature and pH time series on a graph on BaseStation software interface (Primodal,2015a). Data collected at Grandes-Piles
In contrast to the PrecisionNow software, the ana::pro software is specially developed for the operation of all s::can probes, in particular spectrometer probes that require more complex applications. Additionally, it allows the use of the s::can dissolved oxygen probes, the s::can ammonium probe and other sensors distributed by s::can.
Figure 3.14: ana::pro software interface for two different s::can sensors (e.g. spectro::lyser and ammo::lyser) (s::can,2006).
3.2.4 Installed sensors
A short overview of the sensors used in this implementation is presented below. Only two different brands of sensors have been used, even if the RSM30 system is flexible for all types of sensors.
Each station includes six sensors to measure the water quality parameters pH, conductiv-ity, turbidconductiv-ity, ammonia, TSS, DO, temperature, nitrates and COD. These sensors and some characteristics are presented briefly in table 3.1.
pH sensor
The pH digital differential sensor is manufactured by Hach (Figure 3.15). The principle of operation of this pH sensor is to measure the concentration of protons as -log[H+] by evaluating
an electrical potential in mV between the glass electrode and the reference electrode, similar to the potential between the two plates of a capacitor (Hach,2006b). Also, the glass electrode acts as a transducer that coverts chemical energy into electrical energy producing a potential proportional to the pH value. Moreover, to automatically compensate pH measurements for temperature variations, an integral NTC (Negative Temperature Coefficient) 300 ohm thermistor is installed.
Figure 3.15: Hach pH sensor used in the RSM30 stations.
The manufacturers do not provide a self-cleaning for the pH sensors. However, compressed air has been installed to prevent sensor’s fouling due to the sever environment. In this application, the air is activated every 5 minutes.
Conductivity sensor
The conductivity sensor used is manufactured by Hach (Figure 3.16). The principle of the measurement of the inductive conductivity probe is made by passing an AC current through a toroidal drive coil which induces a current in the electrolyte solution. This induced solution current produces a current in a second toroidal coil. The amount of current induced in the second coil is proportional to the solution conductivity (Hach,2008).
Neither or self-cleaning system nor compressed air are provided by the manufacturer or by the researchers for the conductivity sensor.
Table 3.1 : Summary table of th e used sensors. Sensor Brand Mo del P arameter Units Range Op era ting T pH Hac h 1 DPD1R1 pH --2 to 14 -5 °C to 70 °C Temp eratur e °C -5 to 70 Turbidit y Hac h LXV423.99.00100 Turbidit y NTU 0 to 4000 0 °C to 40 °C TSS mg/L 0.001 to 500000 Conductivit y Hac h 3727E2T Conductivit y µ S/cm 0 to 2000000 -10 °C to 200 °C Temp eratur e °C -10 to 200 DO Hac h 5790000 DO mg/L 0 to 20 0 °C to 50 °C Temp eratur e °C 0 to 50 ammo::lyser s::can 2 E-532-PR O-PH-075 Temp eratur e °C 0 to 60 0 °C to 60 °C pH -2 to 12 K + mg/L 0.02 to 1000 NH + 4 mg/L 0.02 to 1000 sp ect ro::lyser s:: can 5A-1035-485p0t01-sNO TSS mg/L dep ending on the optical pathlength 0 °C to 45 °C NO − 3 mg/L dep ending on the optical pathlength COD total mg/L dep ending on the optical pathlength COD sol bul e mg/L dep ending on the optical pathlength 1 Hac h, Lo v eland, CO, United States 2s::can, Wien, Austria
Figure 3.16: Hach Conductivity sensor used in the RSM30 stations.
Dissolved oxygen sensor
A Luminescent Dissolved Oxygen (LDO) sensor produced by Hach is used for the dissolved oxygen concentration determination (Figure 3.17). This sensor is specially designed for mu-nicipal and industrial wastewater applications (Hach,2006a).
The basis of the LDO sensor is to transmit blue light from a LED to the sensor surface. Between the flashes of blue light, a red LED is flashed on the sensor and used as an internal reference. The blue light excites the luminescent material and when the material relaxes it emits red light. The time for the red light to be emitted is measured. Increased oxygen in the sample decreases the time it takes for the red light to be emitted. The time measurements correlate to the oxygen concentration.
The LDO sensor is only installed at the outlet, since the concentration of the organic matter is high. Thus, the consumption of the DO is also high and its concentration is around 0 mg/L. Like the pH sensor, even if the LDO is not equipped by automatic cleaning, compressed air is provided to prevent matter attachments. Also, the air is activated every 5 minutes.
Turbidity sensor
The turbidity is measured by the Solitax sensor (Figure 3.18). Manufactured by Hach, this probe can measure the two correlated variables turbidity and TSS. By the way, only one of them can be displayed and collected.
Figure 3.18: Hach Solitax sensor used in the RSM30 stations.
The turbidity parameter is measured by the light-scattering principle. It is based on the measurements of the infrared light scattered sideways over an angle of 90°(Hach,2013). To determine TSS values, internally, there is a turbidity-TSS relation curve that automatically converts from the turbidity measurements.
In this case study, only turbidity measurements have been collected. However, to be able to compare on-line measurements with laboratory measurements, a calibration curve has been developed for each sensor following the procedure presented by Bertrand-Krajewski et al. (2007).
Finally, this sensor is equipped with a wiper that is used as a self-cleaning system to period-ically remove some particles and matter attached on the measurement length. The wiper is controlled by the sc1000 controller and is activated every 5 minutes (Detailed in section3.2.5). spectro::lyser sensor
The spectro::lyser sensor is manufactured by s::can (Figure 3.19). This probe is available to measure different parameters depending on its application. In case of wastewater applications, the measured parameters are nitrate, Chemical Oxygen Demand (COD), soluble Chemical Oxygen Demand (CODs) and Total Suspended Solids (TSS).
The spectrometer probes work according to the principle of UV-VIS spectrometry over a certain wavelength range (190-720 nm or alternatively, but not used here: 190-390 nm) (s::can,
Figure 3.19: s::can spectro::lyser sensor used in the RSM30 stations.
2007b). Substances contained in the medium to be measured weaken a light beam that transmits through this medium. The light beam is emitted by a lamp, and after contact with the medium its intensity is measured by a detector over a range of wavelengths. Each molecule has a particular (set of) wavelength(s) at which light is absorbed. The concentration of light-adsorbing substances contained in the sample determines the extent of the absorption at a particular wavelength. The wavelengths used for the determination of the concentration if the different pollutant characteristics are selected internally by a proprietary algorithm included in the ana::pro software.
The optical path length of the probe is fixed and cannot be varied. Depending on the appli-cation, it can be chosen to be 5 mm, 2 mm, 1 mm or 0.5 mm by inserting a piece allowing to shorten the path length (Figure3.20). In this application, the path lengths used are 2 mm for the inlet and 5 mm for the outlet.
Figure 3.20: Inserting piece to reduce the path length.
Furthermore, this sensor has a self-cleaning system controlled by the ana::pro software. Com-pressed air is injected periodically to remove possible attached matter. In this application, the air clean is activated every 5 minutes.
ammo::lyser sensor
The ammo::lyser sensor, manufactured by S::can, monitors the concentration of ammonium and potassium ions (Figure3.21). The measuring principle is based on ion selective electrodes using membranes that are porous for one specific ion-type (s::can,2007a).
Figure 3.21: s::can ammo::lyser sensor used in the RSM30 stations.
A robust ion selective membrane in the ammonium electrode separates the ammonium ions from the water. Afterwards, to compensate automatically for possible remaining cross-sensitivities, the ammo::lyser is equipped with sensors for temperature and pH, and a potassium electrode. Like the spectro::lyser probe, the ammo::lyser is equipped with a compressed air self-cleaning system also controlled by ana::pro providing compressed air every 5 minutes.
3.2.5 Controller
All Hach sensors are connected to a sc1000 Multi-parameter Universal Controller. It is a state-of-the-art controller system with the possibility to use it directly with 8 sensors or in a network with several other sc1000 controllers to accommodate many more sensors and parameters (Hach,2012).
The controller consists of a display module and one or more probe modules. The display module is a touch-screen display with a user-friendly interface. In normal operation the touch screen displays the measured values for the probes selected (Figure3.22). Each probe module can be configured with relays, analog outputs, analog or digital inputs, and digital fieldbus cards.
The display offers different display modes and a pop-up toolbar:
• Measured value display: The controller identifies the connected probes and displays the associated measurements.
Figure 3.22: Interface and color touch-screen display of the sc1000 controller (Hach,2012).
• Main menu display: Software interface for setting up parameters and settings of a device, probe and display module (Figure 3.23).
• Pop-up toolbar: The pop-up toolbar provides access to the sc1000 controller and probe settings and is normally hidden from view.
3.2.6 Maintenance and operation
The stations require periodical control and maintenance visits. Supervision of the operation of the stations is essential to assure the quality and reliability of the measurements. For that a functional check might be required for one of the following reasons:
• Routine functional check
• Suspicion of fouling of the measuring windows of the light-based sensors and electrodes • Change of location where the probe is deployed or change in type of probe connected • Suspicion of probe malfunction
• Changes in operational conditions
During the execution of a functional check, the following actions proposed by Plana (2013) have to be performed.
• Checking the actual status and the functionality of the different probes
• Checking the trueness and precision of the readings to describe the reliability of the sensor (ISO,1994).
• Checking the historical status or system stability 3
• Checking unintentional modifications of the measuring settings caused by unauthorized access or remote control
• Checking the probe’s mounting
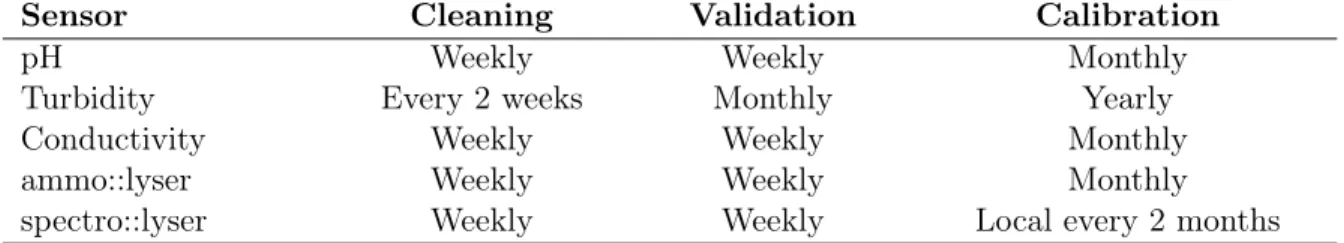
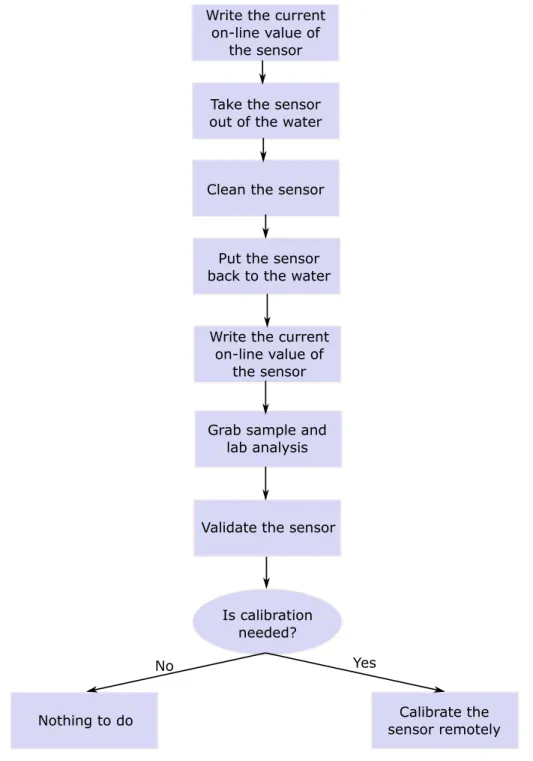
To carry out these functional check activities, a specific protocol for cleaning, validation and calibration has been established in this thesis for each sensor (See section4.2.2). The frequency by which the activities have to be realized depends mainly on the type of application.
Cleaning protocol
Fouling due to the adhesion of silt, clay or biofilm on the sensors is one of the main problems when working with AMS. Despite automated cleaning systems (wiper, air cleaning) installed on some sensors, manual cleaning is still needed.
Normally, the cleaning is done using a soft, wet cloth (Kim Wipe) and distilled water. In case there is still some attached matter on the sensor, a kitchen degreaser and a hydrochloric acid (3 %) solution can be used. The procedure is detailed inBoudreau (2011).
3The stability is known as the ability of a sensor to keep its performance characteristics for a relatively