In summary, for patients we can obtain a more approxi-nate value for LDL-C that, when the serum concentrations f PG are >3.3 mmolfL, is almost surely overestimated. )nly those with an estimated LDL-C >4.1 mmol/L,
espe-ially if their serum PG is <3.3 munol/L, will merit addi-ional investigation. This proposed approach is summa-ized in Figure 2.
Controls OttO C/IC .1.50 smelL
Ca1cu1 ate IC -ar
\
ir,
3.4 osolL Pat tents ottO C/IC 3.3, ,cncl/t. Calculate IC - HDLC a- \ 3.1 seouL Ir 0 4.1 emdl/LaCt i4at :Ofl
to thee. IC-vOL-C values above .1.1 reel/i.
tic ‘urth.r truest ijat ion e #{149}.cessary
[
Calculate IC - 4OLC-(0.23 TO)
t 3.1 emel.L I 4.i mecl,I
1.
1.
00 rurther CcntinOe invest, get ion truest igat ion. is ,ecessary #{149}specially in
those ..ith LOL -Cest teat sal 4.1 scot/i. one serum 16 0 3.3
05501 /L
LIN. CHEM. 36/9, 1675-1678 (1990)
CLINICAL CHEMISTRY, Vol. 36, No. 9, 1990 1675
ig. 2. Strategy proposed to determine if further investigation is
ecessary among those individuals having a possibly unreliable alculated LDL-C
We are grateful for the financial support of the Autonomous Government of the Canary Islands, Spain.
References
1. Friedewald WT, Levy RI, Fredrickson DS. Estimation of the concentration of low-density lipoprotein cholesterol in plasma, without use of the preparative ultracentrifuge. Clin Chem 1972;18:499-502.
2. De Long DM, De Long ER, Wood DD, Lippel K, Rifkind BM. A comparison of the methods for the estimation of plasma low and very low density lipoprotein cholesterol. The LRC prevalence study. J Am Med Assoc 1986;265:2372-7.
3. Elefson RD. Variability in the VLDL cholesterollVLDL triglyc-erides ratio and related errors in the estimation of LDL cholesterol [Abstract]. Clin Chem 1985;31:948.
4. Rao A, Parker AH, El-Sheroni NA, Babelly MM. Calculation of low-density lipoprotein cholesterol with use of triglyceride/choles-terol ratios in lipoproteins compared with other calculation meth-ods. Clin Chem 1988;34:2532-4.
5. Marsal A, Gomez-Gerique JA, Franco Peral M. Validaci#{244}nde la f#{233}rmulade Friedewald [Communication]. Clin Invest Arterioscle-rosis 1989;l(Suppl 1):16.
6. Siedel J, Haegele EO, Ziegenhorn J, Wahlefeld AW. Reagent for the enzymic determination of serum total cholesterol with improved lipolytic efficiency. Clin Chem 1983;29:1075-80.
7. Wahlefeld AW. Triglycerides determination after enzymatic hydrolysis. In: Bergmeyer HU, ed. Methods of enzyme analysis, 2nd ed. New York: Verlag Chemie-Academic Press, 1974:1824-31. 8. Lopes-Virella MF, Stone P, Ellis S, Coiwell JA. Cholesterol determination in high-density lipoproteins separated by three different methods. Clin Chem 1977;23:882-4.
9. Goodman DS. New guidelines for lowering blood cholesterol and coronary risk. Atherosclerosis Rev 1988;18:75-84.
)uantitative
Nephelometric
Assay
for Determining
Myoglobin
Evaluated
loris R. Deianghe,’ Jean-Paul Chapelle,2 and Serge C. Vanderschueren’
recently introduced automated nephelometric
immunoas-y involving shell/core particles for determination of myo-lobin (Behringwerke) was evaluated with the BNA
Nephe-meter. Method precision was good: the intra-assay CV ailed between 1.5% and 6.1%; with daily calibration, the terassay CV ranged between 1.5% and 7.5%. For usual ample dilutions, the assay response varied linearly with
yoglobin concentrations up to 23.1 nmol/L. After automatic ilution by the instrument, concentrations up to 2310 nmol/L
uid be measured without high-dose “hook”
effect.
Further anual dilution allowed measurement of myoglobin concen-ations up to 26 000 nmol/L. Calibration was stable for atast seven days. We detected no significant interferences om hemoglobin, haptoglobin, bilirubin, iodine-containing
ntrast media, and rheumatoid factors. Treating lipemic
samples with Lipoclean (Behringwerke) decreased test re-sults. Simultaneously drawn serum and plasma samples from the same subject showed no consistent differences in myoglobin concentrations. The mean reference myoglobin concentration was 1.380 (SD 0.82) nrntWL for men and 0.878 (SD 0.45) nmol/L for women. In patients with renal insuffi-ciency, serum creatinine values were moderately related to serum myoglobin values (r = 0.465). Although a commercial radioimmunoassay (Byk-Sangtec) and the nephelometric assay intercorrelated well (r = 0.929), values obtained by nephelometry were significantly lower (P <0.05). By both assays, results for heart and skeletal muscle tissue extracts showed no correlation, a finding that suggests the existence of multiple forms of myoglobin in human tissues. We con-clude that immunonephelometry is a rapid, practical, and reliable method for measuring myoglobin in serum.
1Department of Clinical Chemistry, Umversitair Ziekenhuis De
ntelaan 185,B-9000 Gent, Belgium.
2Department of Clinical Chemistry, University of Liege, CHU-l5, Domaine Universitaire du Sart Tilman, B-4000 Liege,
Bel-Received April 6, 1990; accepted July 6, 1990.
AddItIonal Keyphrases: reference values renal insufficiency sex- and age-related effects
Myoglobin is a small-molecular-mass oxygen-binding protein (Mr 17 700), abundant in human skeletal and
1676 CLINICAL CHEMISTRY, Vol. 36, No. 9, 1990
cardiac muscle. Determination of myoglobin concentra-tions in serum is therefore useful for evaluation of skeletal
muscle damage (1), for early diagnosis and monitoring of acute myocardial infarction (AMI) (1-3), and for detecting coronary reperfi.ision (4) or reinfarction (1). Measuring cumulative myoglobin release in serum has been proposed for sizing infarcts (5).
In the routine clinical laboratory, myoglobin concentra-tions can be determined by radioimmunoassays (RIAs) (6) or by latex agglutination tests (7). However, RIAs are time consuming and therefore not suited for emergency testing. Latex agglutination tests give only semiquantitative re-sults and can occasionally give false-negative results in the presence of antigen excess (t5hook” effect). Because serum myoglobin concentrations in clinical practice are in the range 0.5-50 000 mnol/L, simultaneous serial serum dilu-tions must be measured. In the present study, we evaluated a recently introduced automated nephelometric method based on shell/core polymer particles coated with anti-myoglobin antibodies and compared results with those obtained with a commercially available RIA. Here we present the results of this analytical evaluation, which was performed in two university hospitals.
Materials and Methods Methods
Nephelotnetric method. In each center, myoglobin in serum, plasma, and tissue was assayed with an automated
nephelometric immunoassay (NA-Latex Myoglobin Pest;
Behringwerke, Marburg, F.R.G.) based on shell/core parti-cles coated with anti-myoglobin antibodies (8), with use of a selective multi-protein Behring Nephelometer Analyzer. In one center (A; Universitair Ziekenhuis, Gent), the ana-lyzer had been intensively used for three years. The other center (B; Centre Hospitalier Universitaire, Liege) used a new analyzer. In both cases, the assay was performed ac-cording to the manufacturers procedure, with a standard serum dilution of 1:20, unless otherwise stated, and a 12-mm incubation time for the antigen-antibody reaction. We used a commercial myoglobin control serum from Behringwerke.
Comparison study. For comparison, we assayed myoglo-bin with an RIA (RIA-mat myoglobin no. 323.500 (3830); Byk-Sangtec, Dietzenbach, F.R.G.), performed according to the package insert. We assayed 127 serum samples (40 from healthy blood donors, six from renal insufficiency patients, 55 from acute myocardial infarction patients, 22 various samples with increased myoglobinemia, four con-trol sera) and 29 tissue extracts, made from human heart (n = 15) and skeletal muscle (n = 14) tissue samples
obtained at autopsy. Tissue extracts were prepared accord-ing to Psung (9).
Stability of the analyte. We evaluated the stability of the analyte in serum by measuring myoglobin concentration in various serum sample pools before and after storage at different temperatures: at room temperature (for two days), refrigerated (4#{176}Cfor 10 days), and frozen (-21 #{176}Cfor 60 days).
Stability of calibration. To assess the stability of calibra-tion of the nephelometric assay, we compared for each instrument the test results obtained with use of stored and daily calibration curves.
Imprecision. Nine different serum pools (P1-P9) were prepared from serum samples with increased myoglobin concentrations (>4.7 nmol/L). We tested intra-assay repro-ducibility with a series of 20 aliquoted samples from the
different pools. We also pooled serum made from sampl from patients with AM!, or with liver or renal insufflcienc Interassay reproducibility was evaluated by assaying si rum pools and the control serum during nine to 15 consei
utive
days.Sensitivity and linearity. We tested the sensitivity of th nephelometric assay for serum in both standard and sixfol dilution, as provided by the instrument. To evaluate tb linearity of the nephelometric assay, we used serial aut mated or manual dilution of serum samples from fi patients with rhabdomyolysis, which contained high cos centrations of myoglobin in serum (575-28000 nmol/L).
Interference studies. We studied the effects on myoglobi test results of adding to serum pools various potentiall interfering substances: purified human haptoglobin (phd notypes 1-1, 2-1, and 2-2, nos. H-0138, H-9887, and H-976 respectively; Sigma Chemical Co., St. Louis, MO 6317k and water-soluble iodine-containing roentgenographic coT trast media (Omnipaque; iodine content: 240 and 350 g/l Nycomed, Oslo, Norway). Effects of triglycerides, hemogl bin, bilirubin, and rheumatoid factor were studied b adding to samples serum that was enriched in these con pounds up to final concentrations of 13.7 mmol/L, 0.17 mmol/L, 547 mol/L, and 2500
mt.
unitsfL, respectivel Lipid extraction of serum samples (n = 39) by means of thcommercial extraction agent Lipoclean (Behringwerk was carried out according to the manufacturer’s recommer dations (three volumes of extraction medium for two vo umes of serum).
Blood Samples
Serum and EDTA- or citrate-treated plasma sample were centrifuged (1000 x g, 10 mm, room temperature) an analyzed within 24 h after venipuncture.
Patients
Apparently healthy blood donors (197 men, mean age: SD: 39.9 ± 13.0 years, and 85 women, 39.8 ± 12.1 yean served as a reference population for determining the noi mal range of myoglobin in serum. Serum samples from 9
patients with renal insufficiency (47 men, 44 women, age 55.3 ± 16.3 years; serum creatinine and urea concentrE tions of 875 ± 424 zmoI/L and 27.56 ± 7.80 mmol/I respectively), were used to test the effect of glomerul ifitration rate on the myoglobin concentration in serum. Results
Reproducibility. Intra-assay coefficients ofvariation (C for patients’ and control samples were between 1.5% 6.1%; daily calibrated interassay CVs were between 1.5 and 7.5%. Lowest CV values were obtained with the ne equipment. Table 1summarizes intra- and interassay C for different pools used in the evaluation centers.
Sample stability. Storage of serum samples at roo temperature for 48 h, refrigerated at 4#{176}Cup to one week, frozen during 60 days did not affect myoglobin valu significantly.
Stability of calibration. To compare the stability of d and single calibration of myoglobmn tests, we repea measured serum pools and a control. Using a single bration curve during the entire period of interassay rep ducibility testing, we observed an increase in the imp sion in the two centers: in hospital A (pools 7-9), C increased to 6.8-14.8% (vs 5.9-7.5% with a new calibrati each day); in hospital B (pools 4-6), CVs increased
Table 1. ReproducibIlity of Nephelometrlc Myoglobln DeterminatIon Center A Center B Intra-assay (n = 20 each) Mean, nmol/L 6.64 SD, nmol/L 0.41 CV,% 6.1
lnterassay (with daily calibration)
P18 P2 P3 C P4 P5 P6 C
6.13 6.05 5.99 4.57 9.10 17.24 5.82
0.13 0.16 0.19 0.09 0.22 0.50 0.08
2.1 2.7 3.2 2.0 2.4 2.9 1.5
P7 P8 P9 C P4 P5 P6 C
Interassay (with single, stored calibration)
No.of days 9 9 9 13 13 13 13 13
Mean, nmol/L 8,13 10.40 18.05 5.83 4.74 8.79 17.34 5.67
SD, nmol/L 0.59 0.61 1.36 0.34 0.15 0.19 0.27 0.24
CV, % 7.2 5.9 7.5 5.8 2.2 2.1 1.5 4.2
P7 P8 P9 C P4 P5 P6 C
#{149}P1-P9:different serum pools; C,control serum.
No. of days 9 9 9 9 15 15 15 15 Mean, nmol/L 7.34 10.07 15.98 5.07 5.07 9.16 17.66 6.11 SD, nmol/L 0.74 0.68 2.41 0.45 0.25 0.38 0.88 0.33 CV, % 10.2 6.8 14.8 8.9 4.8 4.2 5.0 5.4 Age group, y 4.2-5.0% (vs 1.5-2.2% with a new calibration each day).
Table 1 summarizes results of calibration stability on various serum pools and controls.
Range and linearity. The basic measuring range covers myogiobin concentrations from 1.39 to 22.4 nmol/L. When sample dilution was sixfold, concentrations as low as 0.34 nmol/L could be detected. Samples with high myoglobin concentration can automatically be rerun by the analyzer by further sample dilution up to 1:100, 1:400, and 1:2000. In this way, we found the standard curve of the nephelo-metric method to be linear from 0.34 to about 2310 nmol/L. A high-dose “hook” effect does not occur in the tested range (myoglobin concentrations up to 26000 nmol/L).
Interferences. No interference from hemoglobin (up to a final concentration of 0.178 mmol/L) and haptoglobin (up to a final concentration of 6.7 g/L) could be detected. Also, addition of solutions of the three different phenotypes (1-1, 2-1, and 2-2) of purified human haptoglobin (final concen-tration 0.5 g/L) to serum samples did not influence test
sults. Addition of bilirubin (final concentrations up to 547 ol/L) and rheumatoid factor (final concentrations up to 500
mt.
units/L) to serum pools with increased myoglobinneentrations did not interfere with the nephelometric y. The presence of
iodine-containing
contrast media Omnipaque) up to a final iodine concentration of 24 g/L ine patients’ sera did not interfere with the assay, except in ne out of 10 cases. However, the concentrations used xceed the maximal iodine concentrations usually obtained uring coronarography (±15 g/L). Effects of hypertriglyc-ridemia on test results were negligible up to
concentra-ons of 13.7 mmoIJL.
Lipid extraction. Lipid extraction of normolipemic serum pies resulted in a variable relative loss [23.3 (±20.5)%, edian 38%, n = 36] of myoglobin concentration. In hyper-pemic samples, loss of myoglobin concentration after lipid xtraction was more pronounced [81.2 (±3.7)%, n = 3].
ddition to normolipemic serum of myoglobin-poor serum ch in triglycerides (final triglyceride concentration of 6.84
oIJL) resulted in an increased myoglobin loss. There-ore, use of lipid extraction procedures before
nephelomet-c determination of myoglobin is not recommended.
Comparison between serum and plasma test results. Myo-globin values in simultaneously drawn serum and EDTA-plasma samples showed a good correlation: y (EDTA-plasma myoglobin, nmoIJL) = 0.665x (serum myoglobin, nmol/L) + 1.757 (r = 0.956, n = 19, S = 2.89). However,
for extremely low and high myoglobin concentrations, relative differences between serum and EDTA-plasma con-centration may be high. Similar findings were obtained when serum was compared with citrate-treated plasma:
y (citrate-treated plasma myoglobin, nmol/L) = 1.lSx
(se-rum myoglobin, nmolJL) + 2.22 (r = 0.775, n = 10, S =
6.80).
Correlation with RIA-method. Myoglobin was simultane-ously determined by both methods in a group of 127 serum samples from the reference population (n = 40), renal
insufficiency (n = 6), and AM! patients (n = 55). A good
correlation between the nephelometric and RIA assays for serum myoglobin was obtained: logly (myoglobin-RIA, nmol/L)] = 0.944logIIx (myoglobin-nephelometry, nmol/L)]
+ 0.012 (r = 0.929, n = 127, S = 0.205). However, in both
skeletal and heart muscle tissue samples, correlation be-tween both methods was lacking.
Reference values. In the reference population, values for males (1.35 ± 0.81 nmolJL) were significantly (P <0.05) higher than those for females (0.86 ± 0.44 nmol/L). In both
Table 2. Reference Values (Mean ± SD) for Serum
Myoglobln AccordIng to Age and Sex
Males Female. n nmol/L n nmol/L 11-20 4 1.297 ± 0.105 4 0.503 ± 0.1348 21-30 39 1.162 ± 0.531 18 0.751 ± 0.299 31-40 80 1.325 ± 0.804 28 0.796 ± 41-50 42 1.440 ± 0.852 15 1.054 ± 0.55ga 51-60 17 1.436 ± 0.649 16 1.075 ± 0.5698
61-70AP <0.05, bP <0.01.15 Differences2.046 ± between1.497 sex groups were evaluated4 1.004 ± 0.5538by a
Mann-Whitney Utest.
1678 CLINICAL CHEMISTRY, Vol. 36, No. 9,1990
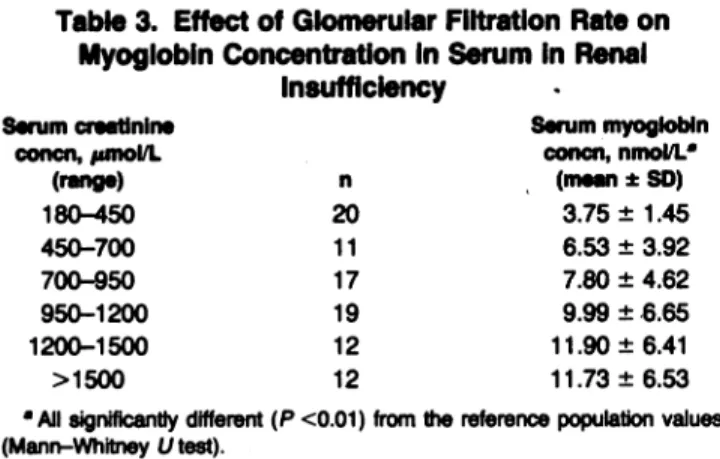
sexes, reference values increased significantly with age. Table 2 depicts reference values for serum myoglobin concentration according to sex and age. Patients with renal insufficiency also showed significantly higher values. Val-ues for serum myoglobin concentration in patients with various degrees of renal insufficiency are given in Table 3. In these patients, concentrations of serum creatinine and serum myoglobmn correlated moderately: y (myoglobin, nmol/L) = 0.00587x (creatinine, mo1JL) + 3.22 (r = 0.465,
n = 91, S = 6.314).
DIscussion
The new nephelometric latex myoglobin test allows fast and convenient myoglobin determinations of high analyti-cal quality, with use of only small amounts of serum (80 .iL). These properties make the method suited for deliver-ing stat results. Intra- and interassay CVs are within acceptable limits. Assay results are available within 12 mm, which makes the method suited for the emergency laboratory. Samples with high myoglobin concentration (>23.1 nmol/L) can be rerun automatically by the instru-ment from a higher predilution, which is an advantage with respect to RIA methods. Manual dilution of the serum sample was necessary in only one case, where serum myoglobin concentrations exceeded 139.5 nmol/L. In the observed concentration range (0-26 000 nmol/L), no high-dose “hook” effect could be detected, which is advantageous over latex agglutination tests, where false-negative results may be obtained owing to excess antigen (10). Daily cali-bration of the nephelometric assay resulted in lower in-terassay CV values. Calibration curves remained stable during at least one week. Reference values for serum myoglobin concentration obtained by nephelometry are lower than those obtained by RIA (11, 12). In agreement with literature, the reference values we obtained for serum myoglobin are age- and sex-related and positively corre-lated with serum creatinine concentration (11, 12). Inter-ferences resulting from the presence of rheumatoid factors, hemoglobin, bilirubin, and triglycerides are negligible un-der routine conditions. Moreover, iodine-containing con-trast media, often used in invasive procedures for evaluat-ing and treating AM!, do not interfere with the
nephelo-metric assay. Lipid extraction, which leads to an
underestimation of the myoglobin concentration, is not recommended for turbid samples. With respect to
Byk-Table 3. Effect of Giomerular Filtration Rate on
Myoglobln Concentration In Serum In Renal
insufficiency Serum creatinlne concn, pmol/L (rang.) n Serum myoglobin concn, nmol/L (mean ± SD) 180-450 20 3.75±1.45 450-700 11 6.53 ± 3.92 700-950 17 7.80 ± 4.62 950-1200 19 9.99 ± 6.65 1200-1500 12 11.90 ± 6.41 >1500 12 11.73±6.53
AII significantly different (P <0.01) from the reference population values
(Mann-Whitney Utest).
Sangtec RIA results, good correlation was obtained foi serum and plasma samples. However, values obtained b3 the automated nephelometric assay are about 30% lowei than those obtained by RIA.
In the tissue samples, a striking lack of correlatior between both assays was observed. These results ma indicate differences between tissue and serum forms 01 myoglobin and demonstrate heterogeneity of antigeni sites of human myoglobin, which is in agreement witi earlier findings on human serum myoglobmn (13) and ani. mal myoglobin (14, 15). Although the correlation betweer serum and plasma myoglobin concentrations was good important differences may be found at higher concentra tions (increased values for citrate-treated plasma, de creased values for EDTA-plasma).
In conclusion, immunonephelometric determination o: serum myoglobin is a fast, convenient, and reliable method appropriate to the emergency laboratory.
We thank Mr. M. De Buyzere for his helpful discussions. References
1. Kagen L. Myoglobin: methods and diagnostic uses. Crit Re’i Lab Sci 1978;9:273-302.
2. Cairns J, Missirlis E, Walker W. Usefulness of serial determi nations of myoglobin and creatine kinase in serum compared foi assessment of acute myocardial infarction. Clin Chen 1983;29:469-73.
3. Chapelle J-P, El Allaf M, Larbuisson R, Limet R, Lamy M Heusghem C. The value of serum CK-MB and myoglobin measure ments for assessing perioperative myocardial infarction after car diac surgery. Scand J Clin Lab Invest 1986;46:519-26.
4. Ellis A, Little T. Patterns of myoglobin release after reperfu sion of injured myocardium. Circulation 1985;72:639-47.
5. Groth T, Hakman M, Haligren R, Roxin L-E, Venge P. Diag nosis, size estimation and prediction of acute myocardial infarctior from S-myoglobin observations. A system analysis to assess th influence of various sources of variability. Scand J Lab Invest 1980;40(Suppl 155):111-24.
6. Rosano T, Kenny M. A radioimmunoassay for human serun myoglobin: method development and normal values. Clin Chen 1977;23:69-75.
7. Chapelle J-P, Heusghem C. Semi-quantitative estimation o; serum myoglobin by a rapid latex agglutination method: ar emergency screening test for acute myocardial infarction. Cur Chim Acts 1985;145:143-50.
8. Kapmeyer W, Pauly H-E, Tuengler P. Automated nephelomet nc immunoassays with novel shell/core particles. J Clin Lab Ana 1988;2:76-83.
9. Tsung SW. Creatine kinase isoenzyme patterns in humax tissue obtained at surgery. Clin Chem 1976;22:173-5.
10. Toft E, Stentoft J, Andersen P. False-negative latex aggluti nation test for myoglobin owing to antigen excess [Letter]. Cli Chem 1988;34:177.
11. Hallgren R, Karison F, Roxin L.Myoglobin turnover influen of renal and external factors. J Lab Clin Med l978;9l:246-54. 12. Chen I, David R, Maxon H, Sperling M, Stein E. Age-, sex and race-related differences in myoglobin concentrations in th serum of healthy persons. Clin Chem 1980;26:1864-8.
13. Van Eostenberghe H, Delanghe J, Wieme R. Glycosylation o human tissue myoglobin [Abstract]. J Clin Chem Cliii Bioche 1988;26:334.
14. Wu J, Pieper R,Wu L, Peters J. Isolation and characterizatio of myoglobin and its two major isoforms from sheep heart. Cl Chem 1989;35:778-82.
15. Van Den Oord A. On the heterogeneity of equine myoglobi Protides Biol Fluids Proc Colloq 1969;17:267-77.