The contract farming as a determinant
promoting tea production and marketing at
farm household in Vietnam:
a case study in Phu Tho province
UNIVERSITÉ DE LIÈGE – GEMBLOUX AGRO-BIO TECH
THE CONTRACT FARMING AS A DETERMINANT
PROMOTING TEA PRODUCTION AND MARKETING AT
FARM HOUSEHOLD IN VIETNAM:
A CASE STUDY IN PHU THO PROVINCE
LE Thi Kim Oanh
Dissertation originale présentée en vue de l’obtention du grade de docteur en sciences agronomiques et ingénierie biologique
Promoteur : Prof. Philippe Lebailly
Copromoteur : Prof. Tran Huu Cuong (Université d’agronomie Hanoi) 2018
Le Thi Kim Oanh (2018). L'agriculture contractuelle comme facteur déterminant promouvant la production et la commercialisation du thé au sein des ménages paysans au Vietnam: une étude de cas dans la province de Phu Tho, au Vietnam. (Thèse de doctorat) Gembloux, Belgique, Université de Liège, Gembloux Agro-Bio Tech, 238 p., 43 tabl., 44 fig.
Résumé
Le thé contribue considérablement aux exportations annuelles du Vietnam, aide à créer des emplois et augmente le revenu des agriculteurs. Cependant, les cultivateurs de thé doivent faire face à de nombreuses difficultés et sont très vulnérables en raison de leurs terres de culture du thé modestes et dispersées, de la mauvaise gestion de l’exploitation, du faible contrôle des maladies et de l’instabilité du marché. De nombreuses études ont prouvé que l'agriculture contractuelle offrait de nombreuses opportunités aux agriculteurs, telles que l'accès aux crédits et aux intrants, ainsi que l'accès à un marché fiable. Néanmoins, jusqu'à présent, il n'y a toujours pas de recherche approfondie sur les avantages de l'agriculture contractuelle pour la production de thé dans la province de Phu Tho. Cette thèse vise donc à analyser l'efficacité de l'agriculture contractuelle dans la production de thé à Phu Tho et à déterminer si celle-ci améliore les revenus des agriculteurs.
L'étude a été menée dans trois groupes différents d'agriculteurs: sous contrat complet, sous contrat partiel, sans contrat. Les résultats ont montré que: 1) Plus les agriculteurs sous contrat complet produisaient, plus leurs revenus étaient élevés, même si leur prix de vente était inférieur à celui des autres groupes; 2) Le prix de vente du thé chez les agriculteurs sous contrat complet était le plus bas, tandis que celui des agriculteurs sans contrat était le plus élevé; 3) La superficie moyenne de terre à cultiver du modèle de contrat complet était la plus élevée parmi les trois groupes étudiés et c’est l’usine de transformation qui possédait cette terre, tandis que les agriculteurs sous contrat partiel et sans contrat étaient propriétaires de leurs terres. Dans le premier modèle, les terres ont été fournies aux agriculteurs sous des conditions spéciales auxquelles les agriculteurs des deux autres modèles se trouvaient incapables d’engager; 4) Le rendement de la plantation de thé des agriculteurs sous contrat complet était le plus élevé grâce à la haute qualité des intrants; 5) Les agriculteurs sous contrat étaient, en générale, satisfaits des intrants de production et des activités de commercialisation du thé; 6) L'agriculture contractuelle a aidé à promouvoir la chaîne de valeur du thé noir dans la province de Phu Tho. Néanmoins, les agriculteurs sous contrat devaient encore faire face à divers inconvénients tels que les prix bas, les exigences de qualité et les relations d’obligation avec des entreprises. En outre, il y avait divers facteurs affectant l'agriculture contractuelle du thé dans la province de Phu Tho.
Sur la base des résultats ci-dessus, il y a quelques recommandations importantes comme suit: premièrement, les termes du contrat devraient être améliorés; deuxièmement, le rôle des gouvernements locaux devrait être renforcé; troisièmement, le gouvernement devrait mettre en œuvre différentes mesures pour promouvoir l'agriculture contractuelle de thé; quatrièmement, le succès du modèle d'agriculture contractuelle complète devrait également être encouragé plus
largement; finalement, le modèle d'agriculture semi-contractuelle devrait être amélioré et promu.
Mots clés : Agriculture contractuelle, agriculteurs, thé noir, Phu Tho province, Vietnam
Le Thi Kim Oanh (2018). The contract farming as a determinant promoting tea production and marketing at farm household in Vietnam: a case study in Phu Tho province, Vietnam. (PhD Thesis) Gembloux, Belgium, University of Liège, Gembloux Agro-Bio Tech, 238 p., 43 tabl., 44 fig.
Abstract
Tea contributes substantially to Vietnam’s annual exports, helps creating job opportunities and raises farmer’s income. However, tea farmers face many difficulties and are highly vulnerable due to their scattered tea areas, poor farm management, weak disease control, and unstable market. Numerous studies proved that contract farming brings many opportunities for farmers such as access to credit and inputs, together with access to a reliable market. Nevertheless, until now, there has not been any thorough research on the benefits of contract farmers on tea production in in Phu Tho province. This thesis, therefore, aims to analyze efficiency of tea contract farming in Phu Tho and identify if contract farming improves farmers’ income.
The study conducted in three different groups of full, semi and non-contract farmers. The results show that: 1) The more full contract farmers produce, the higher income they get, even though their selling price might be lower than the other groups; 2) Tea price of full contract farmers was the lowest, while that of non-contract farmers was the highest; 3) Average land area of full non-contract model was the highest in the three studied groups and owned by the processing plant whereas semi and non-contract farmers are self-ownership. Land was provided to full contract farmers with special conditions that semi and non-contract model found it is likely unable for them to engage; 4) Full contract farmers’ tea yield was the highest in three farmer groups thanks to the high quality of input materials; 5) Contract farmers were generally satisfied with tea production inputs and tea marketing activities; 6) Contract farming helped promoting black tea value chain in Phu Tho province. Nevertheless, contract farmers still face various disadvantages such as low prices, requirements for high-quality, and obliged relationship with the companies. In addition, it appears various factors affecting tea contract farming in Phu Tho province.
Based on the above findings, there are some important recommendations as follows: firstly, the terms in the contract should be improved; secondly, the role of local governments should be enhanced; thirdly, the government should implement different measures to promote tea contract farming; fourthly, the success of full contract farming model should also be promoted more widely; and fifthly, semi contract farming model should be improved and promoted.
I would like to express my deepest gratitude for the active support from many different people and institutes. First of all, I kindly cherish most my thesis promoter, Prof. Philippe Lebailly for his intellectual guidance, encouragement and special support at all possible stages. I am especially grateful to him for his inspirational discussions on this thesis. I learned a lot about research methods in social and rural development from him.
I also thank Prof. Tran Huu Cuong, the co-promotor of this thesis, for his scientific and scholarly contributions as well as encouragement since I first wrote the PhD thesis proposal. He helped me to put the first bricks in the building up the PhD research. He monitored all the processes of my PhD research both in Belgium and Vietnam.
I would like to offer a big thank to Prof.Vu Dinh Ton whose guidance helped me in all the time of research and writing of this thesis.
During the study period in Belgium, I also received valuable supports from various individuals and organizations. I would like to thank Prof. Thomas Dogot and Prof. Philippe Burny for giving me a lot of useful advice and consultation.
My thesis can not be completed without the help of local authorities and farmers in Dich Qua and Minh Tien communes in the two districts Thanh Son and Doan Hung of Phu Tho province. They were so kind in giving me their time and patiently answering my survey questionnaires.
I would like to thank all members of the Department for Economics and Rural Development for their administrative support, particularly Nadine Stoffelen, Anne Pompier, and Christine Fadeur who thoroughly did the process of finalizing all administrative materials. I would also like to thank Dr. Ho Thi Minh Hop who also worked at the department and I am gratefully indebted to her for her very valuable comments on this thesis.
My sincere thanks also go to my friends and colleagues in the Department of Business Management for encouraging and allowing me to participate and complete this thesis. I am especially grateful to my colleagues, Dr. Nguyen Quoc Chinh, Mr. Nguyen Hai Nui, Mr. Dong Dao Dung, and Assoc.Prof.Dr. Bui Thi Nga for contributing one way or another to my doctoral thesis by collecting data as well as sharing work in the office.
Last but not least, I was blessed with love, patience, inspiration and encouragement from my parents, my parents-in-law, my beloved husband and my wonderful son and daughter who share all their happiness and support in any endeavor I undertake.
Résumé ... i
Abstract ... iii
Acknowledgments ... i
Contents ... iii
List of figures ... vii
List of tables ... ix
List of boxes ... xi
List of abbreviations ... xiii
1. INTRODUCTION ... 1
1.1 Background and rationale ... 1
1.2 Research objectives and Questions ... 3
1.2.1 Research objectives ...3
1.2.2 Research questions ...4
1.3 Research hypotheses ... 4
1.4 Scope of the study ... 4
1.5 Thesis structure ... 4
2. THE CONTEXT OF TEA ... 7
2.1 Tea production in the world ... 9
2.1.1 World tea growing areas ...9
2.1.2 Black tea products ...11
2.1.3 World’s tea production ...12
2.1.4 Tea trade in the world ...15
2.1.5 Tea prices in the world ...17
2.1.6 World tea consumption ...19
2.1.7 Challenges for the tea industry ...21
2.1.8 Projection of world tea production and export from 2013 to 2023 ...23
2.2 Tea production in Vietnam ... 24
2.2.1 Brief history of tea development in Vietnam ...24
2.2.3 Tea production in Vietnam ...27
2.2.4 Vietnam tea exports ...29
2.2.5 Domestic consumption of tea in Vietnam ...31
2.2.6 Challenges for Vietnam’s tea industry ...32
2.3 Tea production in Phu Tho ... 34
2.3.1 Tea production in Phu Tho...34
2.3.2 Tea processing in Phu Tho ...37
2.3.3 Tea value chain in Vietnam and in Phu Tho ...38
3. LITERATURE REVIEW ... 47
3.1 Contract farming ... 49
3.1.1 Concepts of contract farming ...49
3.1.2 Types of contract farming ...49
3.1.3 Experiences of contract farming in the world ...52
3.1.4 Experience of contract farming in Vietnam ...53
3.1.5 Contents of contracts ...54
3.1.6 Attention in management of contract farming ...56
3.2 Contract farming and farmers ... 56
3.2.1 Farmers’ benefits from contract farming ...56
3.2.2 Problems of contract farming ...59
3.2.3 Farmer-related issues ...62
3.3 Contract farming as a determinant in the promotion of production and marketing ... 63
3.3.1 Contract farming as a determinant in the promotion of production ...63
3.3.2 Contract farming as a determinant in the promotion of marketing ...65
3.4 Factors affecting contract farming ... 66
3.4.1 Internal factors ...66
3.4.1.1 Farmers...66
3.4.1.2 Companies ...66
3.4.2 External factors ...68
3.5 Experiences of contract farming in the tea industry ... 74
3.5.1 Experiences of tea contract farming in the world ...74
3.5.2 Experiences of tea contract farming in Vietnam ...77
4. Research methodology ... 83
4.3 Data collection ... 93
4.3.1 Primary data ...93
4.3.2 Secondary data ...96
4.4 Data analysis ... 96
5. TEA CONTRACT FARMING IN PHU THO ... 103
5.1 Contract farming scheme in Phu Tho ... 105
5.1.1 History of tea contract farming in Phu Tho province ... 105
5.1.1.1 Full contract (Nucleus estate model or production – management) ... 105
5.1.1.2 Semi contract (Intermediary or marketing contract) ... 107
5.1.2 Types of contract farming and outgrower scheme in the province of Phu Tho109 5.1.3 Characteristics and capital in tea production of contractees ... 114
5.1.3.1 Characteristics of tea farmer groups ... 114
5.1.3.2 Land area of tea farmer groups ... 118
5.1.3.3 Credit of tea farmer groups ... 119
5.1.3.4 Family labor of tea farmer groups ... 121
5.1.3.5 Machines and equipment used in tea production ... 123
5.1.3.6 Investment in tea garden ... 124
5.1.4 Characteristic of contractors ... 127
5.2 Contract farming as a determinant promoting tea production and marketing at farm household in Phu Tho province ... 129
5.2.1 Tea production by famer groups in Phu Tho province ... 129
5.2.1.1 Fertilizers and chemicals ... 129
5.2.1.2 Fresh tea characteristics (tea buds) ... 130
5.2.1.3 Tea production techniques... 135
5.2.1.4 Tea yield ... 139
5.2.1.5 Influence of contract farming on tea production costs ... 142
5.2.1.7 Farmers’s satisfaction with inputs in tea production ... 149
5.2.2 Tea marketing in Phu Tho province ... 153
5.2.2.1 Marketing channels for tea products ... 153
5.2.2.2 Tea prices among farmers’ groups ... 157
5.2.2.3 Farmers’ satisfaction with tea marketing activities... 157
5.2.2.4 Influence of contract farming on the tea value chain in Phu Tho province, Vietnam ... 164
5.3 Factors affecting tea contract farming in Phu Tho ... 168
5.3.1.1 At the farmer side: ... 168
5.3.1.2. At the company side ... 172
5.3.2 External factors ... 175
5.4 Advantages and disadvantages of tea contract farming in Phu Tho province ... 178
5.4.1 Advantages of tea contract farming in Phu Tho province ... 178
5.4.2 Disadvantages of tea contract farming in Phu Tho ... 180
6. CONCLUSIONS AND IMPLICATIONS ... 186
Conclusions ... 188
Implications ... 193
REFERENCES ... 200
Figure 2.1. World’s tea growing areas from 2005 to 2014 (1000 ha) ... 10
Figure 2.2. Tea areas of major tea producing countries in 2014 (1000 ha) ... 11
Figure 2.3. Tea production volume in the world from 2011 to 2015 (1000 tonnes)... 13
Figure 2.4. Maijor tea producers in the 2014... 13
Figure 2.5. Exports of major tea producers in 2014 (1000 tonnes) ... 15
figure 2.6. Tea export volume in the world from 2011 to 2015 (1000 tonnes) ... 16
Figure 2.7. Tea imports of big importing countries in 2013 (1000 tonnes) ... 17
Figure 2.8. Tea imports in the world from 2000 to 2013 (tonnes) ... 17
Figure 2.9. World’s tea prices in july from 2007 to april 2017 (usd/kg) ... 17
Figure 2.10. World’s tea prices from 2013 to 2016 (usd/kg) ... 17
Figure 2.11. Tea plantation in vietnam ... 26
Figure 2.12. Tea harvested areas from 2005 to 2015 in vietnam (1000 ha) ... 26
Figure 2.13. Tea production in vietnam from 2010 to 2015 (1000 tonnes) ... 27
Figure 2.14. Vietnam’s tea export from 2010 to 2016 ... 30
Figure 2.15. Vietnam's top 10 tea import markets in 2016 ... 30
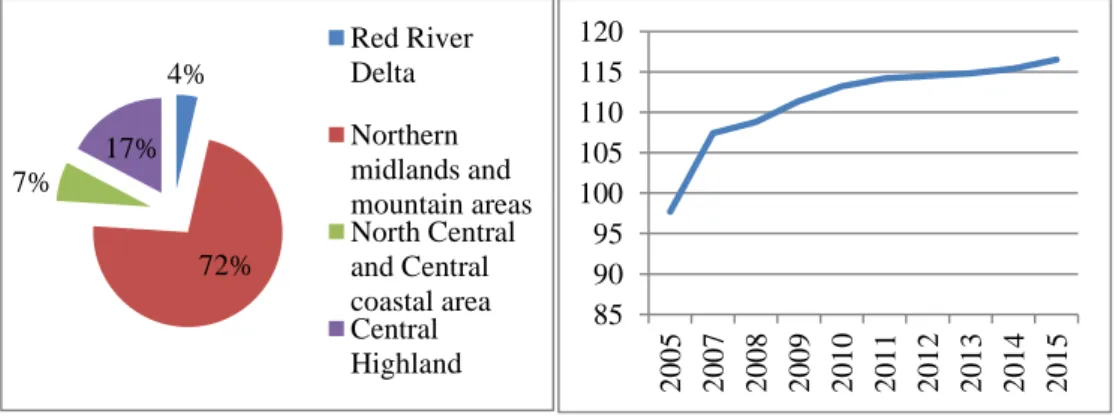
Figure 2.16. Land area of phu tho province (%) ... 36
Figure 2.17. Tea land area in phu tho province (1000 ha) ... 36
Figure 2.18. Fresh tea production in phu tho province (1000 tonnes) ... 36
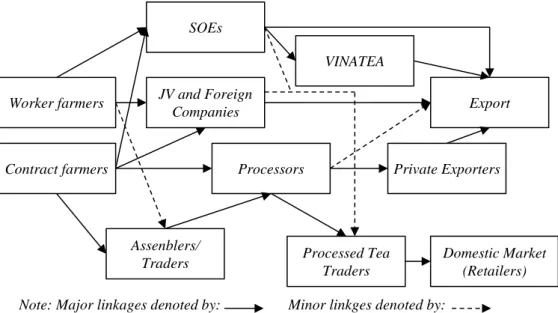
Figure 2.19. The marketing channel for workers and contract farmers (adb, 2004) ... 39
Figure 2.20. Marketing channel for unlinked farmers (adb, 2004) ... 40
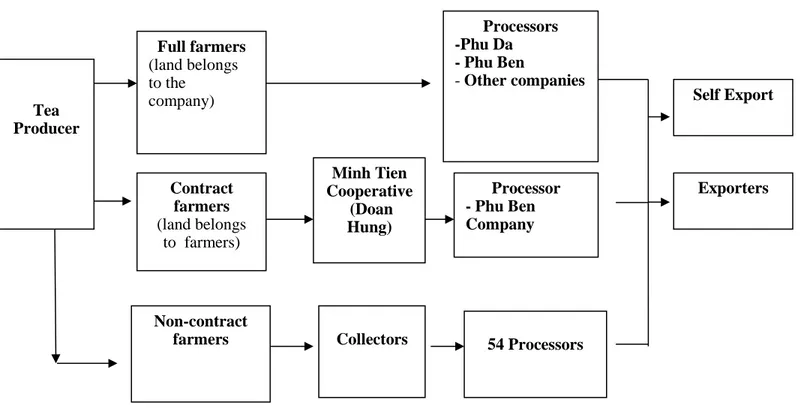
Figure 2.21. Tea value chain in phu tho province ... 42
Figure 2.22. Black tea value chain in phu tho province ... 43
Figure 4.1. Analytical framework of the study ... 86
Figure 4.2. Internal factors affecting tea contract farming ... 87
Figure 4.3. External factors affecting tea contract farming ... 89
Figure 4.4. Study sites ... 92
Figure 4.5. Cost and return analysis ... 98
Figure 5.1. Full contract farming model ... 110
Figure 5.2. Semi contract farming model ... 111
Figure 5.3. Tea channels in phu tho province ... 112
Figure 5.5. Farmers’ satisfaction of pesticide quality in 2014 ... 150
Figure 5.6. Farmers’ satisfaction of input prices in 2014 ... 151
Figure 5.7. Farmers’ satisfaction of the convenience in buying inputs in 2014 ... 151
Figure 5.8. Farmers’ satisfaction of late payment for materials in 2014 ... 152
Figure 5.9. Farmers’ satisfaction of technical training in 2014 ... 153
Figure 5.10. Marketing channels for black tea in phu tho province ... 156
Figure 5.11. Fluctuation of fresh tea prices by farmer groups in june from 2014 to 2016 ... 157
Figure 5.12. Farmers’ satisfaction of outlet stability in 2014 ... 158
Figure 5.13. Farmers’ satisfaction of the stability of fresh tea prices in 2014 ... 160
Figure 5.14. Farmers’ satisfaction of reasonable prices of fresh tea in 2014 ... 162
Figure 5.15. Farmers’ satisfaction with buyers’ payment in 2014 ... 163
Figure 5.16. Costs and benefits of actors in the black tea value chain in Phu Tho in 2014 ... 165
Table 2.1. World’s tea growing areas by continents (unit: ha) ... 9
table 2.2. Vietnam’s tea producing areas and production from 1986 to 2015 ... 26
Table 2.3. Vietnam’s tea export growth ... 30
Table 2.4. Tea domestic consumption in vietnam from 2011 to 2015 ... 32
Table 4.1. Sample of the surveys ... 93
Table 4.2. Sampling in group discussion in phu tho province ... 95
Table 4.4. Analysis of cost and benefit of collectors in the black tea value chain ... 98
Table 4.5. Analysis of cost and benefit of processors in the black tea value chain ... 99
Table 4.6. Indicators for the comparison between tea production outcome and economic efficiency ... 99
Table 4.7. Indicators for outcome and economic efficiency of farmers ... 100
Table 5.1. Types of contract farming in phu tho province ... 109
Table 5.2. The specifications of full cfs and semi cfs ... 113
Table 5.3. Characteristics of the surveyed tea farmer groups in phu tho province ... 114
Table 5.4. Information on tea producing households by groups in phu tho province ... 116
Table 5.5. Household agricultural land area in 2014 ... 118
Table 5.6. Distribution of tea land area by farmer groups in phu tho in 2014... 118
Table 5.7. Loan for tea production by farmer groups in 2014 ... 119
Table 5.8. Farmers’ access to credit in tea production by farmer groups in 2014 ... 120
Table 5.9. Evaluation of tea farmers on difficulties in accessing credit in 2014 ... 121
Table 5.10. Labor use in tea production by farmer groups in 2014 (unit: days) ... 121
Table 5.11. Tea production machines by farmers’ groups in 2014 (unit: pieces/household) ... 123
Table 5.12. Tea production machines by farmers’ scale in 2014 (unit: pieces/household) ... 124
Table 5.13. Investment costs per one ha in 2014 ... 124
Table 5.14. Plantation area by tea varieties of different farmer groups in 2014 (unit: %) ... 130
Table 5.15. New tea growing areas by varieties in 2014... 131
Table 5.16. Tea yield by variety of farmer groups in 2014 (unit: tonnes/ha) ... 132
Table 5.17. Plantation area by tea age of different farmer groups in 2014 (unit: %) ... 133
Table 5.18. Classification criteria for fresh tea materials in vietnam ... 134
Table 5.19. Frequency of participation in the tea technical training course by farmer groups in 2014 (tc) (unit: percentage) ... 136
Table 5.20. Farmer’s evaluation on the usefulness of technical training in 2014 ... 139
(unit: percentage) ... 139
Table 5.21. Tea yield by farmer groups in 2014 ... 139
Table 5.22. Ranking of factors affecting tea yield in order of importance in 2015 ... 141
Table 5.23. Tea production costs in 2014 per ha ... 142
Table 5.25. Economic analysis of tea production from 2013 to 2014
(unit: mil.vnd/ha)... 145
Table 5.26. Performance of tea production by farmer groups in 2014 ... 146
Table 5.27. Household income in 2014 (unit: mil.vnd) ... 148
Table 5.28. Benefits of contract farming for full contract farmers ... 168
Table 5.29. Benefits of contract farming for semi contract farmers ... 169
Table 5.30. Benefits of contract farming for non-contract farmers ... 169
Table 5.31. Full contract farmers’ evaluation of the disadvantages of contract farming (unit: percentage) ... 180
Table 5.32. Semi contract farmer’s evaluation of the disadvantages of contract farming (unit: percentage) ... 183
Box 5.1: Perception of farmers about contract farming ... 170
Box 5.2: Influence of scale production on contract farming ... 171
Box 5.3: Influence of farmers’ group of on contract farming ... 171
Box 5.4: Demands for processing materials of the tea companies: ... 172
Box 5.5: Capacity in looking for markets of processing and exporting companies. ... 173
Box 5.6: Demand for big capital of companies participating in contract farming ... 173
Box 5.7: Demand for contract enforcement ... 174
ADB Asian Development Bank
AFTA ASEAN Free Trade Area
ASEAN Association of Southeast Asian Countries
BTH Borelli Tea Holdings
CF Contract farming
CFs Contract farmers
DARD PT Department of Agriculture and Rural Development of Phu Tho province
EC European Commission
EU European Union
Euro GAP European Good Agricultural Practice FAO Food and Agriculture Organisation
GAP Good Agricultural Practice
GCO General Custom office
GO Gross Output
GSO General Statistics Office
HACCP Hazard Analysis and Critical Control Points
HH Household
HHH Household heads
HVF High value food
IC Intermediate Cost
ISO International Standard Organization
ITC International Tea Committee
M4P Making market systems work better for the poor MARD Ministry of Agriculture and Rural Development mil.VND Million Vietnamese dong
MPI Ministry of Planning and Investment
NGOs Non Government Organizations
NIC New Industrial Countries
OTD Orthodox
PB Phu Ben (company)
PD Phu Da (company)
Per. Percentage
PTSO Phu Tho Statistics Office
Sao Sao = 360 m2
SOE State-owned enterprises
TC Training course
UNCTAD United Nations Conference on Trade and Development
US United States
USD United States Dollar
VA Value added
VBARD Vietnam Bank for Agriculture and Rural Development (VBARD) VBSP Vietnam Bank for Social Policies (VBSP)
VietGAP Vietnamese Good Agricultural Practices VINATEA Vietnam National Tea Corporation
VITAS Vietnam Tea Association
VND Vietnamese Dong
1
1.1 Background and rationale
Vietnam, especially the mountainous and midland areas of the country, has many favorable conditions to develop tea production and marketing. Moreover, tea industry has remarkably contributed to job-creation and revenue generation for tea producers. In addition, it also greatly assists farmers in the national hunger eradication and poverty alleviation (VITAS, 2016). In 2014, over 130,000 tonnes of tea valuable approximately 230 million US dollars was exported outside Vietnam. Approximately 3 million Vietnamese gain their livelihood on tea through over 400 businesses involved in production, processing, and export. In Vietnam, tea export accounts for 75-77% of the total production and 23-25% for domestic consumption (GSO, 2015). In the structure of exported tea, black tea now makes up about 53%; while green tea and the other types account for the remaining proportion (GSO, 2014). The total tea plantation area of the Northern mountainous province is 97,300 hectares, making up 72% of the country. There are several provinces which have large tea areas including Thai Nguyen, Ha Giang, Phu Tho, Yen Bai, Nghe An, Tuyen Quang, and Son La (GSO, 2015).
However, Vietnam’s tea export still remains relatively low as compared to other countries. The export price is only about $ 1,500 per metric ton which is half of the world’s average price. In addition to that, the tea exporting market of Vietnam has not remained stable. One of the most important reasons for that is the poor quality management in tea production and export, especially in food safety issues. The tea quality so far is still keeping Vietnam’s tea industry far away from reaching global markets’ standards (VITAS, 2015). The main reasons lie in the fact that a large number of tea companies have just been established and tea processing capacity increased quickly whereas regions of providing raw materials did not increase correlatively, which led to buying strong competition among companies in buying materials, procured products were not correct with their ranks that reduced quality of fresh shoots, speeded up the price and increased production expenses and costs and affected on processed tea quality (MARD, 2015). On the other hand, the rank of Vietnam’s tea has not been high, mainly used for raw materials of processing types of tea. The tea exporting increased but tea products have not been plentiful. Experts in the tea industry said that tea products of Vietnam for exporting are mainly under the type of raw products, processed tea products are so monotonous and not plentiful about types, design and there are few green tea products which left its impressions to consumers on both design and quality. A good variety does not necessarily bring about high yield and quality tea for the regions. This is a popular situation in many areas of the country because of unqualified land for tea plantation, lack of investment, weak management together with new trees cultivation not meeting technical requirements. Additionally, currently, there is weak cooperation between various stakeholders involved in the tea value chain.
Due to small and scattered tea areas and lack of capital, farmers do not find much motivation to totally focus on their tea production. Besides that, the price of black tea not only is low but also fluctuated considerably, leading to the low price of fresh tea leaves and the corresponding unstable outlet. Moreover, the increase of input prices leads to a decrease of farmers’s profit. It seems apparent that currently, tea
farmers face many difficulties and are highly vulnerable. They could easily come to the decision of destroying their tea garden once they found it unable to overcome these difficulties. That means a low competitiveness of Vietnam’s tea industry in comparison with other tea growing countries in the world. If the farmers establish a collaboration relationship with tea companies, they can enjoy the benefits of various types of supports such as ensured inputs and outlet. The closer the cooperation between the farmers and the company become, the more competitiveness tea value chain would be.
Contract farming has been applied for a long time, especially for the perishable agricultural commodities that need to be processed, such as vegetables, fruits and dairy (Bijman, 2008). Its applicability and necessity as a rural development tool has been recognized and discussed in many empirical studies in the context of its role in linking producers with agricultural markets, especially in the developing countries. For farmers, contract farming also brings numerous opportunities, including access to a reliable market and guaranteed and stable pricing structures; and most importantly, access to credit, inputs, production and marketing services (seedlings, fertilizers, training, extension, transport, and even land preparation).
In Vietnam, the Prime Minister issued Decision No. 80/2002/QD-TTg on policies to encourage the contractual sale of commodity farm produce in the year of 2002. The State encourages enterprises of all economic sectors to sign contracts on sales of commodity farm produce with producers to match production, processing and consumption of commodity farm produce to keep production development steady and constant. The contracts, after being signed, will help not only to ensure the responsibilities and obligations of the parties, but also to protect the rights and legitimate interests of the raw materials producers and the production, business, processing and exporting enterprises. The Decision No.80 brought about a positive impact on the economy including various sectors from agriculture to forestry and fishery. There have been various studies of contract farming from the international supporting organizations, which can be found in Asian Development Bank (ADB, 2005). They involve contract farming examples in Vietnam with specific classifications on the sizes and kinds of goods contracts. ADB (2005) suggested the multipartite model as the most effective way to ensure the benefits to farmers. To better understand the effectiveness of the contract farming, Saigenji and Zeller (2009) took an examination on production and income of tea farmers in north-western Vietnam, and found out that thanks to contract farming, the technical efficiency and income level have been increased. Nham (2012), Nguyen (2014), and Pham (2015) showed that contract farmers highly appreciated the benefits obtained from contract farming, including the company's technical guidance and advanced input support. In addition, Nham (2012) indicated that contract farming increased the access to farmer empowerment (technical and managerial skills). Moreover, good cooperation and ability to organize between farmers are also crucial since it would help to reduce the transaction costs for both contractee and contractor. Additionally, market certainty is another vital benefit of the contract. Jagdish Kumar (2008) reported that contract farmers obtained higher, almost double income in comparison with non-contract farmers. This finding is confirmed by Giel Ton et al.
(2017). Similarly, Dong et al. (2014) found out that formal contract had positive impact on total monthly gross margin (GM) of swine production.
Phu Tho province is one of the top five largest tea areas and also ranks among the top four tea producing provinces in Vietnam that has traditionally been exporting black tea to overseas markets (80% of tea in Phu Tho is black tea to export). Tea growing position was confirmed on the midland region. Tea products are exported to many countries around the world (Phu Tho DARD, 2016). The total tea production area of Phu Tho was 7,893 ha ten years ago, corresponding to 43.5 thousand tons output. In recent years, tea production has become the major agricultural program. At the end of 2015, the total area of the province had risen up to 16,584 ha accounting for more than 12% of the whole country. This brought the province to the 5th place in terms of tea production area of the country. The provincial output has reached 154,753.3 tonnes of tea leaves (Phu Tho DARD, 2015). Like other major provinces that have black tea processing sector in Vietnam, the scale of tea production in Phu Tho is small and dispersing, leading to the fact that fresh tea quality is uneven and difficult to control. Tea farmers for profit has increased the use of pesticides and chemical fertilizers to increase yield, causing poor quality material tea, which then affected quality of the final black tea products.
In general, all of the above analysis presents that contract farming brings numerous benefits for farmers. In the above context of tea production in Phu Tho province, and until now, there has been, however, no thorough research in tea contract farming in Vietnam in general and in Phu Tho in particular to answer the following question: “Will tea farmers who have contract with companies obtain higher income in comparison with non contract farmers?”
This thesis entitled “Contract farming as a determinant promoting tea production and marketing at farm household in Vietnam: a case study in Phu Tho province”, therefore, aims to analyze the efficiency of tea contract farming in Phu Tho province, and identify whether contract farming helps to improves income of tea farmers.
1.2 Research objectives and Questions
1.2.1 Research objectivesa. General objective
The general objective of the study is to analyze the efficiency of contract farming as a determinant to promote tea production and marketing in Phu Tho province by improving farmer’s income.
b. Specific objectives
- To identify the types of tea contract farming in Phu Tho province
- To analyze economic efficiency of different types of tea contract farming in Phu Tho province
- To analyze the influence of contract farming on tea marketing in Phu Tho province
- To identify the factors that affect tea contract farming in Phu Tho province - To propose relevant policy implications to promote the tea production and marketing through contract farming in Phu Tho province
1.2.2 Research questions
1. Does contract farming improve the tea households’s income? 2. Does contract farming enhance tea marketing channel?
3. What are the factors that affect tea contract farming in Phu Tho province?
1.3 Research hypotheses
- Contract farming promotes tea production by enhancing income of contract farmers in Phu Tho province;
- Contract farming promotes tea marketing channel by enhancing the stability of selling price and market for contract farmers and improve the linkage between farmers and processors in Phu Tho province;
- Socio-economic factors affect tea contract farming in Phu Tho province.
1.4 Scope of the study
This study only focuses on studying black tea which occupies 80% of Phu Tho tea export. Black tea has continued to be one of the highest valued commodities which brings high income for tea producers in Phu Tho. In other words, this study does not focus on studying the production and marketing of green tea in Phu Tho province.
The major concentration of this study is to improve benefits for tea farmers who are the most vulnerable actor in the chain.
This study conducted the sample in the communes that have both contract farmers and non-contract farmers in order to compare the two groups in similar conditions in terms of regions, economics, and society, etc.
In the study site, there was only a group signing contract in a fairly stable manner with Phu Ben Tea Company, which was Minh Tien Cooperative in Minh Tien commune, Doan Hung district. The leader of the Cooperative signed a written contract with Phu Ben Tea Company, a moderately close integration.
However, we will analyze this model in order to find out what encouraged farmers to participate in this contract farming and examine the factors that affect contract farming on tea production and marketing in Phu Tho province.
1.5 Thesis structure
This thesis is organized as follows. Chapter 1 provides the research background and rationale for the study. Moreover, this first chapter also includes research objectives, research questions, and scope of the study as well as structure of the research. Chapter 2 mainly focuses on the tea industry in three different contexts, including worldwide, in Vietnam, and in Phu Tho province. Following that, Chapter
3 presents a short overview of the related literature, while Chapter 4 describes the research methodology employed in this study. Chapter 5 includes the survey results and analysis of the current tea contract farming in Phu Tho province. Finally, main findings and implications are presented in Chapter 6.
2
The context of tea
2.1 Tea production in the world
Tea (Camellia sinensis) was first cultivated approximately 2000 or 3000 years ago, in South East China (Eden, 1976). Tea is a perennial crop which can be grown in tropical or sub-tropical environments. Tea was first consumed in South and South East Asian cultures, and later spread all over the world. In the last century, the increasing demand in the European countries has further pushed up the production in South Asia and some parts of Africa (Innocent Awasom, 2011).
Different countries produce different quantity of tea based on a number of factors such as tea varieties, agro-ecological characteristics of those countries (climate and soil type) as well as the production scale (den Braber et al., 2011). Apparently, weather is the main factor for a successful tea crop (Wijeratne, 1996). Some researchers have identified that increasing temperatures (up to 25-260 C) improves crop yields (Carr and Stephans, 1992; and Wijeratne, 1996). Ideal conditions for tea growth are temperate (15-30o C), high rainfall of 1,500 – 2,000 mm of even distribution during the year, air and land humidity of 70 - 80% lasting for several month, and height of 500 – 1000 m, with the highest of 2000 m (FAO, 2015).
Tea exports represent a considerable proportion of economy of many countries in Asia and Africa, providing employment for over 13 million people around the world (Jason Potte et al., 2014). The tea industry is growing at a rate of about 5% per year on average (FAO, 2017). The industry is facing many issues which becoming increasingly complicated. According to the Intergovernmental Group on Tea (IGG) under the Food and Agricultural Organization of the United Nation, approximately 60% of the total world tea production is produced by smallholders (FAO, 2016), corresponding to about 8 million farmers in Asia and Africa (Ethical Tea Partnership, 2016).
Drinking tea is a tradition in many countries in the world such as Japan, China and Vietnam. Tea has becomes so important for people around the world; in fact, two thirds of the world population chooses tea as a daily beverage (Vo, 2006).
2.1.1 World tea growing areas
Table 2.1. World’s tea growing areas by continents (Unit: ha)
Regions 2010 2011 2012 2013 2014 Africa 295,443 303,283 318,818 360,563 378,767 American 43,975 43,688 44,791 41,735 41,618 Asia 2,799,995 3,047,841 3,137,059 3,209,661 3,374,973 Europe 1,558 1,346 432 596 619 Australia 4,207 3,946 3,871 3,858 3,855 World 3,145,178 3,400,104 3,504,972 3,616,412 3,799,831 Source: FAO (2015)
As can be seen from Table 2.1, in 2014, Asia made up nearly 89% of the global tea area, followed by Africa with over 9%. The mere remaining proportion was located in America.
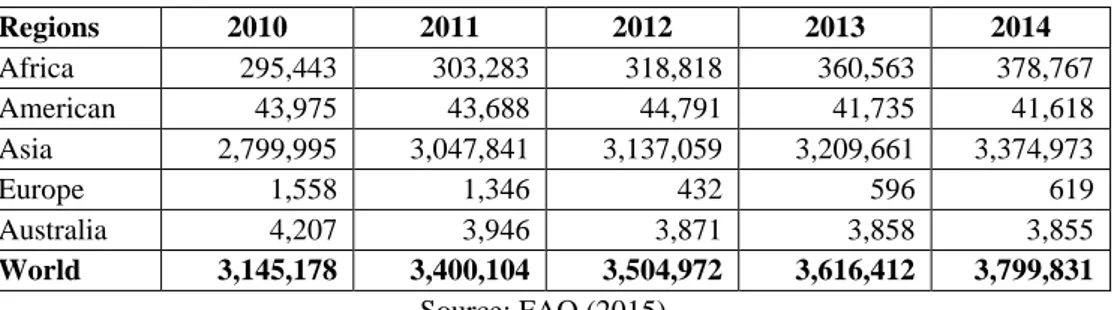
Figure 2.1. World’s tea growing areas from 2005 to 2014 (1000 ha)
Source: FAO, 2017
Although tea is grown in over 50 different countries, among which around 5-10 countries have an insignificantly small tea areas and outputs. Tea is mainly grown in developing countries, and tea output is mainly originated from the world’s biggest tea producers, including China, India, Kenya, Sri Lanka, Turkey and Vietnam.
According to the figures released by the FAO (2015), the total world’s tea area is estimated to be around 3.8 million ha in 2014, and the total world’s tea output is around 5.5 million tonnes, increased by 1.1% and 1.15%, respectively compared to 2009 (Figure 2.1). During the period from 2001 to 2010, the average growth rate of the world’s tea area was 2.7% per year, while that of the world’s tea output was 3.9% per year. Overall, both the world’s tea area and output have experienced a fairly steady growth and an upward trend during the last decade.
However, the tea volume growth depending on expansion of tea area shall be limited in the next decade because the land resources have become increasingly scared and farmers in the world have switched to more profitable production and business activities. The top eight countries with the largest tea areas in the world are China, India, Sri Lanka, Kenya, Vietnam, Indonesia, Japan, and Turkey, accounting for almost 89% of the world’s total tea area. China has been maintaining the position of the world’s biggest tea grower, accounting for up to 52% of the world’s total tea area in 2014 (Figure 2.2). 0 1000 2000 3000 4000 2005 2006 2007 2008 2009 2010 2011 2012 2013 2014
Figure 2.2. Tea areas of major tea producing countries in 2014 (1000 ha)
Source: FAO, 2014
2.1.2 Black tea products Types of tea
Tea can be basically classified into Green, Black or Oolong tea depending on the way that the same basic tea leaf (camellia sinensis) is manufactured. Black tea is the type of tea that predominates in the West. It involves the most processing, including withering, crushing and rolling, and then heating and drying. The manufacture of green tea differs from black in that the withered leaf is steamed and rolled before drying or firing, avoiding the fermentation stage. Oolong tea is, on the other hand, semi-fermented.
The vast majority of the tea trade in the world market is black tea which can further be divided into two main categories, including Orthodox and CTC tea. Orthodox tea is made by rolling the withered leaf under light pressure to create a twisted, wiry appearance in the final product. This is the traditional method for making tea and specialty teas like Darjeeling are usually made in this way. For CTC tea, the withered leaf undergoes the “Crush, Tear, Curl” process, whereby it is shredded and then crushed between sets of grooved rollers to produce a small granular final product. This method revolutionized tea manufacture when it was introduced as it yielded double the cup page per weight and it is ideally suited to tea bags (Adapted from Oxfam, 2002).
Processing of black tea
The main stages of black tea processing procedure include: Withering; Rolling; Roll-breaking (or green leaf sifting); Fermentation (oxidation); Drying (firing); Sorting (grading); and Packing and marking for sale or shipment (Hicks 2001).
After being harvested black tea leaves are dried up by air. After that, they can be processed either by CTC (Crush, Tear, Curl) or by Orthodox methods. A CTC method is generally used for lower quality leaves, which are used to make tea bags and make decent quality products. Meanwhile, Orthodox processing is employed for higher quality tea leaves for the specialized consumers; this processing can be done by machines or by hand. The next step is oxidation (or “fermentation”) under a certain temperature and humidity; the time between these stages plays an important
0 500 1000 1500 2000
role because how much oxidized the tea is will affect its quality. Tea-producers then use hot air to lock the oxidation process. Finally, sieves are used to classify tea leaves based on their sizes and tea leaves then are classified into: whole leaf, brokens, fannings and dust. They can also be further classified based on other criteria before being packed into packages (Hicks, 2009).
Black tea quality classification
Black tea is often classified based on a four-scale grading of quality which includes whole leaf teas, broken leaves, fannings and dusts (in the order from the highest to lowest quality). As can be told from its name, whole leaf teas are the tea which are produced in a way so that the tea leaf is preserved to the best possible extent, thus is the most valuable. It is even more precious if they still retain leaf tips.
Broken leaves are the loose tea leaves with average quality, while the smaller broken leaves can be used to make tea bags. Fannings, the smaller particles produced from the making of large tea leaves, can be used for the manufacture of bagged teas. Finally, dusts are the smallest pieces of tea which remains from the production of these above tea varieties. Dusts are generally used for making tea bags. These tea bags are fast and easy to be brewed because dusts are more easily diffused in water than the other tea varieties. Lower quality leaves such as fannings and dusts are quickly brewed, thus have a stronger flavor and darker color, but are not as sweet as the other high-grade varieties (Hicks, 2009).
Black tea grading
The classification is done either by hands or by passing the leaves though sifters with graduated mesh sizes to separate them out. The resulting piles of tea are then classified according to size, type and appearance. The method given by the International Standard Organization provides a classification of tea according to their particle size distributions; ISO 11286:2004: Classification of grades by particle size analysis (UNCTAD, 2016).
Tea quality standards
Despite being the most popular drink in the world, there are no internationally valid regulations on tea, however some guidelines do exists such as CODEX, or regional regulations (EU) and national regulations. For exporting countries, they adopt ISO standard as well as national standards, which do not vary too much from country to country.
It is very important for exporting countries to adhere to national and foreign standards, as well as regulations on food safety and quality. Only when their products meet those qualities, can they be exported to other countries for consumption. ISO 3720 has been widely adopted in many countries to regulate tea quality despite only voluntary (UNCTAD, 2016).
2.1.3 World’s tea production
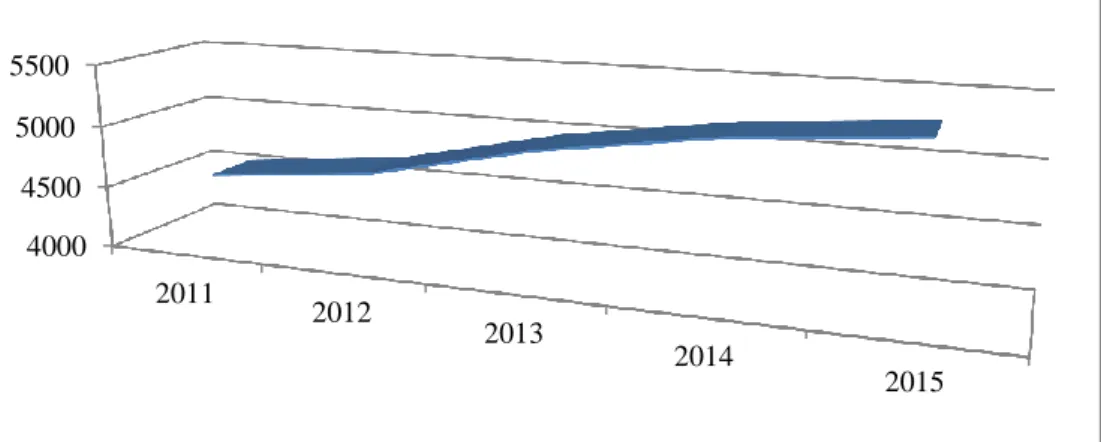
Due to the increasing demand for tea in the global market, there has been an increase in tea production. The world tea production reached 5,305, 000 tonnes in 2015 (Figure 2.3). Even though tea is produced in fifty countries worldwide, the majority (about 75%) of the global production is contributed by a few countries,
namely China, India, Sri Lanka and Kenya. Other major tea producers can be listed as Turkey (4%), Vietnam (4%) and Indonesia (3%).
Figure 2.3. Tea production volume in the world from 2011 to 2015 (1000 tonnes)
Source: Cyclope, 2017
Tea production has increased quickly over the last ten years. In 2014, the total tea production in the world reached 5,196 tonnes. Chinese tea production accounted for 38% of the international tea market, and those figures of India, Kenya, Sri Lanka and Vietnam were 22%, 8%, 6% and 4%, respectively. Looking at market share, Asian countries made up 85% of the total world market, followed by African countries with 13% and South American countries with 2% (Cyclope, 2017) (Figure 2.4).
Figure 2.4. Maijor tea producers in the 2014
Source: Cyclope, 2017
Tea production increased in 2016 and was estimated to continue to rise at a growth rate of 2% per year. Kenya and Sri Lanka are the world’s biggest exporters of black tea. China, the largest tea producer in the world, also reported an increase in production, with a predicted growth of 3% in 2015. However, this growth was
4000 4500 5000 5500 2011 2012 2013 2014 2015 China 38% India 22% Kenya 8% Srilanka 6% Vietnam 4% Turkey 4% Indonesia 3% Others 15%
slower than expected due to period of bad weather and cold temperatures at the beginning of the year, which resulted in serious damage to tea crops (Worldteadirectory, 2017). China is the leading tea producer in the world. In 2015, its production reached 2249 thousand tonnes, increased by 7.3% as compared with and 10% in d with 2014. Its production then increased to 2397 thousand tonnes, increased by 6.6% as compared with the previous year. The country’s tea exports went up significantly by 8.9%, 7.5% and 10.3% in 2014, 2013, and 2012, respectively. Since the beginning of the year 2017, Chinese Ministry of Agriculture has started a campaign of reducing the use of chemical fertilizers and encouraging the use of organic fertilizers for tea production. The ministry’s objective is to reduce chemical fertilizers by 50% in the coming years (Cyclope, 2017).
Despite accounting for up to 52% of the world’s total tea area, China’s tea output of accounts for only 37.7% of the total world output. Meanwhile, India – the second biggest tea producer is home for just 16% of the world’s total tea area, but its tea output makes up nearly 22% of that of the world. It is mainly resulted from the difference in the tea yield among the world’s largest tea producers (FAO, 2015).
Indian tea is recognized all over the world thanks to their unique aromatic flavor. There are three special teas produced by the country which are exported around the world, including Darjeeling Assam, and Nilgris, In addition to that, there are also other varieties produced such as organic and green tea but only in insignificant amount. Tea is mainly grown in Assam, Kerala, Tamil Nadu and West Bengal, accounting for about 95% of the total production. In India, the tea industry provides jobs to a large number of women. The tea cultivation is not only for economic production but also plays the role of social institution for Indian residents (Sukhin Chawlaa* et al., 2016). India is the second largest tea producer, behind China (the leading green tea producer) in the world. India is the leading black tea producer over the world, and also a big consuming market, with a 3% increase in black tea consumption every year. According to India Tea Board, since 2013, Indian tea production has been always higher than 1200 thousand tonnes. The tea production in 2016 reached 1239.2 thousand tonnes, equivalent to a 2.46% increase compared to 2015, which is the peak production level during recent years (Cyclope, 2017).
Kenya is the third largest tea producing country in the world, behind India and China, and the main exporting country of black CTC tea. Kenya’s tea production in the year 2015 went down by 10.3% (Cyclope, 2017). In contrast, growth in Kenya continued in 2016, to create this shortage. Total production was predicted to rise by 10-15% to up to 450 thousand tonnes, thanks to thick rain establishing for ideal cultivating conditions (Worldteadirectory, 2017).
In 2015, Sri Lanka’s production also dropped by 2.7% as compared with the previous year (Cyclope, 2017). In August 2016, tea volume decreased by 13% from 2015, the lowest figure in ten years. This had a knock-on effect of rising prices which was resulted from lower supply. Tea production in Sri Lanka and India declined because of dangerous dry weather (Worldteadirectory, 2017).
2.1.4 Tea trade in the world
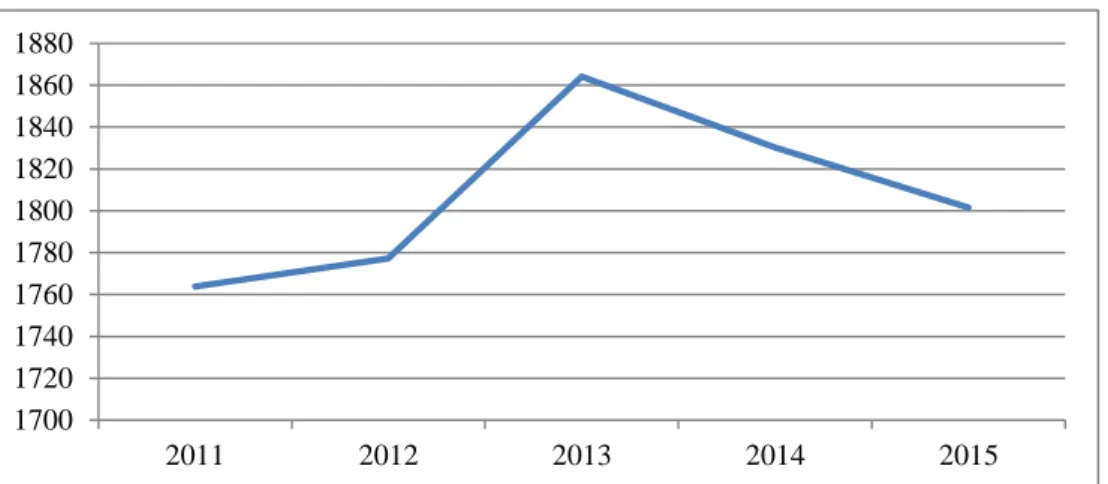
During the last decade, the total exporting tea volume in the world has increased by an average growth rate of 3% per year and its value has increased by approximately 9% per year. It indicates that like other agricultural products’ price, the tea price also experienced an increase over the period from 2001 to 2013. In 2013, total tea export volume in the world reached 2.05 million tonnes with the total value of about USD 7.5 billion (FAO, 2017).
According to UNCTAD (2016), tea export plays a crucial role in government earnings (in terms of foreign currencies and taxes), revenues and employment for agricultural sectors and households to exporting countries. The two main types of tea traded in the world market are black tea and green tea. Black tea is mainly grown in and exported by Kenya and Sri Lanka, while green tea is primarily grown and consumed by China.
Recently, because of the impacts of global economic crisis, there has been a shift of consumption direction from the expensive drinking products like cacao and coffee to the average standard products like tea. Therefore, the tea industry will have a higher potential market in the near future.
Despite the impacts of climate change, producers have been striving to reach high production volume. The relative stability of tea price in recent years is an important factor in supporting the development of tea production, especially in the countries that have large tea production areas like China, India and Vietnam. The leading exporters in the world include Kenya, China and Sri Lanka, which together attribute to 61% of the world tea exports in 2014 (Cyclope, 2016) (Figure 2.5).
Figure 2.5. Exports of major tea producers in 2014 (1000 tonnes)
Source: Cyclope, 2016.
The six biggest tea exporters, including Kenya, Sri Lanka, China, India, Argentina and Vietnam together accounted for approximately 82% of the world’s total tea export turnover. Because most of the current main tea producers are also the main tea consumers in the world, despite the high concentration of exporters, importers have been rather scattered (Nguyen, 2016). Kenya was the largest worldwide tea exporter in 2015, making up 25% of all exports, which was followed by China and Sri Lanka at 18% and 17% respectively. India accounted for 12% of the world
100 200 300 400 500
exports, with Vietnam, Indonesia, Uganda, and other countries making up the rest (Cyclope, 2016).
Figure 2.6. Tea export volume in the world from 2011 to 2015 (1000 tonnes)
Source: Cyclope, 2017
Sri Lanka’s tea export volume dropped in 2016, a decrease of 20% to 289 thousand tonnes in which 286.1 thousand tonnes (about 99%) was black tea and only 3.0 thousand tonnes was green tea. A majority of Sri Lanka’s tea was Orthodox black tea. According to Sri Lanka Tea Board, the main causes of the decline in tea production were unfavorable weather conditions and the lower use of fertilizers and pesticides due to the government policies (Cyclope, 2017).
India ranks fourth in tea exporting, after Sri Lanka. Indian exports in 2016 declined by 5.2% compared to 2015, reaching 216.79 thousand tonnes. Their main exporting markets include Russia (accounting for 20.4% of the total exports), Iran (10.5%), UAE (7.7%) and Germany (4.7%). There is a competition between Indian tea and Kenya’s tea in Indian traditional markets such as England and Iran. Kenya’s tea exports reached 420.5 thousand tonnes. In 2015, which means a decrease of 60 thousand tonnes. However the export value increased since it exported most of its black CTC tea to Pakistan (Kenya Central Bank, 2015).
According to Ian Gibbs, Chairman of the International Tea Committee (ITC), the proportion of tea crop available for export kept on falling. In 2006, the percentage of tea produce exported was 43%. Since then, that percentage has been declining every year. In 2015, only 34% of the total tea produced was exported, corresponding to a majority (66%) of tea consumed within the producing countries (Dan Bolton, 2016). Tea export volume decrease due to high domestic consumption in the largest producing countries. For instance, India currently consumes about 19% of the world’s tea but is expected to become a key importer by 2017 and beyond due to their decreasing yields (Worldteadirectory, 2017).
1700 1720 1740 1760 1780 1800 1820 1840 1860 1880 2011 2012 2013 2014 2015
Figure 2.7. Tea imports of big importing
countries in 2013 (1000 tonnes)
Source: Cyclope, 2016
Figure 2.8. Tea imports in the world from 2000
to 2013 (tonnes)
Source: FAO, 2017
The world’s six biggest tea importers, namely Russia, the United Kingdom, Egypt, the United States, Pakistan and UAE, accounted for about 40% of the world’s total tea import turnover. The main export markets were Russia, UK, USA, and Japan. The next important markets were Iraq and Iran with 173 thousand tonnes of tea. The tea imported volume of China increased by 11.6%, reaching 62.5 thousand tonnes; and the corresponding figure of the UK was 137 thousand tonnes (Cyclope, 2016) (Figure 2.7). During the period from 2005 to 2014, the total importing tea volume in the world experienced a steady increase FAO, 2017) (Figure 2.8).
2.1.5 Tea prices in the world
Figure 2.9. World’s tea prices in July from 2007
to April 2017 (USD/kg)
Source: International Tea Committee (ITC), 2017
Figure 2.10. World’s tea prices from
2013 to 2016 (USD/kg)
Source: World Bank, 2017
0 50 100 150 200 250 300 350 EU US A Af g h an is tan Iran C h in a Jap an Kazak h stan S u d an Uk rain e Uzb ek is tan In d ia C an ad a 0 500 1000 1500 2000 2500 2 0 0 0 2 0 0 1 2 0 0 2 2 0 0 3 2 0 0 4 2 0 0 5 2 0 0 6 2 0 0 7 2 0 0 8 2 0 0 9 2 0 1 0 2 0 1 1 2 0 1 2 2 0 1 3 1.00 2.00 3.00 4.00 5.00 ju il.-0 7 ju il.-0 8 ju il.-0 9 ju il.-1 0 ju il.-1 1 ju il .-1 2 ju il .-1 3 ju il.-1 4 ju il.-1 5 ju il.-1 6 2.5 2.55 2.6 2.65 2.7 2.75 2.8 2.85 2.9 2013 2014 2015 2016
The average price of tea in July at the auction was USD 2.64 per kilogram in 2016, according to the World Bank (Figure 2.9). Increasing labor costs and changeable weather are the main reasons behind higher prices, according to the economists. The tea sold at the auction in Colombo, Sri Lanka, remains to be the highest price in the world, averaging 420.90 USD per metric ton (4.21 USD per kilogram) for high planting, according to the International Tea Committee. The price of African tea sold in Mombasa was USD 2.39 per kilo on average of which Malawi tea priced at USD 1.68 at the Limbe auction. Average tea auctioned price in Jakarta was USD 1.73 per kilogram.
The world tea price in 2016 decreased by 4.4% as compared with 2015 (Figure 2.10). The change in tea prices of the major tea producers varied from country to country. In particular, the prices of India’s tea and Sri Lanka’s tea went up, while the prices of Kenya’s tea went down.
Because a global supply deficit and demand continues to grow, tea prices are predicted to increase in 2017 (Worldteadirectory, 2017). According to World Bank (2017), the average auction price of tea is predicted to reach USD 2.80 per kg in 2017 and increase to USD 2.81 in 2018, USD 2.83 in 2019 and USD 2.84 in 2020. The world cost of agricultural raw materials (such as fertilizers and pesticides, etc.) is projected to rise by 4%. The ongoing transformation of emerging market consumers to packaged tea products will ensure capacity growth, but the industry must consider best and improvement formats for price increases and value growth (UNCTAD, 2016). Tea prices in various markets are powerfully close to production and are affected by weather conditions, as well as many other factors.
In Kenya, prices fell during the first nine months of 2016 because of an increased production. High levels of rainfall led to an increase of tea crop up to 24% compared to 2015. Since weather conditions were less favorable and crops were delayed, tea price increased up by 30% during the second half of the year (Worldteadirectory, 2017). Kenya tea is essential in making popular grocery store brands including PG Tips, Lipton, Tetley, and Twining’s tea. Over the period from April 2016 to January 2017, there was an increase in tea prices of 13.5% on average because of the shortages resulted from a drought (Cyclope, 2017).
In Sri Lanka, tea prices decreased after the first and second harvest of the year due to an increased supply. In contrast, prices rose by 25% because of the limited supply accordingly. Dry spells throughout the rest of the year resulted in a lower yield crop (Worldteadirectory, 2017). The prices of Sri Lanka’s tea started to increase from the beginning of 2016 and continued to increase throughout the year. Sri Lanka Tea Board suggested there were two major reasons for the increase in prices, including lower supply and the devaluation of Rs compare with USD. Price rises have also been encouraged by an increase in demand, which can be possibly due to market-specific factors, such as supply shocks, which explains for most of the fluctuations in tea prices. Drought and pest production constraints have had a greater impact on prices. Any overreaction to the development of tea prices by using uncontrolled yields, especially in bringing tea into new areas, leads to significant price declines. Substantial positive change in supply can increase exports and adjust the demand and supply equilibrium, which in turn would reduce tea prices (Cyclope, 2017).
In India, the bulk tea price of Indian tea increased from USD 2.02 to USD 2.07 per kg. The price of the high quality Darjeeling tea raised from 4.21 USD to 4.8 USD, corresponding to a 14% increase (Cyclope, 2017).
2.1.6 World tea consumption
In general, tea is listed as an important component of the beverage market (Hicks, 2001) as well as functional food market (Hicks, 2001). As there is more and more competition, it is forecasted that more added-value tea products will be made to cater for sophisticated needs. The tea industry should be confident to respond to these future challenges (Hicks, 2001).
With its characteristics such as being cheap and easy to find, it seems that people of all ages and classes drink tea; they drink approximately 3 billion cups of tea a day worldwide. Nowadays, tea is considered as an important part of the beverage industry. Furthermore, tea is also used in functional food thanks to its active ingredients. Some big tea exporters of the world are located in regions such as Africa, South America, the Near East and especially Asia (Hicks, 2009). Tea is the second most prevalent beverage in the world, right behind water (Szenthe, 2015). The global tea consumption went up by 60% over the period from 1993 to 2010, and is projected to increase considerably with an increasing number of people around the world becoming tea consumers (Brouder et al., 2014).
To increase tea sales, it is important to highlight the health benefits of tea, which can only be discovered through scientific research. Some value-added market segments should receive special attention, such as the market for specialty and organic teas. To boost sales and expand markets, the production of tea products must ensure compliance with standards on food safety and quality. According to FAO (2008), applying quality standard to improve tea quality will reduce tea quantity but increase tea prices, which is only a short-term or medium-term consequence.
As mentioned above, tea is one of the most frequently-consumed beverages and also the most affordable beverage in the world. Black tea is the tea variety with the highest consumption.
Tea is considered a healthy drink thanks to a high concentration of antioxidant tea polyphenols found in green tea and black tea. Some compounds found in tea include polyphenols, alkaloids, amino acids, carbohydrates, proteins, chlorophyll, volatile organic compounds, fluorides, aluminum, minerals and trace elements. Polyphenol is one group of chemical which is attributed to the health benefits of tea. They include a group of plant chemicals named Catechins. Many people like to drink tea because the antioxidants in the tea can protect them from oxidative damage, a cause of cancer. As tea contains healthy chemicals, it has made its way into the production of supplements and functional foods.
The reason tea gains its popularity is thanks to its important health benefits. People drink teas for specific purposes such as to lose weight or to consume antioxidants or because they like their new flavors, made from new ingredients (UNCTAD, 2016).
- Black tea, in the form of bagged tea products, continues to gain more popularity in markets with high consumption of tea. This is especially true in the emerging markets.
- People who do not like coffee or caffeine or who look for occasional health benefits will look for alternatives such as fruit and/or herbal tea. This latter group presents a high value proposition.
There are a number of major factors that affect demand for tea: (i) The first factor is prices as any other commodities which have relatively small impact on tea consumption. Nevertheless, the increase in demand for tea bags and soluble instant tea means a reduction in the amount of tea needed per cup and also an increase in demand for plain cheaper tea. All of those have had led to the decline in tea prices; (ii) The second main factor directly affecting tea demand is living standard. The more improvement in living standard, the higher the demand for tea; (iii) Demography is the third factor to consider. Specifically, the development of international cities and increase in domestic tea consumption in tea growing countries as well as large population countries, especially India and China, have an influence on world tea demand as a whole; (iv) Changes in preferences and tastes also affect tea demand, especially when a group of consumers are more health conscious and pay more attention to healthy products; (v) Competing drinks such as coffee, affect tea consumption to some extent. For example, when the price of tea decreases, the consumption of tea might increase and that of coffee might reduce; (vi) Another factor influencing tea demand is advanced technologies; and finally (vii) Seasonal demand affects demand of tea. In other words, more tea is consumed during the cold season (UNCTAD, 2016).
The developed markets only account for 21% of the world’s tea consumption, while the developing market make up the remaining vast majority 79%. As reported by FAO, in 2013, the worldwide tea consumption reached 4,042.8 thousand tonnes, increased by 5.6% compared to that in 2009.
Russia, Japan, the United States and the United Kingdom are the biggest tea consumers among the developed markets. Among those markets, only Japan can provide a high tea volume for its domestic consumers thank to its domestic resources, the others mainly depend on imported tea. Russia is the biggest tea importer in the world with a total volume of 173 thousand tonnes in 2013. Although the consumers have increased their use of alcohol-free beverages, they, even those in countries with tradition of drinking tea like the United Kingdom, have gradually moved to use coffee instead. Tea consumption in the United States has been increasing, at an average growth rate of 3.3% per year during the period from 2010 to 2013. The United States is the developed market that has maintained high growths of tea consumption (Cyclope, 2016).
The United States is one of the biggest importers of tea worldwide, coming in third after Russian and Pakistan. Global consumption surpassed production and is growing at a rate of approximately 5% per year. India and China are the world’s biggest tea consumers and drive consumption mainly based on a growing population. Tea is the most prevalent beverage in the world, after water and can be found in 80% of all American consumers. In 2016, Americans drank half a pound of