Retirement incentives in Belgium
Alain Jousten, Mathieu Lefebvre
Aix, May 2011
1
Outline
Data
Matching
Incentives
SSW
OV
Distribution tabs
2
Data
SHARE:
SHARE however has limited information on career and earnings histories that are
crucial component of benefit formula
Need to find a way to match data
Ideally person-specific matches
3
Table : SHARE sample
N 822 Age Average wage 33600€ 50 12% Gender 51 13% Men 59% 52 14% Women 41% 53 12% Marital status 54 10% Married 84% 55 10% Widow 3% 56 9% Separated-single 13% 57 5% Region 58 5% Brussels 2% 59 4% Flanders 69% 60 2% Wallonia 29% 61 2% Occupation 62 2% Wage-earners 58% 63 0.5% Civil-servant 25% 64 0.5% Self-employed 17% 65 0.1%
Data
MIMOSIS, 2001
Administrative data
Useful/needed to evaluate the incentives associated with different paths
Information in MIMOSIS that we use in our pension calculator
PENSCALC
Wage-earners
Individual earnings records (CEMIRe)
Information on wages and days worked
Replacement rate (single vs. household)
Self-employed
Career: RSVZ-INASTI data and CIMIRe imputations
Pension rights: lump sum
Civil-servants
5
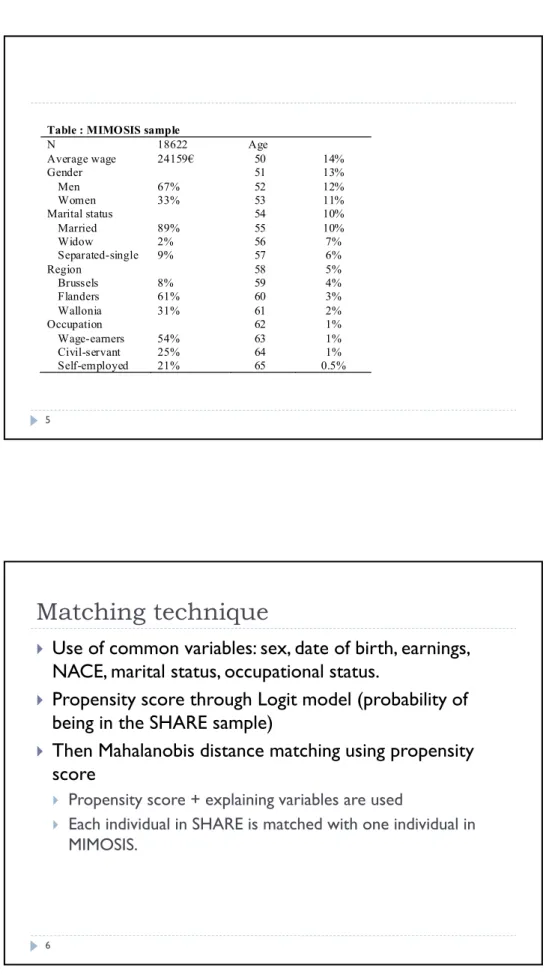
Table : MIMOSIS sample
N 18622
Age
Average wage
24159€
50
14%
Gender
51
13%
Men 67% 52
12%
Women 33%
53 11%
Marital status
54
10%
Married 89%
55 10%
Widow 2%
56 7%
Separated-single 9%
57
6%
Region
58
5%
Brussels 8%
59 4%
Flanders 61%
60 3%
Wallonia 31%
61 2%
Occupation
62 1%
Wage-earners 54%
63
1%
Civil-servant 25%
64
1%
Self-employed 21%
65
0.5%
Matching technique
Use of common variables: sex, date of birth, earnings,
NACE, marital status, occupational status.
Propensity score through Logit model (probability of
being in the SHARE sample)
Then Mahalanobis distance matching using propensity
score
Propensity score + explaining variables are used
Each individual in SHARE is matched with one individual in
MIMOSIS.
Outcome
We match the entire careers, allowing us to calculate all
incentive variables
Use of our PENSCALC pension calculator
At this stage we focus on private sector wage-earners
Compute incentives for different retirement pathways (Pension,
CER, OAU, DI)
7
Incentives of 50+: SSW of Retirement, DI
(Averages - cross-section)
Driven by eligibility…
…and duration of benefits
0 30 00 0 60 0 0 0 90 00 0 12 00 00 1 5 0000 50 51 52 53 54 55 56 57 58 59 60 61 62 63 64 65 age Men Women SSW - retirement 0 50 00 0 10 00 0 0 15 00 00 2 0 0000 50 51 52 53 54 55 56 57 58 59 60 61 62 63 64 65 age Men Women SSW - DI
Incentives of 50+: SSW of CER, OAU
0 50 00 0 10 00 00 15 00 00 20 00 00 2 5 0000 50 51 52 53 54 55 56 57 58 59 60 61 62 63 64 65 age Men Women SSW - CER 0 50 00 0 10 00 0 0 15 00 00 2 0 0000 50 51 52 53 54 55 56 57 58 59 60 61 62 63 64 65 age Men Women SSW - OAU9
SSW: summary…
0 50 00 0 10 00 00 15 00 00 20 00 00 25 00 00 50 55 60 65 age Retirement CER OAU DISSW by scheme
10
Correlation benefits Share/Mimosis
11
We calculate OAU, CER and DI benefits based on SHARE
wage info and compare with the values obtanied with the
matched (and more complete) administrative data.
Correlation between benefits obtained on MIMOSIS wages and SHARE wages.
SHARE
CER
OAU
DI
CER
0.900
MIMOSIS OAU
0.930
DI
0.835
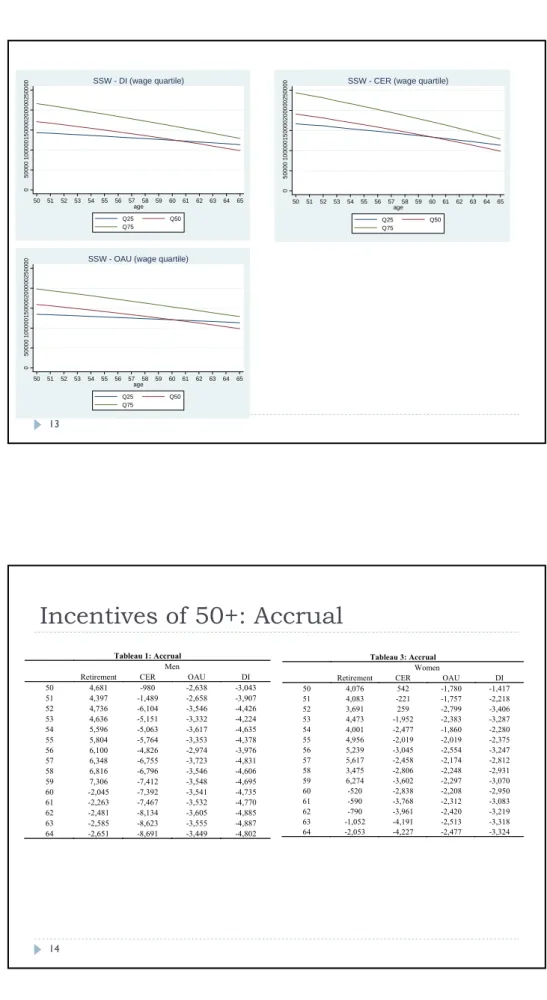
Focusing on
specific individuals
Forward looking approach
We look at quartiles basis
of the net wage for the
population aged 50.
Q25 is a divorced Flemish woman with 35 years of affiliation
Q50 is a married Flemish woman with 28 years of affiliation Q75 is a married Flemish man with 33 years of affiliation
0 30 00 0 60 00 0 90 00 0 12 00 00 15 00 00 50 51 52 53 54 55 56 57 58 59 60 61 62 63 64 65 age Q25 Q50 Q75
0 50 00 0 10 00 00 1 5 00 00 20 0 0 00 25 00 00 50 51 52 53 54 55 56 57 58 59 60 61 62 63 64 65 age Q25 Q50 Q75 SSW - DI (wage quartile) 0 50 00 0 10 00 0 0 15 0 0 00 2 0 00 00 25 00 0 0 50 51 52 53 54 55 56 57 58 59 60 61 62 63 64 65 age Q25 Q50 Q75
SSW - CER (wage quartile)
0 50 0 0 0 100000 15 00 00 20 00 00 250000 50 51 52 53 54 55 56 57 58 59 60 61 62 63 64 65 age Q25 Q50 Q75
SSW - OAU (wage quartile)
13
Incentives of 50+: Accrual
Tableau 1: AccrualMen
Retirement CER OAU DI
50 4,681 -980 -2,638 -3,043 51 4,397 -1,489 -2,658 -3,907 52 4,736 -6,104 -3,546 -4,426 53 4,636 -5,151 -3,332 -4,224 54 5,596 -5,063 -3,617 -4,635 55 5,804 -5,764 -3,353 -4,378 56 6,100 -4,826 -2,974 -3,976 57 6,348 -6,755 -3,723 -4,831 58 6,816 -6,796 -3,546 -4,606 59 7,306 -7,412 -3,548 -4,695 60 -2,045 -7,392 -3,541 -4,735 61 -2,263 -7,467 -3,532 -4,770 62 -2,481 -8,134 -3,605 -4,885 63 -2,585 -8,623 -3,555 -4,887 64 -2,651 -8,691 -3,449 -4,802 Tableau 3: Accrual Women
Retirement CER OAU DI
50 4,076 542 -1,780 -1,417 51 4,083 -221 -1,757 -2,218 52 3,691 259 -2,799 -3,406 53 4,473 -1,952 -2,383 -3,287 54 4,001 -2,477 -1,860 -2,280 55 4,956 -2,019 -2,019 -2,375 56 5,239 -3,045 -2,554 -3,247 57 5,617 -2,458 -2,174 -2,812 58 3,475 -2,806 -2,248 -2,931 59 6,274 -3,602 -2,297 -3,070 60 -520 -2,838 -2,208 -2,950 61 -590 -3,768 -2,312 -3,083 62 -790 -3,961 -2,420 -3,219 63 -1,052 -4,191 -2,513 -3,318 64 -2,053 -4,227 -2,477 -3,324
14
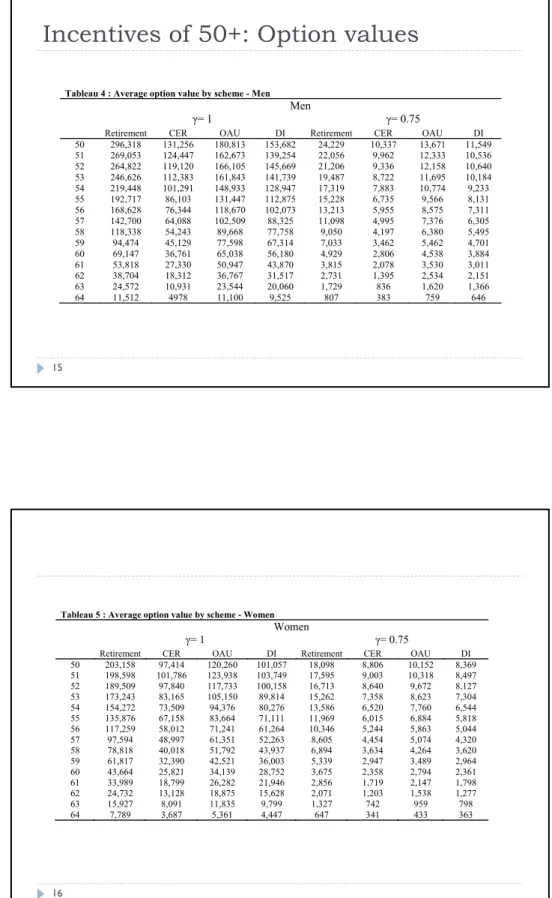
Incentives of 50+: Option values
Tableau 4 : Average option value by scheme - MenMen
γ= 1
γ= 0.75
Retirement CER OAU DI Retirement CER OAU DI
50 296,318 131,256 180,813 153,682 24,229 10,337 13,671 11,549 51 269,053 124,447 162,673 139,254 22,056 9,962 12,333 10,536 52 264,822 119,120 166,105 145,669 21,206 9,336 12,158 10,640 53 246,626 112,383 161,843 141,739 19,487 8,722 11,695 10,184 54 219,448 101,291 148,933 128,947 17,319 7,883 10,774 9,233 55 192,717 86,103 131,447 112,875 15,228 6,735 9,566 8,131 56 168,628 76,344 118,670 102,073 13,213 5,955 8,575 7,311 57 142,700 64,088 102,509 88,325 11,098 4,995 7,376 6,305 58 118,338 54,243 89,668 77,758 9,050 4,197 6,380 5,495 59 94,474 45,129 77,598 67,314 7,033 3,462 5,462 4,701 60 69,147 36,761 65,038 56,180 4,929 2,806 4,538 3,884 61 53,818 27,330 50,947 43,870 3,815 2,078 3,530 3,011 62 38,704 18,312 36,767 31,517 2,731 1,395 2,534 2,151 63 24,572 10,931 23,544 20,060 1,729 836 1,620 1,366 64 11,512 4978 11,100 9,525 807 383 759 646
15
Tableau 5 : Average option value by scheme - Women
Women
γ= 1
γ= 0.75
Retirement CER OAU DI Retirement CER OAU DI
50 203,158 97,414 120,260 101,057 18,098 8,806 10,152 8,369 51 198,598 101,786 123,938 103,749 17,595 9,003 10,318 8,497 52 189,509 97,840 117,733 100,158 16,713 8,640 9,672 8,127 53 173,243 83,165 105,150 89,814 15,262 7,358 8,623 7,304 54 154,272 73,509 94,376 80,276 13,586 6,520 7,760 6,544 55 135,876 67,158 83,664 71,111 11,969 6,015 6,884 5,818 56 117,259 58,012 71,241 61,264 10,346 5,244 5,863 5,044 57 97,594 48,997 61,351 52,263 8,605 4,454 5,074 4,320 58 78,818 40,018 51,792 43,937 6,894 3,634 4,264 3,620 59 61,817 32,390 42,521 36,003 5,339 2,947 3,489 2,964 60 43,664 25,821 34,139 28,752 3,675 2,358 2,794 2,361 61 33,989 18,799 26,282 21,946 2,856 1,719 2,147 1,798 62 24,732 13,128 18,875 15,628 2,071 1,203 1,538 1,277 63 15,927 8,091 11,835 9,799 1,327 742 959 798 64 7,789 3,687 5,361 4,447 647 341 433 363
Distributional analysis of OV
Tableau 6 : Distribution of option value by scheme – Men (γ= 1)
10th percentile Median 90th percentile
Retirement CER OAU DI Retirement CER OAU DI Retirement CER OAU DI
50 182,787 64,034 99,939 76,028 283,511 122,350 168,476 145,307 414,311 186,152 268,788 241,557 51 166,668 44,206 81,759 68,249 256,670 110,410 148,730 132,092 376,464 202,748 242,248 216,617 52 155,164 49,581 79,611 60,938 230,072 97,904 133,409 119,054 418,938 196,610 291,011 272,226 53 148,068 52,244 72,537 58,891 211,363 90,658 122,845 109,211 376,914 179,767 266,411 242,343 54 123,557 45,242 64,823 48,167 187,692 80,240 111,311 96,226 335,316 169,651 260,047 234,578 55 112,231 38,637 55,161 39,795 163,276 69,714 98,772 85,234 294,837 142,564 230,050 190,336 56 94,921 32,659 47,308 34,961 139,387 62,275 87,264 74,759 271,161 131,380 239,284 181,751 57 78,359 26,068 39,623 28,186 116,907 51,765 75,833 64,637 229,720 113,236 178,215 155,719 58 60,921 21,305 33,927 23,470 93,722 43,643 64,921 55,427 191,985 95,760 169,758 142,087 59 41,482 15,466 28,388 18,889 73,624 34,594 54,450 46,008 161,548 80,613 160,407 138,884 60 24,987 11,482 22,202 14,495 51,460 27,438 44,451 37,329 121,635 65,088 138,754 118,906 61 18,334 7,728 16,221 10,039 39,387 20,130 34,357 28,769 99,374 47,820 109,685 93,639 62 13,013 4,798 10,555 6,697 28,117 13,863 24,787 20,459 70,453 33,770 79,828 67,610 63 6,684 2,438 6,083 3,806 18,020 8,498 16,036 13,213 44,237 21,555 51,770 43,548 64 580 0 0 0 8,714 3,970 7,756 6,448 21,493 10,535 25,405 21,311