Qualitative Comparison of Audio and Visual Descriptors Distributions
Texte intégral
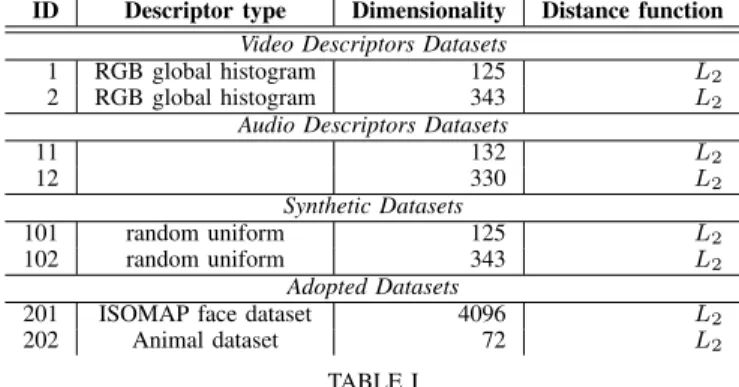
Figure

Documents relatifs
The validation tests showed that the numerical model represents accurately the conceptual model of eogenetic karst development. The numerical approximation was applied using data
Leptin induces cell migration and the expression og growth factors in human prostate cancer cells. Vascular endothelial growth factor and its correlation with angiogenesis and
Cependant cette population manifeste les mêmes soucis, les mêmes préoccupations et les mêmes aspirations liées aux conditions de vie (amélioration des conditions
Covariance mapping is also used to determine a representation of uncertainty on the time delay estimates in the video domain and similarly to determine a representation for
In this paper a study of audio (A), visual (V), and audio-visual (AV) egocentric distance perception in the action space (1.5 m to 6 m) by moving participants in virtual environments
The audio modality is therefore as precise as the visual modality for the perception of distances in virtual environments when rendered distances are between 1.5 m and 5
Criteria for selection included the following: (a) participants needed to be age 25 or older, (b) they needed to have been in a committed couple relationship for at least two years
The contributions of this work are three-fold: (1) we formulate the image-based localization problem as a re- gression on an image graph with images as nodes and edges
