MARINE ECOLOGY PROGRESS SERIES Mar Ecol Prog Ser
Vol. 506: 175–192, 2014
doi: 10.3354/meps10776 Published June 23
INTRODUCTION
Human activities exert strong pressures on marine coastal ecosystems (Crain et al. 2009). Over the past 30 yr, marine protected areas (MPAs) have become increasingly common worldwide, and are now among the most commonly utilised tools for the conservation of ecosystems and the management of fisheries (Agardy 1994, Lubchenco et al. 2003, Claudet 2011). MPAs have the potential to directly influence the den-sity, biomass, size and richness of commercial species, such as fish and large mollusks (Halpern 2003, Lester
et al. 2009, Claudet et al. 2011), but may also indi -rectly change the whole structure of bio logical assem-blages and thus the functioning of ecosystems (Pin-negar et al. 2000, Micheli et al. 2005, Guidetti 2006). For in stance, the recovery of exploited fish species in MPAs can lead to declines in other species (Micheli et al. 2004), through trophic or competitive inter actions (Claudet et al. 2011). Fish predation may be higher in MPAs, regulating the abundance of many benthic in-vertebrates such as gastropods (McClanahan 1990), bivalves (Langlois et al. 2005) and sea urchins (Mc-Clanahan 1995, Sala & Zabala 1996, Guidetti 2006).
© Inter-Research 2014 · www.int-res.com *Corresponding author: [email protected]
Seagrass amphipod assemblages in a Mediterranean
marine protected area: a multiscale approach
Nicolas Sturaro
1,*, Gilles Lepoint
1, Amanda Pérez-Perera
1, Simon Vermeulen
1,
Pieraugusto Panzalis
2, Augusto Navone
2, Sylvie Gobert
11Laboratory of Oceanology, MARE Centre, University of Liège, Allée du Six Août 13, Building B6c (Sart Tilman), 4000 Liège, Belgium
2Marine Protected Area of Tavolara-Punta Coda Cavallo, Via Dante 1, 07026 Olbia, Italy
ABSTRACT: Marine protected areas (MPAs) are a key tool for conservation purposes, but few studies have assessed the responses of small macrozoobenthic assemblages to different protection levels in the Mediterranean Sea. In this study, we used a hierarchical sampling design spanning 3 orders of magnitude (1, 10 and 100 m) to investigate whether a MPA exerts an effect on amphi-pod assemblages associated with Posidonia oceanica meadows. We report spatial and temporal variability patterns of amphipod assemblages in 4 different protection levels and discuss potential confounding effects, such as habitat features. The structure of amphipod assemblages based on density data was patchy at all spatial scales investigated, but differed markedly among protection levels. Among outstanding points, multiscale analyses showed that lower densities and/or bio-masses of several taxa occurred within fully protected and external areas, in comparison with par-tially protected areas (PPAs). Furthermore, P. oceanica meadow features (shoot density, leaf and epiphyte biomasses, coefficient A and litter biomass) accounted for only a low proportion of the total variability. We consequently infer that the observed patchiness is likely to occur for multiple and interconnected reasons, ranging from the ecological and behavioural traits of amphipod spe-cies to protection-dependent processes (e.g. fish predation). Long-term multiscale spatial and temporal monitoring, as well as experimental manipulations, are needed to fully understand the effects of protection on macrozoobenthic assemblages.
KEY WORDS: Amphipod assemblages · Posidonia oceanica · Seagrass · Hierarchical sampling design · Marine protected area
The ways in which macrozoobenthic species res -pond to protection measures have been studied in different ecosystems around the world and remain somewhat unpredictable. In a Chilean marine re -serve, the short-term cessation of fishing activities resulted in a 2- to 3-fold increase in abundance of a dominant gastropod, leading to the decline of its major prey and its replacement by other benthic communities (Moreno et al. 1984, 1986). Conversely, in Kenyan reefs protected from fishing, densities of large gastropods remained virtually identical both inside and outside the protected area (McClanahan 1989). In a large-scale study of Kenyan lagoons, McClanahan (1990) suggested that the removal of fish predators through fishing resulted in an increase in population densities of benthic invertebrates.
Few studies have specifically addressed the effects of protection on macrozoobenthic species in the Mediterranean Sea, especially on small vagile species (e.g. amphipods, small mollusks), despite their impor-tance as food sources for fish (Bell & Harmelin-Vivien 1983). At the Scandola MPA (France), large macro-zoobenthic organisms (mainly echinoderms and mol-lusks) showed lower abundance and species numbers within the MPA in comparison with outside reference sites (Boudouresque et al. 1992). In contrast, at the Us-tica MPA (Italy), for both polychaetes and mollusks, abundances and number of species were higher within the fully protected sites compared to the out-side fishing area (Badalamenti et al. 1999, Chemello et al. 1999, Milazzo et al. 2000). However, all these re-sults should be interpreted with caution because of the low number of sites studied and the limited spatial and temporal scales investigated. The adopted sam-pling designs may make it impossible to distinguish be tween the natural variability of ecosystems and the potential variability induced by protection (Allison et al. 1998).
Natural heterogeneity of ecosystems is a major problem in the assessment of the ecological effective-ness of MPAs (Kolasa & Pickett 1991, García-Charton et al. 2000). The magnitude of this natural variability should be quantified at each scale of observation using a multiscale hierarchical approach (García-Charton & Pérez Ruzafa 1999). Characterization of heterogeneity and exploration of the relationships between species and habitat features are now con-sidered key points to address when designing field experiments that aim to measure the potential effects of protection (García-Charton & Pérez Ruzafa 1999, García-Charton et al. 2000). Indeed, a variety of abiotic and biotic factors (e.g. habitat features) may explain an important part of the variability in some
populations, especially in heterogeneous ecosystems such as Posidonia oceanica seagrass meadows (Gobert et al. 2003).
P. oceanica forms dense meadows, which are key ecosystems in the Mediterranean sublittoral zone (Boudouresque et al. 2006, Gobert et al. 2006). These meadows play a major role in primary production and sediment stabilization, and provide a physical habitat for fish and invertebrate assemblages (Maz -zella et al. 1989, Hemminga & Duarte 2000). This species is legally protected in many Mediterranean countries in accordance with European Commission Habitats Directive 92/43/EEC (Platini 2000, Boudou -resque et al. 2006) and numerous MPAs include large areas of P. oceanica meadows (Francour et al. 2001). Despite their ecological importance, the effects of protection on small macrozoobenthic spe-cies associated with P. oceanica meadows have not yet been studied.
The amphipod fauna is an important constituent of P. oceanica meadow vagile invertebrates, comprising a large number of species with high abundance and biomass (Mazzella et al. 1989, Gambi et al. 1992). As a food source for decapod and fish populations, amphipods play a major role in the transfer of energy towards higher trophic levels (Bell & Harmelin-Vivien 1983, Pinnegar & Polunin 2000). Moreover, these organisms have already been used in the mon-itoring of environmental impacts in P. oceanica meadows (Sánchez-Jerez & Ramos-Esplá 1996, Sánchez-Jerez et al. 2000) and are generally consid-ered, as a group, to be sensitive to a variety of pollu-tants (Conlan 1994, Dauvin & Ruellet 2007, De-la-Ossa-Carretero et al. 2012). Amphipods generally have low dispersal ability (Dauvin 1987). They recruit heavily and grow quickly (Bellan-Santini 1998) compared to other organisms such as corals, seagrasses and many sponges which are long-lived, slow-growing and poorly recruiting taxa. Amphipods could provide an important view of the changing communities within MPAs (Palumbi 2001).
Previous studies have investigated the potential importance of temperate seagrass features on the distribution of small macrozoobenthic organisms (Edgar & Robertson 1992, Connolly 1995, Attrill et al. 2000), including amphipod crustaceans (Sánchez-Jerez et al. 2000, Como et al. 2008, González et al. 2008). Evidence from both experimental data and field sampling strongly suggests that the density of several amphipod species correlates to the biomass of seagrasses (Attrill et al. 2000, González et al. 2008), epiphytes (Schneider & Mann 1991, Zakhama-Sraieb et al. 2011) and litter (Sánchez-Jerez et al.
Author
2000, Como et al. 2008). However, amphipod-sea-grass relationships in P. oceanica are not yet well understood.
This study aimed to assess the effects of differing levels of protection in a Mediterranean MPA on am-phipod assemblages living in P. oceanica meadows. To this end, we investigated the spatial vari ability of amphipod assemblages living in the seagrass at the different protection levels over 2 consecutive years. Specifically, we used a hierarchical sampling design at different spatial scales (1, 10 and 100 m) to describe the spatial patterns of amphipod density and biomass (total and by species), number of species, and diver-sity. Also, to elucidate the processes driving those patterns, the relationships between the seagrass habitat features (shoot density, leaf and epiphyte bio-masses, coefficient A and litter biomass) and amphi-pod assemblages were examined.
MATERIALS AND METHODS Study area
This study was carried out at the Tavolara-Punta Coda Cavallo Marine Protected Area (TMPA) (40° 53’ N, 09° 41’ E) located in northeast Sardinia (Italy) (Fig. 1). The TMPA covers 15 357 ha, extends along 76 km of coastline, and was est ablished in 1997. Effective enforce ment of protection started
there in 2003. The TMPA is zoned to provide 3 levels of protection: Zone A (529 ha) is a non-contiguous fully pro-tected area (FPA) or ‘integral reserve’, i.e. a no-take/ no-access zone. Zone B (3113 ha) is a non-contiguous ‘partial re serve’ and Zone C (11 715 ha) is a ‘general reserve’; both these zones are classified as partially protected areas (PPAs). Only scientists, reserve staff and policing authorities are permitted to access Zone A. In Zone B, only local professionals inhabiting the nearby coastal villa ges are permitted to fish. In Zone C, both professional and recreational fishing are permitted un -der restricted conditions imposed by the local Consortium Management of the TMPA. The spatial distribution of the major habitat types within the TMPA has previously been mapped by Bianchi & Morri (2006). Outside the TMPA, regulations are set according to Italian legislation, and are less restrictive com-pared to the area inside the MPA. For this study, data was also collected from outside the MPA (‘External Zone’), at sites located in the Gulf of Olbia, a heavily urbanized area impacted by pollutants originating from point (urban wastewater and industrial outfalls, aquaculture) and diffuse (ships, leisure tourism) sources.
Sampling design
The sampling was conducted in the Posidonia oceanica meadows of Zones A, B, and C, as well as in the External Zone outside the TMPA (Fig. 1). Using a hierarchical sampling design, 2 sites (separated by ~100 m, medium scale) were chosen for each of the 4 levels of protection, and in each site 2 sectors (sepa-rated by ~10 m, small scale) were randomly selected. Each sector was delimited by a permanent frame circum scribing an area of 9 m2, where 4 replicates separated by ~1 m were sampled at constant depth interval (10 to 15 m) during the daytime (10:00 to 17:00 h local time). This sampling strategy was adop -ted to reduce bathymetric and nycthemeral variabil-ity. The sampling was performed during the summer months of 2 consecutive years (July to August 2007 and 2008), with the exception of the External Zone which was only sampled in 2008, yielding a total of 112 samples. Zone A Zone B Zone C Sampling sites 2 km N Tavolara Olbia 200 km Sardinia Padrongianus River 40° 56’ N 9° 44’ E S6 S5 S8 S7 Molara Molarotto Capo Ceraso
Capo Coda Cavallo
S1 S2 S3
S4
Fig 1. Location and zoning of the Tavolara-Punta Coda Cavallo Marine Pro-tected Area (TMPA) in Sardinia, Mediterranean Sea. Zone A: integral reserve (fully protected area); Zone B: partial reserve; Zone C: general reserve (par-tially protected areas). Locations of sampling sites in the 3 zones (S1 to S6)
and in the External Zone (S7 and S8) outside the MPA
Author
Data collection
Amphipod samples were collected by means of SCUBA diving, using an airlift (Bussers et al. 1983, Michel et al. 2010). Each sampling area of the meadow was delimited by a PVC cylinder (height: 48 cm, diameter: 48.5 cm) to prevent the escape of mobile species. A surface of 0.185 m2was suctioned continuously for 2 min under constant airflow, col-lecting the amphipod and other invertebrates in a 0.5 mm mesh bag. Samples were sieved through a 0.5 mm mesh, fixed in a 4% formalin and seawater mix, and then transferred to 70% ethanol.
Amphipods were identified to species level and counted. We estimated the relative abundance and frequency of occurrence (f ) for each species. We also calculated density (ind. m−2) for each species and quantified biomass (mg dry weight [DW] m−2 after drying at 60°C for 48 h) for species that contributed ≥3% of the total biomass. The amphipod assemblage was characterized according to general descriptors: number of species (S), and the Shannon-Wiener diversity index (H’ ) = –Σipi logs(pi) where pi is the proportion of the total count arising from the ith spe-cies. Ovigerous females were counted for all spespe-cies. In order to assess the relationships between amphi-pod faunal and habitat features, 3 P. oceanica shoots were collected in 2008 from each area previously sampled for amphipods (i.e. a total of 192 shoots). The P. oceanica meadow was characterized with commonly used descriptors: shoot density (shoots m−2; n = 4 per sector); leaf and epiphyte biomasses (g DW shoot−1; n = 12 per sector); and coefficient A (percentage of leaves per shoot having alteration marks; n = 12 per sector). In addition, leaf litter mate-rial and macrophyte debris were collected from airlift sampling areas and put inside plastic bags. These items were quantified as litter biomass (g DW m−2; n = 4 per sector) after drying at 60°C for 96 h.
Data analyses Univariate analyses
Nested ANOVAs were used to examine the effects of protection, site and sector on (1) amphipod vari-ables, (2) the density of the most common species (f ≥ 10%) and (3) the biomass of species accounting for ≥3% of the total amphipod biomass. In order to attain a comparable design between 2007 and 2008, data from the External Zone were excluded from the analysis. The data were analysed using a 3-factor
model: Protection (Pr) (fixed factor with 3 levels, cor-responding to the 3 zones of the TMPA); Site (Si) (random and nested in Pr, with 2 levels); and Sector (Se) (random and nested in Si and Pr, with 2 levels). Due to the possible overlap of sampled surfaces in P. oceanica meadows during the 2 sampling times, ‘time’ was not considered as a formal factor to avoid temporal dependence of data (Underwood 1997), and the analyses were therefore conducted separately for each year of sampling. We used variance component analyses to estimate the proportion of random varia-tion associated with each random factor (Searle et al. 1992, Underwood 1997). Seagrass habitat features were also analysed using the 3-factor model, as pre-viously described.
Prior to these analyses, normality and homogeneity of variances were checked using the Kolmogorov-Smirnov and Cochran C tests respectively. When these assumptions were not encountered, data were transformed by or log(x + 1). Whenever vari-ances remained heterogeneous, untransformed data were analysed, as ANOVA is a robust statistical test and is relatively unaffected by heterogeneity of vari-ances, particularly when experiments are balanced and contain a large number of samples (Underwood 1997). In these cases, special care was taken in the interpretation of results, and to reduce Type I error the significance level of statistics was considered at ≤0.01 (Underwood 1997). When ANOVA indicated a significant difference for the protection factor, the source of difference was identified using post-hoc Bonferroni tests to avoid the inflation of Type I errors due to multiple comparisons (Quinn & Keough 2002). The significance level was set to 0.05 when ANOVA conditions were met.
Multivariate analyses
Effects of different protection levels on the struc-ture of amphipod assemblages were analysed as abundance data using a 3-way permutational multi-variate analysis of variance (PERMANOVA, Ander-son et al. 2008). As we did for the univariate analyses, data from the External Zone were excluded from the set in order to attain a comparable design between 2007 and 2008. In the design, Protection (Pr) was treated as a fixed factor (3 levels), Site (Si) as a ran-dom factor (2 levels) nested in Pr, and Sector (Se) as a random factor (2 levels) nested in Si. Analyses were based on Bray-Curtis dissimilarity matrices calcu-lated from square-root transformed abundance data. The data transformation was carried out to balance
x
( +1)
Author
the contribution from the rarer species. Analyses were tested using 9999 random permutations of residuals under a reduced model, with appropriate units as required by the design (Anderson & ter Braak 2003). When the number of possible per-mutable units was not enough to get a reasonable test by permutation, a p-value was obtained using a Monte Carlo test (Anderson & Robinson 2003). A per-mutational test of multivariate dispersion (PERM-DISP, Anderson et al. 2008) was used to test the homogeneity of multivariate dispersions.
To visualize multivariate patterns, non-metric multi dimensional scaling (NMDS) ordinations were obtained from Bray-Curtis dissimilarity matrices cal-culated from square-root transformed abundance data. Due to the high number of total samples (n = 96), only the 24 centroids for the combined factor Year × Protection × Site × Sector were visualized. The stress value of NMDS indicated the goodness of fit of the representation of distances between samples in the 2-dimensional space of the ordination plot. A stress value < 0.2 is considered to provide a useful ordination. Species that contributed most to the dis-similarity among protection zones were identified using a similarity percentage analysis (SIMPER) (Clarke & Warwick 2001).
Relationships between habitat features, amphipod general descriptors and density of the most common taxa (f ≥ 10%), were assessed using multiple linear regressions. Prior to regression analyses, data were checked for collinearity and outliers were detected (and subsequently removed) by carrying out analy-ses of residuals (Jongman et al. 1995, Graham 2003). The relationships between amphipod assemblages and habitat features were analysed using distance-based linear models (DISTLM) (Legendre & Ander-son 1999, McArdle & AnderAnder-son 2001). Prior to analy-sis, the collinearity among explanatory variables was tested. The analysis was based on the Bray-Curtis distance measure after square-root transformation of the abundance data. The ‘best’ selection procedure, with Akaikes’ information criterion (AIC) as the selection criterion based on 9999 permutations was used to test habitat variables. DISTLM analysis was repeated using only significant variables (p ≤ 0.05). A distance-based redundancy analysis (dbRDA) was performed to visualize the fitted model in 2-dimen-sional space. Unlike NMDS, this analysis is constrained, meaning that the resulting ordination is de -pen dent on both species composition and habitat variables. Univariate and multivariate analyses were performed using STATISTICA 10 and PRIMER 6 & PERMANOVA+ software.
RESULTS Amphipod assemblages
A total of 4512 amphipod specimens belonging to 51 species and 25 families were identified, of which 10 species occurred concomitantly in all protection levels and across sampling years (Table 1). Families Caprellidae (6 species), Aoridae (5 species) and Lysianassidae (5 species) yielded the highest number of species. The 3 most frequent species (f ≥ 80%), Apherusa chiereghinii, Aora spinicornis and Phtisica marina, represented 56 and 49% of the total abun-dance and biomass respectively. Only 4 species were frequent (40% ≤ f < 80%) and 8 species common (10% ≤ f < 40%), while 36 species were occasional (f < 10%). Overall, 9% of the total specimens re -mained unidentified.
Multiscale variation
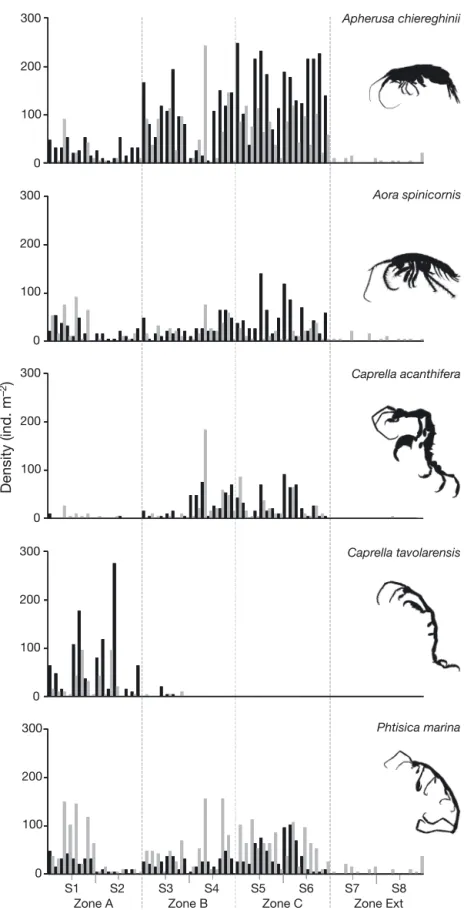
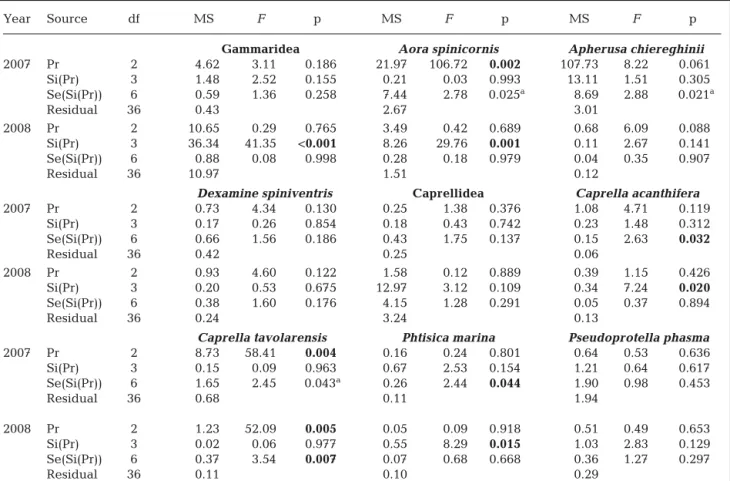
The general descriptors of amphipod assemblages did not differ between protection levels (Table 2, Fig. 2), except in 2007 with regards to diversity (p = 0.050). At the suborder level, only the mean density of Gammaridea differed significantly between pro-tection zones in 2007, with lower abundances in Zone A compared to other areas. At the species level, 5 out of 15 frequent and common species (f ≥ 10%) showed different mean densities among zones, in -cluding 3 Gammaridea and 2 Caprellidea (Table 3). A. chiereghinii, Iphimedia minuta, Liljeborgia della -vallei and Caprella sp. (armata group) were more abundant within the partially protected areas (Zones B and/or C), while a higher abundance was observed for Caprella tavolarensis in the FPA (Zone A) (Tables 1 & 3, Fig. 3).
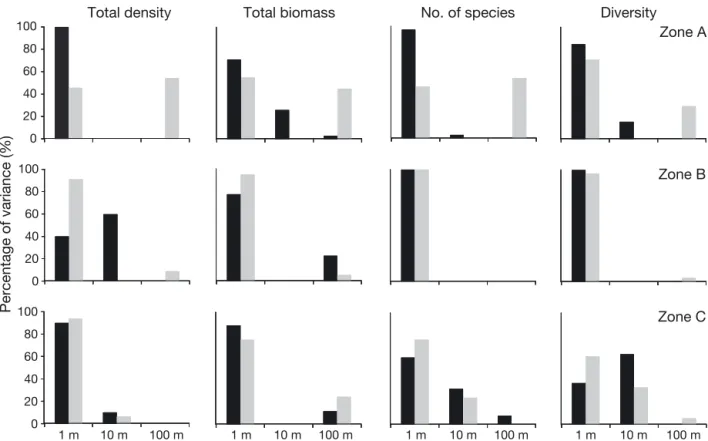
At the site scale (~100 m), total amphipod density, total biomass and the number of species were signif-icant in 2008 (Table 2, Fig. 2), accounting for between 0 and 54% of the total variation in Zone A (Fig. 4). The densities of 5 species, comprising 2 Gammaridea (A. spinicornis and Orchomene humilis) and 3 Caprellidea (C. acanthifera, P. marina and Pseudoprotella phasma), also varied at the site scale in 2008. At the sector scale (~10 m), 5 species showed significant differences in mean densities: 2 Gammaridea in 2007 (Apolochus neapolitanus and A. chiereghinii) and 3 Caprellidea in 2007 or 2008 (Caprella sp. [armata-group], C. tavolarensis and P. marina). At a smaller scale (~1 m), the observed vari-ability seemed to be very important for species
den-Author
Zone A Zone B Zone C Zone Ext 2007 2008 2007 2008 2007 2008 2008 Gammaridea
Ampelisca diadema (Costa, 1853) Ampelisca rubella (Costa, 1864) Ampithoe helleri (Karaman, 1975) Ampithoe ramondi (Audouin, 1826) Aora gracilis (Bate, 1857)
Aora spinicornis (Afonso, 1976)
Apherusa chiereghinii (Giordani-Soika, 1950) Apolochus neapolitanus (Della Valle,1893) Atylus guttatus (Costa, 1851)
Atylus vedlomensis (Bate and Westwood, 1862) Cymadusa crassicornis (Costa, 1853)
Dexamine spiniventris (Costa, 1853) Dexamine spinosa (Montagu, 1813) Ericthonius punctatus (Bate, 1857) Eusiroides dellavallei (Chevreux, 1899) Gammarella fucicola (Leach, 1814) Gammaropsis dentata (Chevreux, 1900)
Gammaropsis palmata (Stebbing & Robertson, 1891) Gammarus aequicauda (Martynov, 1931)
Gitana sarsi (Boeck, 1871) Guernea coalita (Norman, 1868) Harpinia zavodniki (Karaman, 1987) Hyale camptonyx (Heller, 1866) Iphimedia minuta (Sars, 1882)
Ischyrocerus inexpectatus (Ruffo, 1959) Lembos websteri (Bate, 1857)
Leptocheirus guttatus (Grube, 1864) Leptocheirus pectinatus (Norman, 1869) Leucothoe spinicarpa (Abildgaard, 1789) Liljeborgia dellavallei (Stebbing, 1906) Lysianassa costae (Milne-Edwards, 1830) Lysianassa pilicornis (Heller, 1866) Lysianassina longicornis (Lucas, 1849) Microdeutopus anomalus (Rathke, 1843) Microdeutopus similis (Myers, 1977) Nannonyx propinquus (Chevreux, 1911) Orchomene humilis (Costa, 1853) Peltocoxa gibbosa (Schiecke, 1977) Peltocoxa marioni (Catta, 1875)
Perioculodes aequimanus (Kossmann, 1880) Podocerus variegatus (Leach, 1814) Stenothoe eduardi (Krapp-Schickel, 1976) Synchelidium longidigitatum (Ruffo, 1947) Tmetonyx nardonis (Heller, 1866) Tritaeta gibbosa (Bate, 1862) Caprellidea
Caprella acanthifera (Leach, 1814) Caprella cf. acanthifera
Caprella sp. (armata-group) (see Krapp-Schickel & Vader 1998) Caprella tavolarensis (Sturaro & Guerra-García, 2011)
Phtisica marina (Slabber, 1769) Pseudolirius kroyeri (Haller, 1897) Pseudoprotella phasma (Montagu, 1804)
< 1 1–10 11–50 51–200 ind. m–2
Table 1. Mean density (ind. m−2) of amphipod taxa at the 4 zones with different levels of protection (see Fig. 1) at the Tavolara-Punta Coda Cavallo Marine Protected Area (TMPA) in 2007 and 2008 (gaps indicate the species was absent)
Author
sities (Fig. 3) and general descriptors accounted for 37 to 100% of the total variation (Fig. 4).
Biomass values showed some contrasting results in comparison to densities (Table 4). Biomass values for A. chiereghinii and Gammaridea were not found to be significantly affected by protection level, whereas for both taxa differences were found be -tween densities in 2007 and/or 2008. Biomass of A. spinicornis was shown to be significantly affected by the protection level in 2007, whereas no dif -ferences were found in terms of densities. In 2008,
biomasses of P. phasma and Caprellidea were not found to differ between sites, while Gammaridea exhibited significant spatial heterogeneity at this scale. In 2007, at the sector scale, the abundance of Gammaridea, A. chiereghinii and Caprellidea re mained consistent between sectors, while C. acan
-thifera exhibited significant spatial heteroge neity
at this scale.
In contrast to univariate statistical analyses, PER -MANOVA evidenced that amphipod assemblage structures differed among protection zones in both
Year Source df MS F p Total density 2007 Pr 2 95.51 8.97 0.054 Si(Pr) 3 10.65 0.56 0.660 Se(Si(Pr)) 6 18.96 1.79 0.130 Residual 36 10.62 2008 Pr 2 52.60 0.56 0.620 Si(Pr) 3 93.47 11.17 0.007 Se(Si(Pr)) 6 8.37 0.36 0.897 Residual 36 23.01 Total biomass 2007 Pr 2 323.07 5.09 0.109 Si(Pr) 3 63.51 1.97 0.221 Se(Si(Pr)) 6 32.30 1.12 0.373 Residual 36 28.97 2008 Pr 2 18.19 0.20 0.829 Si(Pr) 3 91.39 16.59 0.003 Se(Si(Pr)) 6 5.51 0.25 0.956 Residual 36 22.00 No. of species 2007 Pr 2 0.15 0.01 0.986 Si(Pr) 3 10.21 1.23 0.379 Se(Si(Pr)) 6 8.33 1.78 0.132 Residual 36 4.69 2008 Pr 2 1.56 0.06 0.941 Si(Pr) 3 24.96 6.31 0.028 Se(Si(Pr)) 6 3.96 0.65 0.690 Residual 36 6.10 Diversity 2007 Pr 2 0.28 9.53 0.050 Si(Pr) 3 0.03 0.10 0.959 Se(Si(Pr)) 6 0.30 2.79 0.025 Residual 36 0.11 2008 Pr 2 0.05 0.15 0.867 Si(Pr) 3 0.35 3.28 0.100 Se(Si(Pr)) 6 0.11 0.82 0.564 Residual 36 0.13
Table 2. Nested ANOVA for amphipod general descriptors (total density, total biomass, number of species, and diversity [Shannon-Wiener H’]) in 2007 and 2008. Pr: Protection; Si: site; Se: sector. See Fig. 2 legend for sampling design; Zone Ext (Sites S7 and S8) is excluded from the analysis.
Signifi-cant (p ≤ 0.05) values are in bold
0 1 2 3 Diversity S5 S6 0 200 400 600 2007 2008
Total density (ind. m
–2 ) 0 10 20 30 Total biomass (mg DW m –2 ) 0 5 10 15 No. of species 0 1 2 3
Zone A Zone B Zone C Zone Ext
S1 S2 S3 S4 S7 S8
Fig. 2. Values of amphipod general descriptors at Sites S1 to S8, in 4 zones with different levels of protection inside and outside the TMPA (see Fig. 1), in (D) 2007 and (s) 2008.
Within each zone, 2 sampling sites were separated by ~100 m (medium scale). Within each site, mean ± SE values are shown for 2 sectors (n = 4 replicates per sector) separated by ~10 m (small scale). Descriptors include total amphipod density (ind. m−2), total biomass (mg DW m−2), number of species per sample, and Shannon-Wiener diversity index
(H ’) per sample. DW: dry weight
Author
Year Source df MS F p MS F p MS F p Gammaridae
Gammaridea Apolochus neapolitanus Ampithoe helleri
2007 Pr 2 155.30 14.63 0.028 1.19 0.33 0.745 0.61 0.50 0.650 Si(Pr) 3 10.62 0.63 0.623 3.65 0.73 0.572 1.22 0.17 0.915 Se(Si(Pr)) 6 16.92 2.62 0.033 5.03 4.04 0.003 7.32 1.29 0.288 Residual 36 6.47 1.24 5.70 2008 Pr 2 28 216 2.06 0.273 78.74 2.87 0.201 9.77 2.00 0.281 Si(Pr) 3 13 673 9.24 0.011a 27.47 0.82 0.529 4.88 0.40 0.758 Se(Si(Pr)) 6 1480 0.16 0.986 33.57 0.57 0.748 12.21 0.83 0.552 Residual 36 9397 58.39 14.65
Aora spinicornis Apherusa chiereghinii Dexamine spiniventris
2007 Pr 2 27.25 5.83 0.093 72 605 22.01 0.016 4.25 7.00 0.074 Si(Pr) 3 4.68 0.73 0.571 3299 0.61 0.635 0.61 0.53 0.677 Se(Si(Pr)) 6 6.41 1.86 0.114 5440 2.73 0.027 1.14 1.06 0.403 Residual 36 3.44 1989 1.08 2008 Pr 2 0.83 0.12 0.895 15 900 29.94 0.010 1.03 4.85 0.115 Si(Pr) 3 7.23 7.34 0.020 531 0.42 0.743 0.21 0.79 0.544 Se(Si(Pr)) 6 0.98 0.61 0.717 1255 0.53 0.781 0.27 0.56 0.756 Residual 36 1.60 2362 0.48
Ericthonius punctatus Iphimedia minuta Liljeborgia dellavallei
2007 Pr 2 2.89 1.62 0.333 90.34 37.00 0.008 115.36 7.27 0.071 Si(Pr) 3 1.78 1.83 0.242 2.44 0.17 0.915 15.87 0.45 0.728 Se(Si(Pr)) 6 0.98 0.84 0.551 14.65 0.40 0.871 35.40 1.43 0.232 Residual 36 1.17 36.22 24.82 2008 Pr 2 6.26 6.20 0.086 4.67 1.12 0.433 0.66 13.36 0.032 Si(Pr) 3 1.01 1.73 0.260 4.17 2.76 0.134 0.05 0.11 0.952 Se(Si(Pr)) 6 0.58 0.43 0.857 1.51 1.93 0.103 0.45 1.41 0.239 Residual 36 1.37 0.78 0.32
Orchomene humilis Peltocoxa marioni
2007 Pr 2 0.16 0.13 0.885 12.82 2.33 0.245 Si(Pr) 3 1.27 4.46 0.057 5.49 0.36 0.784 Se(Si(Pr)) 6 0.28 0.43 0.855 15.26 2.14 0.072 Residual 36 0.66 7.12 2008 Pr 2 4.21 2.82 0.205 21.97 9.00 0.054 Si(Pr) 3 1.50 13.03 0.005 2.44 0.50 0.696 Se(Si(Pr)) 6 0.11 0.07 0.999 4.88 1.33 0.268 Residual 36 1.71 3.66 Caprellidae
Caprellidea Caprella acanthifera Caprella sp. (armata-group)
2007 Pr 2 0.09 0.10 0.906 35.22 7.34 0.070 9.35 15.14 0.027 Si(Pr) 3 0.86 0.43 0.742 4.80 3.34 0.097 0.62 0.25 0.858 Se(Si(Pr)) 6 2.03 4.30 0.002 1.43 1.50 0.207 2.46 3.65 0.006 Residual 36 0.47 0.96 0.67 2008 Pr 2 413 0.02 0.982 8.93 0.90 0.494 119.64 12.25 0.036 Si(Pr) 3 22 679 7.08 0.021 9.94 25.46 0.001 9.77 0.28 0.841 Se(Si(Pr)) 6 3205 0.55 0.769 0.39 0.25 0.956 35.40 0.92 0.495 Residual 36 5865 1.57 38.66
Caprella tavolarensis Phtisica marina Pseudoprotella phasma
2007 Pr 2 49.22 43.78 0.006 1963 2.08 0.271 2.41 1.81 0.306 Si(Pr) 3 1.12 0.73 0.570 944 0.56 0.663 1.33 1.13 0.410 Se(Si(Pr)) 6 1.54 1.07 0.396 1696 7.66 <0.001 1.19 1.09 0.386 Residual 36 1.43 222 1.09 2008 Pr 2 26.88 12.27 0.036 1055 0.12 0.895 2.05 0.17 0.853 Si(Pr) 3 2.19 0.68 0.597 9169 18.99 0.002 12.23 6.97 0.022 Se(Si(Pr)) 6 3.23 6.29 <0.001 483 0.26 0.951 1.75 0.74 0.620 Residual 36 0.51 1841 2.37
aNot significant at α = 0.01; this conservative level of significance was adopted because variances were heterogeneous and could not be stabilized by transformations
Table 3. Nested ANOVA for the density of the most frequent amphipod taxa (frequency [f ] ≥ 10%) in the TMPA in 2007 and 2008. See Table 2 legend for explanation of abbreviations. Significant (p < 0.05) values are in bold
Author
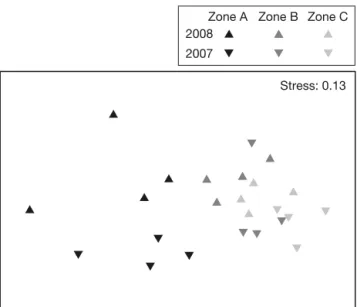
2007 (p = 0.005) and 2008 (p = 0.020) (Table 5). Pairwise comparisons show ed significant differences be -tween Zone A versus Zone B in 2007 (p = 0.049) and Zone C in both 2007 (p = 0.007) and 2008 (p = 0.031). Results indicated that the sector data varied strongly in 2007 (p < 0.001), while the site data varied in 2008 (p = 0.026). The PERMDISP test revealed strongly significant dispersion effects across protection zones in 2007 (p = 0.007) and 2008 (p = 0.011), with greater variability in the structure of amphi-pod assemblages observed in Zone A versus Zone C for both years (p < 0.002). General patterns of segrega-tion showed by NMDS plots reflected the results of the PERMANOVA and PERMDISP (Fig. 5). Groups of cen-troids belonging to each protection level were well separated, particu-larly centroids of Zone A versus Zones B and C for both years. In addi-tion, centroids from Zone C were tightly grouped, where as those from Zone A were disper sed, suggesting that amphipod assemblages in Zone C were more homogenous than in Zone A.
The results of the SIMPER analysis performed on species abundance showed that between-zone dissimi-larities were greater in 2008 (51.8 to 73.9) than in 2007 (39.2 to 59.1) (Table 6). In 2007, A. chiereghinii and C. acanthifera were the main contrib-utors to dissimilarity among protec-tion levels. C. tavolarensis and A. spinicornis were also important for explaining the dissimilarity be tween Zone A versus Zones B and C, and Zone B versus Zone C, respectively. In 2008, species that contributed the most to dissimilarity among protec-tion zones were A. chiereghinii and P. marina. C. tavolarensis contrib uted to the differences between Zone A ver-sus the other zones (including Zone Ext), while C. acanthifera played a significant role in the differences observed between Zones B, C and the External Zone outside the MPA. Apherusa chiereghinii Aora spinicornis Caprella acanthifera Caprella tavolarensis Phtisica marina 0 100 200 300 0 100 200 300 0 100 200 300 0 100 200 300 0 100 200 300 Density (ind. m –2)
Zone A Zone B Zone C Zone Ext
S1 S2 S3 S4 S5 S6 S7 S8
Fig. 3. Density values (ind. m−2) of the amphipod species that contributed most to the dissimilarity among the different protection levels of the 4 zones at the TMPA in 2007 (black) and 2008 (grey). Bars show the values for each
repli-cate sample (see Fig. 2 legend for sampling design)
Author
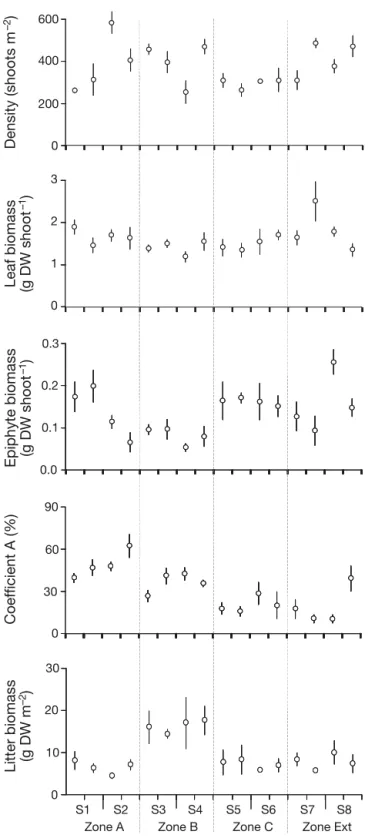
Spatial variation in meadow features No significant differences in shoot density, leaf or epiphyte biomasses were detected between protec-tion levels. Conversely, litter biomass showed signifi-cantly higher mean values in Zone B compared to other zones, while coefficient A decreased from Zone A to Zone C and the External Zone (Fig. 6, Table 7). Shoot density and coefficient A varied significantly at sector scale (~10 m). No differences were found for any of the measured variables at site scale (~100 m).
Influence of meadow features on amphipod assemblages
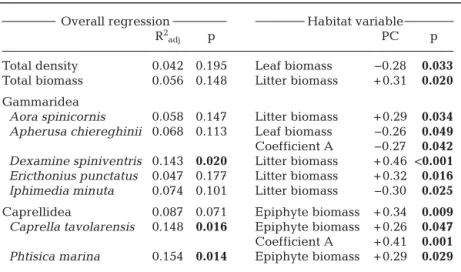
Multiple regression analyses yielded the detection of only weakly significant relationships between am-phipod and habitat variables (Table 8). The number of species and diversity appeared to be unaffec ted by the measured habitat variables. In contrast, amphi-pod total density tended to be negatively correlated to leaf biomass, while amphipod total biomass corre-lated positively with litter biomass. The combination of habitat features accounted for be tween 0 and 15%
of the variation in amphipod species densities. Litter biomass appeared to have a greater influence on gammarids, while the biomass of epiphytes were more related to caprellids (Table 8).
Results from the DISTLM were consistent with those obtained from multiple regressions, indicating very weak relationships between amphipod assem-blages and the habitat variables measured in this study (Fig. 7). The most parsimonious model con-tained 2 of the 5 measured habitat variables and explained a total of only 7.5% of the variation in the distribution and abundance of amphipods. The first dbRDA axis accounted for 4.8% of the total variation in the amphipod assemblage and allowed discrimi-nating samples based on litter biomass. Higher val-ues of litter biomass were associated with Zone B than with the other zones. The second dbRDA axis accounted for 2.7% of the variation in the amphipod assemblage and discriminated samples based on Posidonia oceanica shoot densities. This last variable was not clearly associated with a particular protec-tion zone, but with a higher variability among the samples within Zone A. Only a few amphipod species appeared to be influenced by measured habitat vari-ables. Some species, such as Dexamine spiniventris, 20 40 60 80 100 0 20 40 60 80 100 0 20 40 60 80 100 0 10 m 1 m 100 m Percentage of variance (%)
Total density Total biomass No. of species Diversity
10 m
1 m 100 m 1 m 10 m 100 m 1 m 10 m 100 m
Zone A
Zone B
Zone C
Fig. 4. Variance component analyses conducted on amphipod general descriptors in 2007 (black) and 2008 (grey), to estimate the variation among spatial scales (replicate: ~1 m; sector: ~10 m; site: ~100 m) in 3 zones in the TMPA with different levels of
protection (see Fig. 1)
Author
C. acanthifera and Ericthonius punctatus were asso-ciated with high litter biomass. Furthermore, A. neapolitanus was associated with high P. oceanica shoot density, while I. minuta was related to lower shoot density (Fig. 7).
DISCUSSION
This study demonstrated amphipod assemblage structure to be heterogeneous at all spatial scales, from metres to hundreds of metres, and to differ markedly among protection levels. In particular, the assemblage structures clearly differed between the FPA and the PPAs. Our data for the FPA also showed a reduced density and/or biomass of several taxa compared to other areas. Seagrass features only explained a small part of the variation among amphipods.
The effect of protection
These new findings on amphipod assemblage structures are in accordance with those of previous studies conducted on mollusks at the Ustica MPA (Milazzo et al. 2000). Moreover, some studies con-ducted on mollusks and echinoderms (McClanahan
Year Source df MS F p MS F p MS F p
Gammaridea Aora spinicornis Apherusa chiereghinii
2007 Pr 2 4.62 3.11 0.186 21.97 106.72 0.002 107.73 8.22 0.061 Si(Pr) 3 1.48 2.52 0.155 0.21 0.03 0.993 13.11 1.51 0.305 Se(Si(Pr)) 6 0.59 1.36 0.258 7.44 2.78 0.025a 8.69 2.88 0.021a Residual 36 0.43 2.67 3.01 2008 Pr 2 10.65 0.29 0.765 3.49 0.42 0.689 0.68 6.09 0.088 Si(Pr) 3 36.34 41.35 <0.001 8.26 29.76 0.001 0.11 2.67 0.141 Se(Si(Pr)) 6 0.88 0.08 0.998 0.28 0.18 0.979 0.04 0.35 0.907 Residual 36 10.97 1.51 0.12
Dexamine spiniventris Caprellidea Caprella acanthifera
2007 Pr 2 0.73 4.34 0.130 0.25 1.38 0.376 1.08 4.71 0.119 Si(Pr) 3 0.17 0.26 0.854 0.18 0.43 0.742 0.23 1.48 0.312 Se(Si(Pr)) 6 0.66 1.56 0.186 0.43 1.75 0.137 0.15 2.63 0.032 Residual 36 0.42 0.25 0.06 2008 Pr 2 0.93 4.60 0.122 1.58 0.12 0.889 0.39 1.15 0.426 Si(Pr) 3 0.20 0.53 0.675 12.97 3.12 0.109 0.34 7.24 0.020 Se(Si(Pr)) 6 0.38 1.60 0.176 4.15 1.28 0.291 0.05 0.37 0.894 Residual 36 0.24 3.24 0.13
Caprella tavolarensis Phtisica marina Pseudoprotella phasma
2007 Pr 2 8.73 58.41 0.004 0.16 0.24 0.801 0.64 0.53 0.636 Si(Pr) 3 0.15 0.09 0.963 0.67 2.53 0.154 1.21 0.64 0.617 Se(Si(Pr)) 6 1.65 2.45 0.043a 0.26 2.44 0.044 1.90 0.98 0.453 Residual 36 0.68 0.11 1.94 2008 Pr 2 1.23 52.09 0.005 0.05 0.09 0.918 0.51 0.49 0.653 Si(Pr) 3 0.02 0.06 0.977 0.55 8.29 0.015 1.03 2.83 0.129 Se(Si(Pr)) 6 0.37 3.54 0.007 0.07 0.68 0.668 0.36 1.27 0.297 Residual 36 0.11 0.10 0.29
aNot significant at α = 0.01; this conservative level of significance was adopted because variances were heterogeneous and could not be stabilized by transformations
Table 4. Nested ANOVA for biomass of the most important taxa in terms of relative biomass (≥3%). See Table 2 legend for explanation of abbreviations. Significant (p < 0.05) values are in bold
Year Source df MS Pseudo-F p
2007 Pr 2 8526 4.13 0.005 Si(Pr) 3 2063 1.41 0.156 Se(Si(Pr)) 6 1468 2.05 <0.001 Residual 36 716 2008 Pr 2 7913 2.81 0.020 Si(Pr) 3 2815 1.93 0.026 Se(Si(Pr)) 6 1456 1.02 0.441 Residual 36 1426
Table 5. PERMANOVA based on Bray-Curtis similarity of amphipod assemblages at the TMPA. See Table 2 legend for explanation of abbreviations. Significant (p < 0.05) values are in bold; p-values given in italics were obtained using the
Monte Carlo test
Author
1989, Boudouresque et al. 1992) showed that density and biomass can be affected by protection-depen-dent effects such as the rate of fish predation. An increase in abundance and/or biomass of fish predators, coupled with changes in fish assemblages with -in a FPA, may -indeed decrease the density of prey species (Guidetti 2006, Claudet et al. 2011). In the sublittoral rocky habitats of the TMPA, previous studies have shown fish biomass (including amphi-pod feeders such as Sciaena umbra and Diplodus sar-gus) to be up to 3 times greater inside the FPA as a result of protection measures (Di Franco et al. 2009, Sala et al. 2012, Sahyoun et al. 2013). Therefore, census surveys of fish assemblages in Posidonia oceanica meadows, combined with an experimental
manipulation of fish predation intensity (i.e. exclu-sion and incluexclu-sion cages) would be needed to test the hypothesis regarding fish predation at the TMPA.
Evaluation of the effectiveness of marine protec-tion on benthic assemblages can produce contrasting results. Our general descriptors of amphipod assem-blages did not reveal any significant differences among protection levels, with the exception of diver-sity in 2007. At the Ustica MPA (Italy), in a study focused on mollusks and polychaetes, the abundance and number of species were found to be greater inside the FPA than in PPAs (Milazzo et al. 2000, Badalamenti et al. 1999). In contrast, at El Campello (Spain), the number of species and diversity of differ-ent crustacean taxa (including amphipods), showed similar values between control and disturbed P. ocea -nica meadows, although assemblage structures were different (Sánchez-Jerez & Ramos Esplá 1996). It is possible that functional redundancy occurs and that different species occupy the same functional role (Micheli & Halpern 2005). However, specific ana -lyses (e.g. Claudet et al. 2011), which are beyond the scope of this study, would be required to answer this question.
The role of meadow features
Previous studies have demonstrated that seagrass features are among the factors likely to explain the variability of amphipod assemblages, at least for some species and general descriptors of assembla -ges. A substantial part of the variation in both the densities of amphipods and the assemblage struc-tures has previously been attributed to leaf density and litter biomass, as well as to epiphyte cover and
2007 2008 2008
S δ¯i δ¯i/SDi S δ¯i δ¯i/SDi S δ¯i δ¯i/SDi
Zone A vs. B Ct 16.6 1.3 Zone A vs. B Ac 12.7 1.5 Zone A vs. Ext. Ct 13.6 1.0
δ¯ = 54.5 Ac 12.5 1.7 δ¯ = 64.6 Pma 11.2 1.4 δ¯ = 73.9 Pma 13.0 1.4
Ca 11.0 1.5 Ct 9.8 1.0 As 9.3 1.3
Zone A vs. C Ac 17.1 2.2 Zone A vs. C Ac 17.2 1.7 Zone B vs. Ext. Ac 15.1 1.6
δ¯ = 59.1 Ct 15.1 1.3 δ¯ = 62.4 Pma 12.0 1.3 δ¯ = 69.8 Pma 13.3 1.5
Ca 10.4 2.0 Ct 10.3 1.1 Ca 10.1 1.3
Zone B vs. C Ac 16.1 1.2 Zone B vs. C Ac 14.3 1.2 Zone C vs. Ext. Ac 20.9 2.1
δ¯ = 39.2 Ca 10.3 1.3 δ¯ = 51.8 Pma 12.1 1.1 δ¯ = 69.9 Pma 17.0 1.7
As 8.5 1.4 Ca 9.2 1.2 Ca 10.9 1.5
Table 6. SIMPER routine to analyse dissimilarity among the 4 zones with different levels of protection (see Fig. 1) at the TMPA in 2007 and 2008. Species are ordered by decreasing contribution. δ¯: average dissimilarity between pair of zones; δ¯i:
contribu-tion from the ithspecies to the average dissimilarity, expressed as a percentage; SD
i: standard deviation; S: species. Ac:
Apherusa chiereghinii; As: Aora spinicornis; Ca: Caprella acanthifera; Ct: Caprella tavolarensis; Pma: Phtisica marina Stress: 0.13
Zone A Zone B Zone C 2007
2008
Fig. 5. Non-metric multidimensional scaling (NMDS) ordi-nation of amphipod assemblages in the TMPA. Plot triangles indicate sector centroids, coded by zone (see Fig. 1) and year
Author
biomass (Schneider & Mann 1991, Edgar & Robert-son 1992, Sánchez-Jerez et al. 2000, Scipione & Zupo 2010). Thus, distinguishing the relative contribution of habitat structures can help in elucidating the actual effects of protection (Jennings et al. 1996, García-Charton et al. 2004). In this study, the spatial variation of meadow features (e.g. shoot density, leaf and epiphyte biomasses) remained fairly similar among protection levels, except for litter biomass and coefficient A. Litter biomass showed higher values in only one of the PPAs (Zone B), which seemed geo-graphically more sheltered from hydrodynamism and may have represented a litter accumulation zone. Therefore, the gradual decrease in coefficient A from the FPA to the PPAs and the External Zone may be more satisfactorily explained by the grazing activity of the sparid fish Sarpa salpa (Prado et al. 2008). In parallel, the meadow features explained only 7.5% of the variation in the distribution and
Source df MS F p Shoot density Pr 3 40 271 0.86 0.531 Si(Pr) 4 46 893 1.52 0.283 Se(Si(Pr)) 8 30 778 4.21 0.001 Residual 48 7309 Leaf biomass Pr 3 0.05 1.77 0.291 Si(Pr) 4 0.03 0.95 0.482 Se(Si(Pr)) 8 0.03 1.91 0.080 Residual 48 0.01 Epiphyte biomass Pr 3 0.02 1.16 0.429 Si(Pr) 4 0.02 4.49 0.034a Se(Si(Pr)) 8 0.00 1.27 0.280 Residual 48 0.00 Coefficient A Pr 3 3227 9.42 0.028 Si(Pr) 4 343 0.94 0.489 Se(Si(Pr)) 8 366 2.83 0.012 Residual 48 129 Litter biomass Pr 3 6.46 35.87 0.002 Si(Pr) 4 0.18 0.95 0.485 Se(Si(Pr)) 8 0.19 0.35 0.940 Residual 48 0.54
aNot significant at α = 0.01; this conservative level of significance was adopted because variances were heterogeneous and could not be stabilized by transfor-mations
Table 7. Nested ANOVA for Posidonia oceanica variables: shoot density, leaf and epiphyte biomasses, coefficient A and litter biomass. See Table 2 legend for explanation of
abbreviations. Significant (p < 0.05) values are in bold
0 200 400 600 Density (shoots m –2 ) 0 1 2 3
Leaf biomass (g DW shoot
–1) 0.0 0.1 0.2 0.3 Epi p hy te biomass (g DW shoot –1) 0 10 20 30 Litter biomass (g DW m –2 ) 0 30 60 90 Coefficient A (%)
Zone A Zone B Zone C Zone Ext
S1 S2 S3 S4 S5 S6 S7 S8
Fig. 6. Characteristics of Posidonia oceanica in 2008 in 4 zones with different levels of protection inside and outside the TMPA (at 2 sites in each zone and 2 sectors in each site; see Fig. 2 legend for sampling design). Values are mean ± SE for shoot density (shoots m−2; n = 4 per sector), leaf and epiphyte biomasses (g DW shoot−1; n = 12 per sector), coeffi-cient A (percentage of leaves per shoot having alteration marks; n = 12 per sector) and litter biomass (g DW m−2; n = 4
per sector)
Author
abundance of amphipods, and either did not or only weakly influenced the densities of amphipod species and general descriptors. As reported by early work-ers in this field, litter biomass may have greatly influ-enced some species (e.g. Dexamine spiniventris and Ericthonius punctatus; Sánchez-Jerez et al. 2000). Probably because of the weak amphipod-habitat relationships, there was no consistency between
sta-tistical methods (i.e. dbRDA and regression analyses) for other habitat variables.
Spatial confounding factors Another factor that could explain the low density of several species inside the FPA is related to both the remote geo-graphical location of this area from the coast and to the relative isolation of its P. oceanica meadows (Navone et al. 1992, Bianchi & Morri 2006). Amphi -pods lack a pelagic larval stage and have specific habitat requirements (Thomas 1993), mini mizing dispersal effects to enhance the insularity of pop-ulations (Dauvin 1987). Even with their rapid maturation and long reproduction periods in the Mediterranean Sea (e.g. from April to September for Caprella acanthifera and all year long for Aora spinicornis; Jimeno-Fernandez 1993, Bellan-Santini 1998), the insular distribution, as well as demographic characteristics of certain species, may limit the disper-sion and the increase of populations within the FPA. In contrast, migratory species such as Phtisica marina with no insular distribution (Dauvin 1987) presented 31% of ovigerous females and did not differ among protection levels in terms of density and biomass.
Littoral amphipods are known to be greatly in -fluenced by variations in hydrodynamism (Conradi & López-González 2001, Guerra-García & García-Gómez 2001). Despite the remote geographical loca-tion and the potentially more wave-exposed FPA, it is unlikely that differences in the amphipod assem-blages observed be tween this protection level and the PPAs were asso ciated with variation in hydro -Overall regression Habitat variable
R2
adj p PC p
Total density 0.042 0.195 Leaf biomass −0.28 0.033 Total biomass 0.056 0.148 Litter biomass + 0.31 0.020 Gammaridea
Aora spinicornis 0.058 0.147 Litter biomass + 0.29 0.034 Apherusa chiereghinii 0.068 0.113 Leaf biomass −0.26 0.049 Coefficient A −0.27 0.042 Dexamine spiniventris 0.143 0.020 Litter biomass + 0.46 <0.001 Ericthonius punctatus 0.047 0.177 Litter biomass + 0.32 0.016 Iphimedia minuta 0.074 0.101 Litter biomass −0.30 0.025 Caprellidea 0.087 0.071 Epiphyte biomass + 0.34 0.009 Caprella tavolarensis 0.148 0.016 Epiphyte biomass + 0.26 0.047 Coefficient A + 0.41 0.001 Phtisica marina 0.154 0.014 Epiphyte biomass + 0.29 0.029 Table 8. Multiple linear regression analyses examining relationships between measured habitat variables, and amphipod general descriptors and the density of the most frequent amphipod taxa (f≥ 10%) at the TMPA. Only amphipod spe-cies and general descriptors for which habitat variables presented significant partial positive (+) or negative (−) correlations and/or overall regression (p≤ 0.05) are listed. The overall regression included shoot density, leaf and epiphyte biomasses, coefficient A and litter biomass. R2
adj: adjusted R2; PC: partial corre-lation. Significant (p < 0.05) values are in bold
Density Litter biomass An Ca Ct Dspiv Ep Im Pmi Pp –40 –20 0 20 40
dbRDA1 (64.3 % of fitted, 4.8 % of total variation) –40 –20 0 20 40 Zone A Zone B Zone C Zone Ext
dbRDA2 (35.7 % of fitted, 2.7% of total variation)
Fig 7. Distance-based redundancy ordination (dbRDA) for amphipod species and habitat features at the TMPA. Full and indented vectors indicate the direction of increasing values of the significant habitat variables (litter biomass and meadow density) and amphipod species, respectively. Only species with correlations ≥ 0.25 to the ordination axes are plotted. Vector length represents partial correlation strength with the dbRDA axes; the circle is a unit circle (radius = 1), whose relative size and position of origin is arbitrary with respect to the underlying plot. Plot points indicate individual samples from 4 zones with different levels of protection (see Fig. 1). An: Apolochus neapolitanus; Ca: Caprella acanthi -fera; Ct: Caprella tavolarensis; Dspiv: Dexamine spiniven-tris; Ep: Ericthonius punctatus; Im: Iphimedia minuta; Pmi:
Peltocoxa marioni; Pp: Pseudoprotella phasma
Author
dynamic conditions for the following reasons: (1) sampling was done at depths ranging from 10 to 15 m in the foliar stratum of the meadow which largely reduces hydrodyna mism (Gambi et al. 1989); and (2) some species (e.g. P. marina and Pseudoprotella phasma), which are considered typical of low to intermediate hydro dynamic environments (Conradi et al. 1997, Guerra-García & García-Gómez 2001, Guerra-García et al. 2002), were abundant in the FPA.
In the External Zone, the low values of total density, biomass, number of species, and diversity of am-phipods may be related to anthropogenic effluents originating from the urbanized and industrialized Gulf of Olbia. Indeed, analyses of water samples showed some higher concentrations of ammonia (with peaks > 4 µmol l−1), phosphorus, nitrites and chlorophyll a in the Gulf of Olbia compared to other locations in the TMPA (Consorzio di Gestione Area Marina Protetta Tavolara-Punta Coda Cavallo 2006). Amphipods are very sensitive to various pollutants (e.g. oil spills, organic enrichment, sewage pollution and ships’ wakes; see Conlan 1994 and references therein), and the disappearance of some amphipod species (or at least a decrease in abundance and di-versity) can be common at impacted sites (Dauvin 1987, Conlan 1994, De-la-Ossa-Carretero et al. 2012). Some species are excluded by pollution while others in crease in density (Bellan-Santini 1980). In our study, the most obvious example is the presence of the pollution-tolerant suspension feeder Podocerus variegatus (Bellan-Santini 1980) in the External Zone and in the PPA. Concomitantly, the densities of A. spinicornis and P. marina were greatly decreased in the External Zone compared to other sites. This cor-roborates previous findings on the sensitivity of these species to wastewater effluents (Borja et al. 2000, De-la-Ossa-Carretero et al. 2012). In contrast, Hyale
camptonyx and Caprella tavolarensis were essen
-tially found within the FPA. The genus Hyale and Caprella liparotensis (very closely related to C. tavolarensis; Sturaro & Guerra-García 2012) were found in particularly clean areas (Bellan-Santini 1980).
Most species showed the highest variation in den-sity at the lowest spatial scale (~1 m). Many other studies have documented considerable small spatial scale variations in the distribution and abundance of macrozoobenthic populations across a wide range of habitats (Underwood & Chapman 1996, Benedetti-Cecchi 2001, Chapman et al. 2010), including sea-grasses (De Biasi et al. 2003). Processes likely to be involved in such patterns include complex sets of
local physical and biological interactions such as the availability of food, behavioural aggregation, preda-tion, competipreda-tion, or different settlement features (Anderson et al. 2005, Fraschetti et al. 2005.
This study also highlighted that measuring spatial variations at both sector and site scale proved re -levant for many species. The inconsistency in vari-ability from 2007 to 2008 suggests the importance of the temporal scale. Large annual fluctuations in den-sity have already been observed in temperate waters for P. marina and species of the genus Apherusa and Gammarus. This may be attributed to the variability in the available algal biomass, natural amphipod population dynamics (e.g. irregularity of recruitment) and/or fish predation pressure related to yearly varia-tions of fish assemblages (Nelson 1979, Dauvin 1987, Costa & Costa 1999, Francour 2000, Guerra-García et al. 2000). The description of the natural variability of amphipod populations versus protection effects re-quires taking into account different spatial (~1, 10 and 100 m) and temporal scales, and we recommend using this ap proach in the context of future MPA management schemes and monitoring programs. In-deed, the choice of these relevant scales should be considered carefully to avoid a failure in the detection of protection effects.
CONCLUSIONS
In summary, this study demonstrates the strength and usefulness of the multiscale approach, but also highlights the difficulties inherent in properly asses -sing protection effects versus natural variability. Analyses revealed that the structure of amphipod assemblages associated with Posidonia oceanica meadows was patchy at a variety of spatial scales, but differed clearly between protection levels. The low densities and/or biomasses of several taxa ob -served within the fully protected area compared to the partially protected areas are also noticeable results. Seagrass features only explained a small part of the variation among amphipods. Reasons for the observed patchiness in amphipod assemblages are therefore probably multiple and interconnected, en compassing a range spanning from the ecological and behavioural traits of amphipod species to pro-tection-dependent processes (e.g. fish predation). Long term multiscale spatial and temporal monitor-ing of macrozoobenthic assemblages, as well as manipulative experiments, are clearly needed to fully understand macrozoobenthic responses to pro-tection in MPAs.
Author
Acknowledgements. The authors thank R. Biondo (Labora-tory of Oceanology, University of Liège), S. Vitale (TMPA), G. Caboni and L. Magnani (Porto San Paolo Dive Center, Italy) for technical assistance during field work. We sin-cerely thank all participants for field and laboratory assis-tance, for their help on many occasions and their useful ideas and suggestions, in particular Dr. L. Michel, Dr. J. Schnitzler, D. Pete, A. Grondin, O. Drouguet, Dr. N-X. Geil-fus, A. Viroux, M. Maire, and C. Michel. We gratefully acknowledge Dr. Paolo Guidetti and anonymous referees for their constructive and invaluable criticism of the manuscript. This study was supported by the Belgian Fund for Research for the Industry and Agriculture (FRIA, grant no. FC77010), by a Special Research Fund of the University of Liege (FSR), the Belgian National Fund for Scientific Research (FNRS), and the TMPA. This paper is MARE publication number 267.
LITERATURE CITED
Agardy MT (1994) Advances in marine conservation: the role of marine protected areas. Trends Ecol Evol 9: 267−270
Allison GW, Lubchenco J, Carr MH (1998) Marine reserves are necessary but not sufficient for marine conservation. Ecol Appl 8: 79−92
Anderson MJ, Robinson J (2003) Generalized discriminant analysis based on distances. Aust NZ J Stat 45: 301−318 Anderson MJ, ter Braak CJF (2003) Permutation tests for multifactorial analysis of variance. J Statist Comput Sim-ulation 73: 85−113
Anderson MJ, Connell SD, Gillanders MB, Diebel CE, Blom WM, Saunders JE, Lander TJ (2005) Relationships be -tween taxonomic resolution and spatial scales of multi-variate variation. J Anim Ecol 74: 636−646
Anderson MJ, Gorley RN, Clarke KR (2008) PERMANOVA+ for PRIMER: guide to software and statistical methods. PRIMER-E, Plymouth
Attrill MJ, Strong JA, Rowden AA (2000) Are macroin -vertebrate communities influenced by seagrass struc-tural complexity? Ecography 23: 114−121
Badalamenti F, Cantone G, Domina R, Di Pietro N, Catalano D, Mollica E, D’Anna G (1999) Primi dati sulla fauna a policheti di substrato duro dell’infralitorale fotofilo supe-riore dell’isola di Ustica. Biol Mar Medit 6: 230−236 Bell JD, Harmelin-Vivien ML (1983) Fish fauna of French
Mediterranean Posidonia oceanica seagrass meadows. 2. Feeding habits. Tethys 11: 1−14
Bellan-Santini D (1980) Relationship between populations of amphipods and pollution. Mar Pollut Bull 11: 224−227 Bellan-Santini D (1998) Ecology. In: Ruffo S (ed) The
Amphipoda of the Mediterranean. Part 4. Mémoires de l’Institut océanographique 13: 869−893
Benedetti-Cecchi L (2001) Variability in abundance of algae and invertebrates at different spatial scales on rocky sea shores. Mar Ecol Prog Ser 215: 79−92
Bianchi CN, Morri C (2006) Piano di gestione e regolamen-tazione dell’AMP di Tavolara-Punta Coda Cavallo. Prog-etto per la realizzazione di cartografia tematica del terri-torio marino. Tavolara-Punta Coda Cavallo MPA, Olbia Borja A, Franco J, Pérez V (2000) A marine biotic index to establish the ecological quality of soft-bottom benthos within European estuarine coastal environments. Mar Pollut Bull 40: 1100−1114
Boudouresque CF, Caltagirone A, Lefevre JR, Rico V, Sem-roud R (1992) Macrozoobenthos de la reserve naturelle de Scandola (Corse, Méditerranée nord-occidentale). Analyse pluriannuelle de ‘l’effet réserve’. In: Olivier J, Gérardin N, Jeudy de Grissac A (eds) Impact écono -mique des espaces côtiers protégés de Méditerranée. MedPAN News 3, Ajaccio, p 15–20
Boudouresque CF, Bernard G, Bonhomme P, Charbonnel E and others (2006) Préservation et conservation des her-biers à Posidonia oceanica. Ramoge, Marseille
Bussers JC, Poulicek M, Diepvints J (1983) Description d’une suceuse à air comprimé économique et utilisable par un seul plongeur. Cah Biol Mar 24: 215−217
Chapman MG, Tolhurst TJ, Murphy RJ, Underwood AJ (2010) Complex and inconsistent patterns of variation in benthos, micro-algae and sediment over multiple spatial scales. Mar Ecol Prog Ser 398: 33−47
Chemello R, Milazzo M, Nasta E, Riggio S (1999) Study of the malacofauna from photophilic algae in the Marine Reserve of Ustica Island (Northern Sicily, Italy). Biol Mar Medit 6: 247−249
Clarke KR, Warwick RM (2001) Change in marine commu-nities: an approach to statistical analysis and interpreta-tion, 2ndedn. PRIMER-E, Plymouth
Claudet J (2011) Marine protected areas: a multidisciplinary approach. Biodiversity and Conservation Series. Cam-bridge University Press, CamCam-bridge
Claudet J, Guidetti P, Mouillot D, Shears NT, Micheli F (2011) Ecological effects of marine protected areas: con-servation, restoration and functioning. In: Claudet J (ed) Marine protected areas: a multidisciplinary approach. Cambridge University Press, Cambridge, 37–71 Como S, Magni P, Baroli M, Casu D, De Falco G, Floris A
(2008) Comparative analysis of macrofaunal species rich-ness and composition in Posidonia oceanica, Cymodocea nodosa and leaf litter beds. Mar Biol 153: 1087−1101 Conlan KE (1994) Amphipod crustaceans and
environmen-tal disturbance: a review. J Nat Hist 28: 519−554 Connolly RM (1995) Effects of removal of seagrass canopy
on assemblages of small, motile invertebrates. Mar Ecol Prog Ser 118: 129−137
Conradi M, López-González PJ (2001) Relationships be -tween environmental variables and the abundance of peracarid fauna in Algeciras Bay (Southern Iberian Peninsula). Cienc Mar 27: 481−500
Conradi M, López-González PJ, García-Gómez JC (1997) The amphipod community as a bioindicator in Algeciras Bay (Southern Iberian Peninsula) based on a spatio-tem-poral distribution. Mar Ecol 18: 97−111
Consorzio di Gestione Area Marina Protetta Tavolara-Punta Coda Cavallo (2006) Piano di gestione. A: Quadro di riferimento ambientale, Consorzio di Gestione Area Marina Protetta Tavolara-Punta Coda Cavallo, Olbia Costa FO, Costa MH (1999) Life history of the amphipod
Gammarus locusta in the Sado estuary (Portugal). Acta Oecol 20: 305−314
Crain CM, Halpern BS, Beck MW, Kappel C (2009) Under-standing and managing human threats to the coastal marine environment. Ann N Y Acad Sci 1162: 39−62 Dauvin JC (1987) Evolution à long terme (1978−1986) des
populations d’amphipodes des sables fins de la Pierre Noire (Bale de Morlaix, Manche Occidentale) après la ca-tastrophe de l’Amoco Cadiz. Mar Environ Res 21: 247−273 Dauvin JC, Ruellet T (2007) Polychaete/amphipod ratio
revisited. Mar Pollut Bull 55: 215−224
Author
copy
➤
➤
➤
➤
➤
➤
➤
➤
➤
➤
➤
➤
➤
➤
➤
➤
➤
De Biasi AM, Benedetti-Cecchi L, Pacciardi L, Maggi E, Vaselli S, Bertocci I (2003) Spatial heterogeneity in the distribution of plants and benthic invertebrates in the lagoon of Orbetello (Italy). Oceanol Acta 26: 39−46 De-la-Ossa-Carretero JA, Del-Pilar-Ruso Y,
Giménez-Casalduero F, Sánchez-Lizaso JL, Dauvin JC (2012) Sen-sitivity of amphipods to sewage pollution. Estuar Coast Shelf Sci 96: 129−138
Di Franco A, Bussotti S, Navone A, Panzalis P, Guidetti P (2009) Evaluating effects of total and partial restrictions to fishing on Mediterranean rocky-reef fish assemblages. Mar Ecol Prog Ser 387: 275−285
Edgar GJ, Robertson AI (1992) The influence of seagrass structure on the distribution and abundance of mobile epifauna: patterns and process in a Western Autralian Amphibolis bed. J Exp Mar Biol Ecol 160: 13−31
Francour P (2000) Evolution spatio-temporelle à long terme des peuplements de poissons des herbiers à Posidonia oceanica de la réserve naturelle de Scandola (Corse, Méditerranée Nord-Occidentale). Cybium 24: 85−95
Francour P, Harmelin JG, Pollard D, Sartoretto S (2001) A review of marine protected areas in the northwestern Mediterranean region: siting, usage, zonation and man-agement. Aquat Conserv 11: 155−188
Fraschetti S, Terlizzi A, Bussotti S, Guarnieri G, D’Ambrosio P, Boero F (2005) Conservation of Mediterranean sea-scapes: analyses of existing protection schemes. Mar Environ Res 59: 309−332
Gambi MC, Buia MC, Casola E, Scardi M (1989) Estimates of water movement in Posidonia oceanica beds: a first approach. In: Boudouresque CF, Meinesz CF, Fresi E, Gravez V (eds) International workshop on Posidonia beds, Vol 2. GIS Posidonie, Marseille, p 101–112 Gambi MC, Lorenti M, Russo GF, Scipione MB, Zupo V
(1992) Depth and seasonal distribution of some groups of the vagile fauna of the Posidonia oceanica leaf stratum: structural and trophic analyses. Mar Ecol 13: 17−39 García-Charton JA, Pérez-Ruzafa A (1999) Ecological
het-erogeneity and the evaluation of the effects of marine reserves. Fish Res 42: 1−20
García-Charton JA, Williams ID, Pérez-Ruzafa A, Milazzo M and others (2000) Evaluating the ecological effects of Mediterranean marine protected areas: habitat, scale and the natural variability of ecosystems. Environ Con-serv 27: 159−178
García-Charton JA, Pérez-Ruzafa A, Sánchez-Jerez P, Bayle-Sempere JT, Reñones O, Moreno-Lampreave D (2004) Multi-scale spatial heterogeneity, habitat struc-ture, and the effect of marine reserves on Western Medi-terranean rocky reef fish assemblages. Mar Biol 144: 161−182
Gobert S, Kyramarios M, Lepoint G, Pergent-Martini C, Bouquegneau JM (2003) Variations at different spatial scales of Posidonia oceanica (L) Delile beds; effects on the physico-chemical parameters of the sediment. Oceanol Acta 26: 199−207
Gobert S, Cambridge ML, Velimirov B, Pergent G and oth-ers (2006) Biology of Posidonia. In: Larkum AWD, Orth RJ, Duarte CM (eds) Seagrasses: biology, ecology and conservation. Springer, Dordrecht, p 387–408
González AR, Guerra-García JM, Maestre MJ, Ruiz-Tabares A and others (2008) Community structure of caprellids (Crustacea: Amphipoda: Caprellidae) on seagrasses from southern Spain. Helgol Mar Res 62: 189−199
Graham MH (2003) Confronting multicollinearity in eco -logical multiple regression. Ecology 84: 2809−2815 Guerra-García JM, García-Gómez JC (2001) The spatial
dis-tribution of Caprellidea (Crustacea: Amphipoda): a stress bioindicator in Ceuta (North Africa, Gibraltar area). Mar Ecol 22: 357−367
Guerra-García JM, Corzo J, Asencio I, García-Gómez JC (2000) Seasonal fluctuations of Phtisica marina Slabber (Crustacea: Amphipoda: Caprellidea) in the estuarine zone of Southern Spain. Pol Arch Hydro-biol 47: 527−531
Guerra-García JM, Corzo J, García-Gómez JC (2002) Cling-ing behaviour of the Caprellidea (Amphipoda) from the Strait of Gibraltar. Crustaceana 75: 41−50
Guidetti P (2006) Marine reserves reestablish lost predatory interactions and cause community changes in rocky reefs. Ecol Appl 16: 963−976
Halpern BS (2003) The impact of marine reserves: Do reserves work and does reserve size matter? Ecol Appl 13: 117−137
Hemminga MA, Duarte CM (2000) Seagrass ecology. Cam-bridge University Press, CamCam-bridge
Jennings S, Boullé DP, Polunin NVC (1996) Habitat corre-lates of the distribution and biomass of Seychelles’ reef fishes. Environ Biol Fishes 46: 15−25
Jimeno-Fernandez A (1993) Contribucion al estudio de los Anfipodos de las costas mediterranean catalanas. Tesis doctoral, Universitat de Barcelona
Jongman RHG, ter Braak CJF, van Tongeren OFR (1995) Data analysis in community and landscape ecology. Cambridge University Press, Cambridge
Kolasa J, Pickett STA (1991) Ecological heterogeneity. Eco-logical Studies 86, Springer, New York, NY
Krapp-Schickel T, Vader W (1998) What is, and what is not, Caprella acanthifera Leach, 1814 (Amphipoda, Caprel-lidea)? Part 1: the acanthifera-group. J Nat Hist 32: 949–967
Langlois TJ, Anderson MJ, Babcock RC (2005) Reef associ-ated predators influence adjacent soft-sediment commu-nities. Ecology 86: 1508−1519
Legendre P, Anderson MJ (1999) Distance-based redun-dancy analysis: testing multispecies responses in multi-factorial ecological experiments. Ecol Monogr 69: 1−24 Lester SE, Halpern BS, Grorud-Colvert K, Lubchenco J and
others (2009) Biological effects within no-take marine reserves: a global synthesis. Mar Ecol Prog Ser 384: 33−46
Lubchenco J, Palumbi SR, Gaines SD, Andelman S (2003) Plugging a hole in the ocean: the emerging science of marine reserves. Ecol Appl 13: 3−S7
Mazzella L, Scipione MB, Buia MC (1989) Spatio-temporal distribution of algal and animal communities in a Posido-nia oceanica meadow. Mar Ecol 10: 107−129
McArdle BH, Anderson MJ (2001) Fitting multivariate mod-els to community data: a comment on distance-based redundancy analysis. Ecology 82: 290−297
McClanahan TR (1989) Kenyan coral reef-associated gastro-pod fauna: a comparison between protected and unpro-tected reefs. Mar Ecol Prog Ser 53: 11−20
McClanahan TR (1990) Kenyan coral reef-associated gastro-pod assemblages: distribution and diversity patterns. Coral Reefs 9: 63−74
McClanahan TR (1995) Fish predators and scavengers of the sea urchin Echinometra mathaei in Kenyan coral-reef marine parks. Environ Biol Fishes 43: 187−193


![Table 2. Nested ANOVA for amphipod general descriptors (total density, total biomass, number of species, and diversity [Shannon-Wiener H’]) in 2007 and 2008](https://thumb-eu.123doks.com/thumbv2/123doknet/6261746.163213/7.918.462.827.119.714/nested-amphipod-general-descriptors-density-diversity-shannon-wiener.webp)
![Table 3. Nested ANOVA for the density of the most frequent amphipod taxa (frequency [f] ≥ 10%) in the TMPA in 2007 and 2008](https://thumb-eu.123doks.com/thumbv2/123doknet/6261746.163213/8.918.91.827.163.1117/table-nested-anova-density-frequent-amphipod-frequency-tmpa.webp)