HAL Id: hal-00935620
https://hal.archives-ouvertes.fr/hal-00935620
Submitted on 23 Jan 2014
HAL is a multi-disciplinary open access
archive for the deposit and dissemination of
sci-entific research documents, whether they are
pub-L’archive ouverte pluridisciplinaire HAL, est
destinée au dépôt et à la diffusion de documents
scientifiques de niveau recherche, publiés ou non,
Bosc, Vincent Ricordel
To cite this version:
Marcus Barkowsky, Junle Wang, Josselin Gautier, Olivier Le Meur, Emilie Bosc, et al.. Perceptual
Assessment: Final tests and Analysis.. 2013, pp.21. �hal-00935620�
n◦ ANR-09-BLAN-0170
Livrable D6.3 01/07/2013
Perceptual Assessment:
Final tests and Analysis.
Marcus BARKOWSKY IRCCyN
Junle WANG IRCCyN
Josselin GAUTIER IRISA
Olivier LE MEUR IRISA
Emilie BOSC INSA
Contents
1 Introduction 3
2 Evaluation of free viewpoint video sequences synthesized from decompressed depth data 3
2.1 Experimental conditions . . . 3
2.1.1 Experimental material . . . 4
2.1.2 Assessment conditions . . . 5
2.2 Analysis of subjective quality assessment . . . 6
2.2.1 View synthesis modes . . . 7
2.2.2 Content characteristics . . . 10
2.2.3 Depth map coding algorithms . . . 10
2.3 Analysis of objective quality assessment . . . 11
2.3.1 Correlation between objective metrics and perceived quality . . . 12
2.3.2 Scope of validity of the objective metrics . . . 15
2.3.3 View synthesis modes . . . 15
2.3.4 Content characteristics . . . 17
2.3.5 Depth map compression algorithms . . . 18
2.4 Conclusion and Future work . . . 19
1 Introduction
This document completes and finalizes the presentation of perceptual tests and their analysis which have been done for the project PERSEE.
Exactly the report details the evaluation of free viewpoint video sequences synthesized from decompressed depth data.
2 Evaluation of free viewpoint video sequences
synthesized from decompressed depth data
In this section, a subjective assessment protocol of the impact of depth compression on perceived image quality in a free-viewpoint television scenario is achieved. The remainder of this section has been published in the Fifth International Workshop on
Quality of Multimedia Experiences, QoMex 2013 as [1] and another part of these
anal-yses has been submitted to Elsevier Journal of Visual Communication and Image in the special issue QoE in 2D-3D Video System as [4].
This study considers depth maps compression only (and not color view compression, as in a classical scenario) as it has been shown that depth compression has a critical impact on the quality of synthesized views. The proposed protocol is expected to enable the evaluation of different types of depth coding distortions and includes the depth coding methods developed in the framework of PERSEE project.
In the remainder of this section, the proposed methodology used in this case study to evaluate the performance of different compression algorithms is presented in 2.1. In 2.2, an analysis of the obtained subjective scores is given, as for validation of the reliability of the methodology. In 2.3, the correlation between subjective scores and objective quality measurements is discussed. Finally, concluding remarks are given in 2.4.
2.1 Experimental conditions
This subsection presents the experimental conditions. Part 2.1.1 present the material, i.e. the depth coding methods under test. Part 2.1.2 presents the assessment conditions used for the test.
2.1.1 Experimental material
In this part, the proposed experimental protocol for assessing the performances of different coding methods in the context of MVD data compression is presented. This experimental protocol involved the generation and the quality assessment of syn-thesized views in a FTV scenario. Only the depth maps were encoded as for an example of evaluation of depth coding algorithms. Depth coding only is targeted and not color coding as in the real use case because the goal is to provide an assessment protocol able to underline the impact of depth coding only on the synthesized views. The general scheme followed in this experiment is depicted in Figure 1. From a given MVD sequence, two different viewpoints at one time instant t (also referred to as key frames in the following) were considered. The associated depth maps were encoded through seven depth map codecs under test. From the decoded depth maps, fifty inter-mediate viewpoints (equally separated) were generated in-between the two considered viewpoints. A sequence of 100 frames (at 10 fps) was built from the 50 intermediate virtual frames to simulate a smooth camera motion from left to right and from right to left. This experimental protocol is expected to reveal the distortion specificity of each compression strategy. Depth map codecs under test are labeled from C1 to C7, where C1 to C4 are state-of-the-art coding algorithms andC5, C6 and C7 have been developed in the framework of the PERSEE project. The list of depth coding methods under test is as follows :
• C1: 3D-HEVC Test Model, 3D-HTM 0.4 [10], inter-view prediction and View
Synthesis Optimization enabled.
• C2: Multiview Video Coding (MVC), JM 18.4 [12]. • C3: HEVC Test Model, HM 6.1 [11].
• C4: JPEG2000, Kakadu implementation [13].
• C5: based on [6], a lossless-edge depth map coding based on optimized path and fast homogeneous diffusion.
• C6: based on [15], this algorithm exploits the correlation with color frames. • C7: Z-LAR-RP [3], a region-based algorithm.
All coding algorithms were used in intra coding mode. Three quantization parameters were selected for each depth map codec under test according to the visual quality of the rendered views. This procedure was motivated by the need to cover a wide range of categories in the visual quality scale to properly assess each codec under test. Six MVD contents were used in these experiments: Book Arrival, Newspaper, Kendo, and
Method Effects on depth maps Effects on synthesized views C1 scattered blocking effect staircase effect on object edges
C2 blur inaccurate edges
C3 blur inaccurate edges
C4 blurred, ringing edges deformed edges, crumbling edges
C5 blur, introduction of gradients deformed objects
C6 blocking effect blocking effect around edges
C7 smooth depth fading reduced parallax
F blur deformed objects
FE blurred edges inaccurate edges
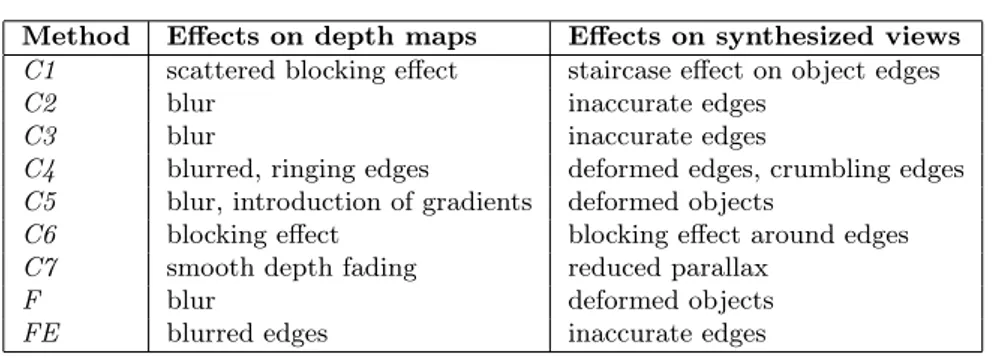
Table 1: Impact of coarse quantization on data quality.
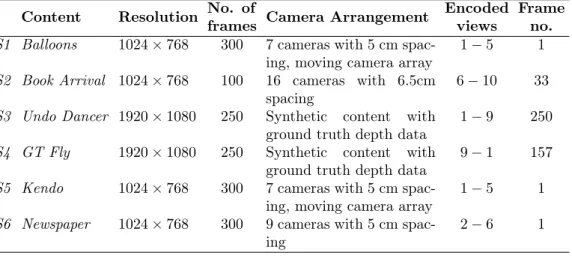
Balloons are real scenes; and GT Fly and Undo Dancer are synthetic scenes. The
char-acteristics of the contents are summarized in Table 2. The contents and the key frames were selected for their availability and amount of depth. The encoded viewpoints are given in Table 2. Two additional methods were also included to increase the variety of distortions: low pass filtered depth maps (noted F ) and depth maps with low-pass filtered applied on edges only (noted FE ). Table 1 provides our observations regarding the specific distortions of each method, when using a coarse quantization. First column indciates the effects of coarse compression on depth maps. Second column indicates the resulting effects on views synthesized from this decompressed depth data. The depth compression related artifacts mostly affect the strong depth gradients (object edges) which results in flickering around the object edges in the synthesized sequence. Two different synthesis modes were considered. The synthesis process was performed through the 3D-HTM 0.4 renderer, also referred to as VSRS-1D-Fast, which is the view synthesis algorithm used by the Joint Collaborative Team on 3D Video Coding Extension Development (JCT-3V) at the time of writing this paper. Two different modes for the view synthesis, referred to as VS1 and VS2 in the rest of the paper, were considered:
• V S1: Blended Mode disabled. All pixels visible in the closer reference view are copied to the virtual view, and only hole areas are filled from the farther reference view.
• V S2: Blended Mode enabled. A weighted blending based on the baseline distance is used for hole filling. So pixels from the reference camera that are closer to the virtual view are assigned a higher weight.
2.1.2 Assessment conditions
The ACR-HR [14] methodology was used to assess 276 FVV sequences. The ACR-HR methodology [14] consists in presenting each stimulus only once to the observers, who
Figure 1: Overview of the experimental protocol.
Table 2: MVD contents used in the experiments.
Content Resolution No. of Camera Arrangement Encoded Frame
frames views no.
S1 Balloons 1024 × 768 300 7 cameras with 5 cm spac-ing, moving camera array
1 − 5 1
S2 Book Arrival 1024 × 768 100 16 cameras with 6.5cm spacing
6 − 10 33
S3 Undo Dancer 1920 × 1080 250 Synthetic content with ground truth depth data
1 − 9 250
S4 GT Fly 1920 × 1080 250 Synthetic content with ground truth depth data
9 − 1 157
S5 Kendo 1024 × 768 300 7 cameras with 5 cm spac-ing, moving camera array
1 − 5 1
S6 Newspaper 1024 × 768 300 9 cameras with 5 cm spac-ing
2 − 6 1
are asked to rate the quality of the stimuli using a five-level quality scale (5: Excellent; 4: Good ; 3: Fair ; 2: Poor ; 1: Bad ). The reference version of each stimulus is included in the test procedure and rated like any other stimulus. This is referred to as a hidden reference condition. The subjective evaluations were conducted in an ITU conforming test environment. The stimuli were displayed on a Panasonic BT-3DL2550 screen (1920×1080p), and according to ITU-T BT.500 [5]. Twenty-seven naive observers participated in the subjective quality evaluation test into two 30-minutes sessions. All subjects underwent a screening to examine their visual acuity, color vision, and stereo vision. Four subjects were detected as outliers and all their scores were removed from the results.
2.2 Analysis of subjective quality assessment
In this section, the results of statistical analyses of the obtained subjective scores are provided. Mean opinion scores (MOS) and differential mean opinion score (DMOS) were computed between each stimulus and its corresponding (hidden) reference. As
recommended in VQEG multimedia Test Plan [18], the DMOS were computed on a per subject per processed stimulus (PS) basis. The corresponding reference version of the stimulus (SRC) was used to compute an off-set version of the DMOS value for each PS following the expression:
DM OS(P S) = M OS(P S) − M OS(SRC) + 5
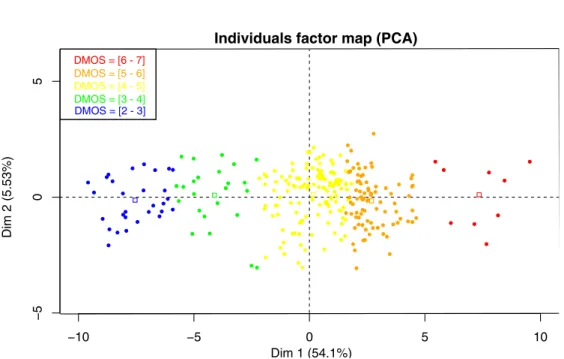
Since it can be difficult to interpret in details the DMOS values, we suggest to rely on statistical tools for further understanding. From the raw subjective scores, a statistical analysis was performed using principal component analysis (PCA) and analysis of variance (ANOVA). Indeed, the ANOVA allows to know if differences between the means of the considered groups are significant (i.e., due to influence of view synthesis mode, content features, or compression algorithm) or simply due to chance. The goal of the PCA is to express the pattern of similarity of the observations (i.e., compression algorithm generating the same perceived quality, etc.) as points in maps. The results of the PCA are shown in Figure 2 to Figure 5. In these figures, each point represent a stimulus. The points in Figure 2, Figure 3, Figure 4, and Figure 5 have different colors according to the view synthesis mode, content, and depth map compression algorithm, respectively. In Figure 2, the points are colored depending on their DMOS values. As it can be observed in Figure 2, the stimuli obtaining the lowest DMOS (left part) are opposed to those obtaining the highest DMOS (right part). In the legend of Figure 2, the mentioned categories do not correspond to the classical 5-scaled categories of ACR-HR. They correspond to quintiles from the distribution of the obtained DMOS values. So the blue points correspond to the quintile with the lowest DMOS values (ranged in [2−3]) and the red points correspond to the quintile with the largest DMOS values (ranged in [6 − 7]). The first two components of the PCA resumed 59.6% of the total inertia, i.e., the total variance of the dataset (the first axis resumed 54.1% of the total inertia with an eigenvalue of 12.44 while the second resumed 5.53% of the total inertia with an eigenvalue of 1.27). Our observations showed that the stimuli obtaining the lowest DMOS (left part) are opposed to those obtaining the highest DMOS (right part). The confidence ellipses for the population means are plotted for each category. These confidence ellipses are plotted to visualize the variability of the population means (i.e., the centers of gravity). Non-overlapping ellipses indicate that groups are significantly different.
The results are discussed in the following subsections.
2.2.1 View synthesis modes
The individual factor map from the PCA according to the view synthesis mode is shown in Figure 3. The confidence ellipses indicate whether the categories (VS1 and
VS2 ) are significantly different from each other. It can be observed that although
−10 −5 0 5 10
−5
0
5
Individuals factor map (PCA)
Dim 1 (54.1%) D im 2 (5 .5 3 % ) DMOS = [2 - 3] DMOS = [6 - 7] DMOS = [4 - 5] DMOS = [5 - 6] DMOS = [3 - 4]
Figure 2: PCA plot with graphical emphasis on the DMOS values obtained by each stimulus.
Figure 4: PCA plot with graphical emphasis on the sequences.
ellipse centroid is located in the right part of the graph, which indicates that VS1 generally obtained higher DMOS values and thus the perceived quality was higher. These results show that the proposed assessment methodology allows the evaluation of different view synthesis algorithms.
2.2.2 Content characteristics
The individual factor map from the PCA according to the content is shown in Figure 4. A clear distinction between Undo Dancer and the other contents of the dataset can be observed. The ellipse centroid is located in the left part of the graph, which indicates that Undo Dancer generally obtained the lowest DMOS values. This con-tent was computer-generated and contains a human being dancing. Therefore, it was assumed that subjects are sensitive to human beings representations and may rate se-quences with low scores if these representations are not realistic enough. In fact, in the considered content, the motion of the human body may not be faithful enough even in the original sequence. So, a bias may have been introduced by these conditions. The importance of content selection choices when evaluating visual quality is pointed out by this observation.
The results of the ANOVA are given in Table 3. Contents Ballons and Kendo have equal means according to ANOVA and it can be also observed that their confidence ellipses cross each other on the PCA plot (see Figure 4). Contents GT Fly and
News-paper have equal means according to ANOVA.
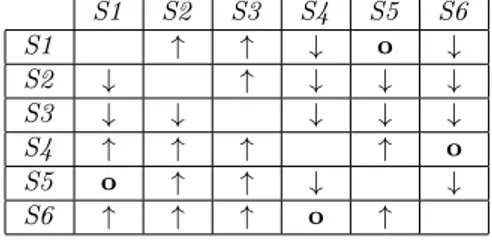
Table 3: Results of the ANOVA test. p-value: 0 - F-value: 491.41 - Legend:↑: superior, ↓: inferior, o: statistically equivalent. Reading: Line “1” is statistically superior to column “2”.
S1 S2 S3 S4 S5 S6 S1 ↑ ↑ ↓ o ↓ S2 ↓ ↑ ↓ ↓ ↓ S3 ↓ ↓ ↓ ↓ ↓ S4 ↑ ↑ ↑ ↑ o S5 o ↑ ↑ ↓ ↓ S6 ↑ ↑ ↑ o ↑
2.2.3 Depth map coding algorithms
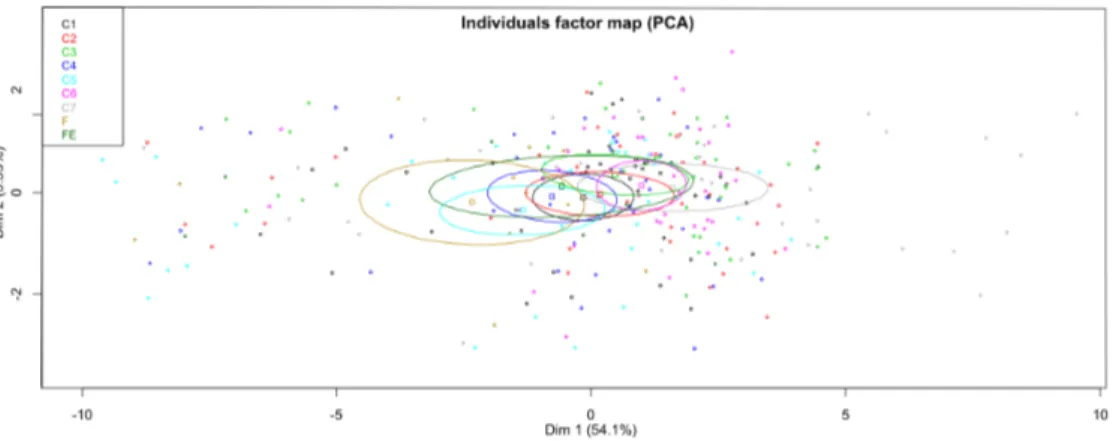
The individual factor map from the PCA according to the depth map compression algorithm is shown in Figure 5. The location of the ellipses centroid can provide a ranking of the methods performances, based on the PCA: the location of C7 centroid suggests that the artifacts induced by C7 were the less disturbing ones. The results of the ANOVA are given inTable 4 to improve the interpretation of the results. C1
is statistically equivalent to state-of-the-art coding algorithms (C2 to C4 ). C6 and
C7, which are based on the same scheme basis, obtain similar means. An interesting
remark lies in the fact that FE obtains equal means compared to three state-of-the-art methods (C1, C2, and C4 ) and to C5, which suggests that the state-of-the-artifacts induced by FE were rated similarly to these methods. These results show that the proposed experimental protocol (assessment of FVV generated from decompressed depth data) allows the evaluation of different depth map compression algorithms.
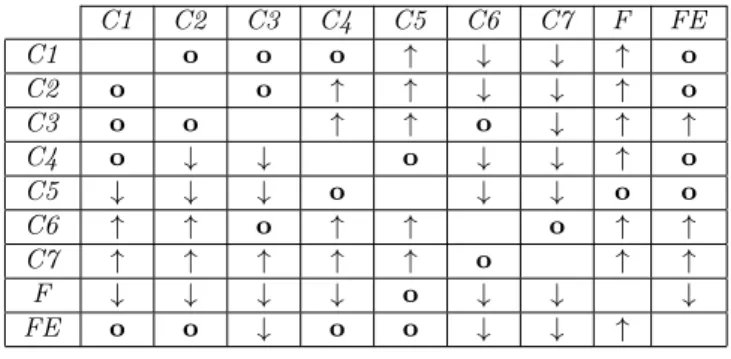
Table 4: Results of the ANOVA test. p-value: 2.39×10−56 - F-value: 36.07 -Legend:↑: superior, ↓: inferior, o: statistically equivalent. Reading: Line “1” is statistically superior to column “5”. C1 C2 C3 C4 C5 C6 C7 F FE C1 o o o ↑ ↓ ↓ ↑ o C2 o o ↑ ↑ ↓ ↓ ↑ o C3 o o ↑ ↑ o ↓ ↑ ↑ C4 o ↓ ↓ o ↓ ↓ ↑ o C5 ↓ ↓ ↓ o ↓ ↓ o o C6 ↑ ↑ o ↑ ↑ o ↑ ↑ C7 ↑ ↑ ↑ ↑ ↑ o ↑ ↑ F ↓ ↓ ↓ ↓ o ↓ ↓ ↓ FE o o ↓ o o ↓ ↓ ↑
2.3 Analysis of objective quality assessment
This subsection presents the results of statistical analyses that aim at determining the existence of a correlation between the obtained subjective scores and the correspond-ing objective scores. The results presented in the followcorrespond-ing have been submitted for publication to Elsevier Journal of Visual Communication and Image in the special issue QoE in 2D-3D Video System as [4]. A PCA was applied on the DMOS and the objective quality scores of the stimuli. In the following, various aspects regarding the correlation and agreement between subjective and objective scores are discussed. Subjective evaluations are time consuming, expensive, and not always feasible. There-fore, objective quality assessment tools are needed as well, especially to assess advances in the design of coding technologies. Objective metrics have been designed to predict the perceived quality of media content based on modeling of the human visual system. The use of objective quality metrics is often preferred to subjective quality assessment, for example by researchers working on image and video compression, as it is easier to apply an objective metric than to perform a subjective evaluation. However, objective metrics might not be correlated with human perception of visual quality. In this study, the performance of the following objective metrics in predicting image quality of FVV sequences was assessed:
1. PSNR: Peak Signal-to-Noise Ratio, 2. SSIM: Structural Similarity Index [19],
3. MS-SSIM: Multi-Scale Structural Similarity Index [20], 4. VIF: Visual Information Fidelity [16],
5. VIFP: Visual Information Fidelity, pixel domain version [16], 6. UQI: Universal Quality Index [21],
7. IFC: Information Fidelity Criterion [17].
All above objective metrics were computed on the luma component of each frame of the FVV sequence and the resulting values were averaged across the frames to produce a global index for the entire FVV sequence. All objective metrics were computed using MeTriX MuX Visual Quality Assessment Package [2].
2.3.1 Correlation between objective metrics and perceived quality
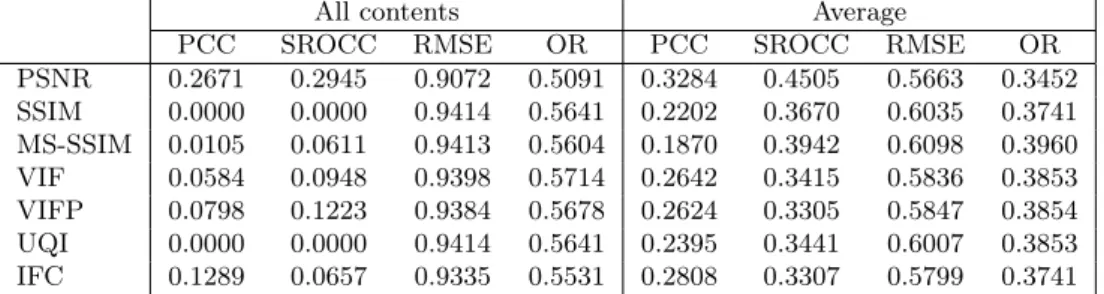
Table 5 reports the accuracy, consistency, and monotonicity indexes, for the cubic fitting. A fitting was applied in two different ways:
• on all contents at once, • on each content separately.
In the latter case, the performance indexes were computed separately on each content and then averaged across contents. When the fitting was applied on all contents at once, the correlation was lower than 0.15 for all metrics, except for PSNR, which showed a correlation around 0.3. The RMSE was around 0.9 for all metrics. The OR was higher than 55% on all metrics. These results show that there is almost no correlation between objective metrics and perceived quality. Note that the correlation for SSIM and UQI is null, which is due to the fact that the cubic fitting was constrained to be monotonic on the interval of observed quality values whereas the non-fitted scores for these two metrics mostly showed a negative correlation with perceived quality. When the fitting was applied on each content separately, the obtained performance did marginally improved, as the PCC and SROCC scores are still in the range 0.18-0.33 and 0.18-0.33-0.45, respectively. The RMSE and OR decreased below 0.61 and 40%, respectively. However, these results still lead to the conclusion that there is almost no correlation between objective metrics and perceived quality.
Table 5: Accuracy, consistency, and monotonicity indexes for the different metrics.
All contents Average
PCC SROCC RMSE OR PCC SROCC RMSE OR
PSNR 0.2671 0.2945 0.9072 0.5091 0.3284 0.4505 0.5663 0.3452 SSIM 0.0000 0.0000 0.9414 0.5641 0.2202 0.3670 0.6035 0.3741 MS-SSIM 0.0105 0.0611 0.9413 0.5604 0.1870 0.3942 0.6098 0.3960 VIF 0.0584 0.0948 0.9398 0.5714 0.2642 0.3415 0.5836 0.3853 VIFP 0.0798 0.1223 0.9384 0.5678 0.2624 0.3305 0.5847 0.3854 UQI 0.0000 0.0000 0.9414 0.5641 0.2395 0.3441 0.6007 0.3853 IFC 0.1289 0.0657 0.9335 0.5531 0.2808 0.3307 0.5799 0.3741
Table 6: Statistical analysis of the different metrics.
PSNR SSIM MS-SSIM VIF VIFP UQI IFC
PSNR 6=6=== 6=6=== 6=6=== 6=6=== 6=6=== =6=== SSIM 6=6=== =6=== =6=== =6=== =6=== =6=== MS-SSIM 6=6=== =6=== ==== ==== =6=== ==== VIF 6=6=== =6=== ==== ==== =6=== ==== VIFP 6=6=== =6=== ==== ==== =6=== ==== UQI 6=6=== =6=== =6=== =6=== =6=== =6=== IFC =6=== =6=== ==== ==== ==== =6===
Each entry in the table corresponds to the results of the statistical tests performed on the following performance indexes (from left to right): PCC, SROCC, RMSE, and OR. = means that there was no
significant difference between the two metrics, whereas 6= means that the difference was significant. Reading: Line 2, column 4: SSIM and VIF are statistically different according to SROCC, whereas they
are similar according to the other performance indexes.
When the fitting was applied on all contents at once, PSNR seems to outperform other metrics, even though the correlation was still very low. To determine if the difference between PSNR and the other metrics is significant, statistical tests were performed according to [8]. Table 6 reports the results of the statistical tests for the cubic fitting. Each entry in the table corresponds to the results of the statistical tests performed on the following performance indexes (from left to right): PCC, SROCC, RMSE, and OR. The statistical tests were performed to determine whether the difference between two performance index values corresponding to two different metrics was statistically significant: = means that there was no significant difference between the two metrics, whereas 6= means that the difference was significant. The results showed that PSNR was statistically different from the other metrics according to the PCC and SROCC values, except for IFC.
Figure 6 shows the correlation between the obtained subjective scores and the corre-sponding objective scores. Figure 6(a) depicts the circle of correlations derived from the PCA. Figure 6(b) depicts the Pearson and Spearman correlation coefficients be-tween the DMOS and the objective scores. Only two components had an eigenvalue larger than 1 in the PCA. These components extracted 84% of the inertia.
−1.0 −0.5 0.0 0.5 1.0 −1. 0 −0. 5 0. 0 0. 5 1. 0
Variables factor map (PCA)
Dim 1 (71.41%) Dim 2 (13. 52%) PSNR SSIM VIF MS-SSIM VIFP UQI IFC DMOS
(a) PCA (b) Correlation
Figure 6: Circle of correlations and Pearson and Spearman correlation scores between DMOS and objective scores.
The circle of correlations allows the observation of correlations between variables and principal components. Each measured variable is represented as a vector. The vector length represents the combined strength of the relationships between measured variable and principal components. The vector direction indicates whether these relationships are positive or negative. Since the data is not perfectly represented by the only two principal components, the variables are positioned inside the circle of correlations. The closer the variable is to the circle, the more important it is to the principal components. The lower the angle between two measured variable’s vector representations, the higher their correlation. In Figure 6(a), it can be observed that the objective metrics are grouped, which shows that they are correlated with each others. However, the angle between most of the objective metrics and DMOS is large (close to π
2), which indicates
that subjective scores are not correlated to objective metrics. This is confirmed by the analyses of Pearson and Spearman correlation scores in Figure 6(b): these correlation scores are very low since they do not reach 0.3.
An other interesting observation concerns the contributions of the variables to the principal components in Figure 6(a). The variables for which the contribution value is larger than the average contribution for the first component are VIFP, VIF, SSIM, MS-SSIM, and PSNR. The only variable for which the contribution value is larger than the average contribution for the second component is DMOS. Correlation is different from agreement as argued in [7]. Considering the directions of the vectors in Figure 6(a), points in the upper part have large DMOS and those below have low DMOS in the corresponding individual factor map. Points in the left have low objective scores
and those in the right have large scores. So points showing the agreement between DMOS and objective scores should be located in upper right part and in the lower left part of the individuals factor map. In the following, qualitative supplementary data (view synthesis modes, contents, and depth map compression algorithms) will be considered and depicted in the individuals factor map. This aspect of agreement will be studied through the results of the PCA applied on the DMOS and the objective quality scores of the stimuli in the individuals factor map, in 2.3.3, 2.3.4, and 2.3.5.
2.3.2 Scope of validity of the objective metrics
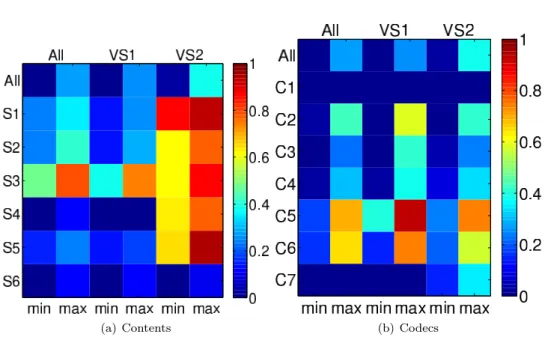
Huynh-Thu and Ghanbari [9] have shown that even PSNR can be a valid quality measure if the video content and the codec type are not changed. It is well-known that objective metrics can better handle some types of degradations and often fail when different types of degradations are combined. In this study, different views synthesis modes, contents, depth map compression algorithms, and bit rates were considered. The view synthesis mode had an impact on perceived quality and modified the behavior of a compression algorithms. Therefore, we benchmarked the different metrics on sub-groups of stimuli, where only one view synthesis mode and one codec were considered. The same analysis was performed with only one view synthesis mode and one compression algorithm. Figure 7 shows the minimum and maximum PCC values (across all metrics) for the different sub-groups. It can be observed that the correlation can be quite high when only VS2 is considered and the analysis is performed for each content separately (except for content S6, where the correlation remains very low).
Figure 8 depicts the accuracy, consistency, and monotonicity indexes when considering only content S1. The results show that there is almost no correlation between objective metrics and perceived quality when the views are not blended (VS1, see Figure8(b)) as the PCC value is lower than 0.25 on all metrics, whereas the correlation is very strong when the views are blended (VS2, see Figure8(c)) as the PCC value is higher than 0.8 on all metrics. These results show that the objective metrics can achieve a good correlation with perceived quality if content characteristics are considered, but cannot handle the artifacts produced by some view synthesis algorithms.
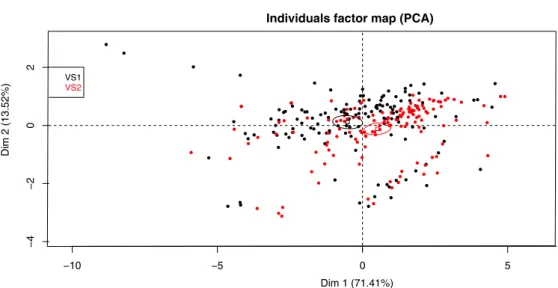
2.3.3 View synthesis modes
Figure 9 shows the individual factor map derived from the PCA with emphasis on the view synthesis modes. The agreement between DMOS and objective scores regarding the perceived quality of VS1 and VS2 related views should be represented as two separated clouds diametrically opposed in the upper right part and in the lower left part of the individual factor map, respectively. However, although the confidence
(a) Contents (b) Codecs
Figure 7: Minimum and maximum PCC values across all metrics for the different sub-groups.
Reading: Contents, line 4, columns 1 and 2: min(P CC) ≈ 0.5, max(P CC) ≈ 0.8 for content S3 when all synthesis modes are considered.
(a) VS1 and VS2 (b) VS1 only (c) VS2 only
Figure 8: Accuracy, consistency, and monotonicity indexes when considering only con-tent S1.
−10 −5 0 5
−4
−2
0
2
Individuals factor map (PCA)
Dim 1 (71.41%) Di m 2 (1 3. 52% ) VS1VS2
Figure 9: PCA plot with graphical emphasis on the synthesis modes.
ellipses are clearly non-overlapping and diametrically opposed (upper left part and lower right part), it can be observed that the two clouds are neither located in the expected parts of the plot. This indicates that the objective scores do not correctly express human perception difference between VS1 and VS2.
2.3.4 Content characteristics
Figure 10 shows the individual factor map derived from the PCA with emphasis on the contents. The confidence ellipses of contents S1, S4, and S5 are clearly located in the upper right part. This indicates that the objective scores obtained with these contents agree with the corresponding subjective scores. In addition, the centroid of content
S2 is close to the center of gravity of the whole set of stimuli. However, two contents
seem to involve disagreement between DMOS and objective scores: S3 (lower right part) and S6 (upper left part). Content S3, in particular, shows interesting results: we observed that contents with highly textured information, negative skew in the distribution of disparity values, and important depth discontinuities might be rated lower by observers. In this case, objective scores disagreed with human perception of visual quality regarding S3, which contains two highly textured major transversal planes for the wall and floor. As it can be observed, the range of objective scores corresponding to content S3 is similar to the range of objective scores corresponding to the other contents. However, a significant shift can be observed in the subjective scores. These observations show a clear disagreement between DMOS and objective scores for this content. However, as observed in Section 2.3.2, correlation between objective and subjective scores increased when only specific contents or compression
−10 −5 0 5 10
−4
−2
0
2
4 Individuals factor map (PCA)
Dim 1 (71.41%) Dim 2 (13. 52%) S1 S2 S3 S4 S5 S6
Figure 10: PCA plot with graphical emphasis on the contents.
algorithms were considered. In particular, when only the stimuli corresponding to content S3 were considered, the correlation increased form 0.3 to 0.8 (see Figure 7). These observations illustrate the difference between correlation and agreement, as argued in [7].
2.3.5 Depth map compression algorithms
Figure 11 shows the individual factor map derived from the PCA with emphasis on the depth map coding methods. The centroids of most of the depth map compression algorithms are located in the upper right part and in the lower left part of the individual factor map except for C7 (and F and FE, which are not depth map compression algorithms but additional conditions). C7 is located in the upper left part of the map. Considering the direction of the relationships between the variables in the circle of correlations, we can argue that generally the subjective and objective scores do not agree on the perceived quality of C7 related stimuli. As observed in ??, C7 induces a depth-fading-like distortion to ensure bit rate savings. This flattens the depth maps and involves a global scene shifting rather than motion parallax. Objective quality metrics that are mostly pixel-based methods can hardly predict perceived quality in this case. This explains the location of the centroid related to C7 in the upper left part of the individual map. Regarding the bit rates, the confidence ellipses for R0, R1, and R2 are non-overlapping and located in the upper right part, the center and the lower left part, respectively, as expected (the figure is not presented here).
−10 −5 0 5 10
−4
−2
0
2
4 Individuals factor map (PCA)
Dim 1 (71.41%) Dim 2 (13. 52%) C1 C2 C3 C4 C5 C6 C7 F FE
Figure 11: PCA plot with graphical emphasis on the compression algorithms.
2.4 Conclusion and Future work
This section presented the results of the subjective quality assessment protocol aiming at evaluating the impact of depth compression methods developed in the framework of PERSEE project, on perceived image quality of free-viewpoint data was presented. The considered stimuli consisted of free-viewpoint video sequences generated from decompressed data and simulating a smooth camera motion during a time freeze. Our experimental protocol allows the evaluation of different compression and view syn-thesis algorithms, according to the analyses of the resulting subjective scores revealed. ANOVA and PCA applied on the resulting subjective scores showed particular behav-iors such as the influence of different view synthesis modes on the performance of a specific compression algorithm. Objective scores were also computed and compared to subjective scores. They achieved low correlation with subjective scores when various conditions were considered. However, the correlation with perceived quality improved when content characteristics were considered. In addition, we assume that the arti-facts produced by some view synthesis algorithms might not be correctly handled by the objective quality metrics, according to the results.
In this subjective quality assessment experiment, only perceived image quality was evaluated. However, there are other factors to consider such as depth perception, in order to evaluate other aspects of FTV and correctly assess the depth coding methods developed in the framework of PERSEE project. Our experimental protocol should be also extended to stereoscopic viewing conditions through the assessment of stereoscopic free-viewpoint video sequences. Future work investigating these aspects should be considered.
References
[1] A quality assessment protocol for free-viewpoint video sequences synthesized from decompressed data. In QoMEX 2013, 2013.
[2] MeTriX MuX, last checked: 4/26/13. http://foulard.ece.cornell.edu/ gaubatz/metrix_mux/.
[3] E. Bosc. Compression of Multi-View-plus-Depth (MVD) data: from perceived
quality analysis to MVD coding tools designing. PhD thesis, INSA de Rennes,
October 2012.
[4] Emilie Bosc, Philippe Hanhart, Patrick Le Callet, and Touradj Ebrahimi. Meth-ods for assessing image quality in free-viewpoint television scenario: use case study on the impact of depth compression. Elsevier Journal of Visual Communication
and Image, 2013.
[5] ITU-T BT.500. Methodology for the subjective assessment of the quality of tele-vision pictures. International Telecommunication Union, Jan. 2012.
[6] J. Gautier, O. Le Meur, and C. Guillemot. Efficient depth map compression based on lossless edge coding and diffusion. In Picture Coding Symposium (PCS), pages 81–84, 2012.
[7] M. Haber and H.X. Barnhart. Coefficients of agreement for fixed observers.
Sta-tistical Methods in Medical Research, 15(3):255, June 2006.
[8] Philippe Hanhart, Pavel Korshunov, and Touradj Ebrahimi. Benchmarking of quality metrics on ultra-high definition video sequences. In 18th International
Conference on Digital Signal Processing, 2013.
[9] Q. Huynh-Thu and M. Ghanbari. Scope of validity of PSNR in image/video quality assessment. Electronics Letters, 44(13):800–801, June 2008.
[10] 3D-HTM [Online]. http://hevc.hhi.fraunhofer.de/. [11] HM [Online]. http://hevc.hhi.fraunhofer.de/. [12] JM [Online]. http://iphome.hhi.de/suehring/tml/. [13] Kakadu [Online]. http://www.kakadusoftware.com/.
[14] ITU-T P.910. Subjective video quality assessment methods for multimedia appli-cations. International Telecommunication Union, April 2008.
[15] F. Pasteau, C. Strauss, M. Babel, O. Déforges, and L. Bédat. Adaptive colour decorrelation for predictive image codecs. Proc. of EUSIPCO 2011, pages 1–5, 2011.
[16] H.R. Sheikh and A.C. Bovik. Image information and visual quality. IEEE
Trans-actions on Image Processing, 15(2):430–444, February 2006.
[17] H.R. Sheikh, A.C. Bovik, and G. De Veciana. An information fidelity criterion for image quality assessment using natural scene statistics. IEEE Transactions
on Image Processing, 14(12):2117–2128, 2005.
[18] VQEG. Final report from the video quality experts group on the validation of objective models of multimedia qualiy assessment, phase 1, 2008.
[19] Z. Wang, A.C. Bovik, H.R. Sheikh, and E.P. Simoncelli. Image quality assess-ment: from error visibility to structural similarity. IEEE Transactions on Image
Processing, 13(4):600–612, April 2004.
[20] Z. Wang, E.P. Simoncelli, and A.C. Bovik. Multiscale structural similarity for image quality assessment. In IEEE Asilomar Conference on Signals, Systems and
Computers, volume 2, pages 1398–1402, November 2003.
[21] Zhou Wang and A.C. Bovik. A universal image quality index. IEEE Signal