The Application of Value Stream Management Principles In a Batch Production Environment
Daniel J. Allison
B.S. Mechanical Engineering, Wichita State University (1996) M.S. Mechanical Engineering, Wichita State University (1999)
Submitted to Sloan School of Management and the Department of Civil and Environmental Engineering in partial fulfillment of requirements for the degrees of
Master of Business Administration And
Master of Science in Civil and Environmental Engineering In conjunction with the Leaders for Manufacturing Program at the
Massachusetts Institute of Technology June 2004
© 2004 Massachusetts Institute of Technology, 2004
All rights reserved
MASSACHUETTS INSTMTE OF TECHNOLOGY
JUL
0
12004
LIBRARIES
Signature of Author
Depa& oootf Civil Environmental Engineering Slo7 School of Management
# 0I04
Certified By
JonatJ *fnes, Thesis Advisor Department u iril and Eldvironmental Engineering
Certified By
Professor Deborah Niingale, isis Advisor Department of Aeronautics and Astronautics And Engeering Systems Division
Senior Lecturer Donald Rosenfield, Thesis Reader Sloan School of Management
Professor Cynthia Bf(nhart, Thesis Reader Department of Civil and Environmental Engineering
Mar aret Andrews, E cutive DiFrrLI -f Master's Program
I F1 Sloi School of Management
I-eidi Nepf, Chairman, Collmitt e for Graduate Students Certified By
Certified By
Accepted By
The Application of Value Stream Management Principles In a Batch Production Environment
Submitted to Sloan School of Management And the
Department of Civil and Environmental Engineering
On May 7, 2004 in partial fulfillment of requirements for the degrees of Master of Business Administration
And
Master of Science in Civil and Environmental Engineering
Abstract
The need for continuous improvement within a value stream is very necessary in today's business environment and can be one of the key sources of competitive advantage. As a company learns and implements the tools and practices of a Lean system, the underlying management and leadership methods become critical to sustaining fundamental
operational change. A Value Stream Manager provides this leadership and is responsible for increasing the ratio of value to non-value by eliminating waste in the overall value chain from start to finish.
The scope of the responsibilities of a value stream manager should cover at least two domains. First is the plant domain, that improves the value stream between the four walls of the plant; including the inbound and outbound logistics to/from the plant. The second domain is to consider the value stream at the level. At the enterprise-level, the value stream manager is responsible for eliminating waste throughout the extended value stream, including channel partners such as suppliers and customers. This thesis will examine the operations of the ABB Wessel Cable plant in Longford, Ireland and analyze the application of Value Stream Management principles during a six and a half month internship period. By involving all the employees at ABB Wessel we were able to reduce WIP and Finished good levels down to historic lows holding scrap below 4% and increase overall equipment effectiveness by almost 30%. By
concentrating on velocity of flow through the factory with reduced overtime, the business stopped losing money. In the proposed future state, additional performance enhancing changes are identified and discussed as a going forward plan for the future.
Thesis Advisors: Dr. Jonathan Byrnes
Department of Civil and Environmental Engineering Professor Debbie Nightingale
ACKNOWLEDGEMENTS
While it is impossible to recognize everyone who contributed to the success of the internship and the completion of this thesis, I would like to thank several individuals that had tremendous impact.
First, I thank the Leaders for Manufacturing Program and in particular my thesis advisors Professors Jonathan Byrnes and Debbie Nightingale for their support and advice during my internship and the preparation of this thesis. They provided much appreciated technical advice and encouragement.
I thank my project supervisor, Tom Flynn, the Operations manager of ABB Wessel Cable Ltd.,
for his support and willingness to share information. I would also like to thank the managers and employees of the ABB Wessel Longford plant for their helpfulness and real desire to improve their competitiveness.
At the ABB Corporation, I would like to thank Rafael de Jesus of the Corporate Research Center for sponsoring the internship and providing access to activities and people that greatly enriched this experience.
Most importantly, I would like to thank my wife, Sheila, for her support and sacrifices not only during the internship, but the entire two-year Leaders of Manufacturing Program. She has enabled this to be a wonderful once in a lifetime experience.
TABLE OF CONTENTS
ABSTRACT ... 2
ACKNOWLEDGEMENTS ... 3
TABLE OF CONTENTS ... 4
TABLE OF FIGURES AND CHARTS ... 7
SECTION 1: INTRODUCTION AND OVERVIEW ... 8
1.1 Introduction ... 8
1.2 Motivations and Objectives ... 8
1.3 Background ... 9
1.4 Reader's guide to Sections and Thesis ... 9
SECTION 2: PROJECT SETTING AND BACKGROUND ... 11
2.1 ABB Corporation ... 11
2.1.1 ABB Culture ... 12
2.1.2 Competitive Environment ... 12
2.2 ABB WESSEL Cable Background ... 13
2.2.1 Plant Description ... 15
2.2.2 Culture and Organization ... 16
SECTION 3: ABB WESSEL OPERATIONS DESCRIPTION ... 18
3.1 Cable Operations ... 18
3.1.1 Customers ... 18
3.1.2 Suppliers ... 18
3.2 Manufacturing Operations ... 19
3.2.1 Production Planning and Scheduling ... 20
3.2.2 Facilities Layout and Basic Operations ... 21
3.3 Manufacturing Environment ... 22
SECTION 4: ROADMAP TO TRANSFORMATION ... 24
4.1 The Importance of a Roadmap ... 24
TABLE OF CONTENTS Cont'd.
SECTION 5: CURRENT STATE ANALYSIS ... 27
5.1 Value Stream Mapping ... 27
5.1.1 Value Stream Mapping Process ... 27
5.1.2 Process Maps for ABB Wessel ... 28
5.1.3 Cost and Profitability Analysis ... 30
5.2 Current State of Operations ... 31
5.2.1 Demand Variation ... 31
5.2.2 Scheduling ... 33
5.2.3 Changeovers ... 33
5.3 Key Operational Issues ... 33
5.3.1 Waste in the System ... 34
5.3.2 Production Scheduling Practices ... 34
5.3.3 Machine Downtime ... 34
5.3.4 Changeovers ... 35
SECTION 6: CULTURAL CHANGE AND LEADERSHIP ... 36
6.1 The Importance of Culture ... 36
6.1.1 Approach to Changing the Culture ... 37
6.2 Leading the Change ... 38
6.2.1 How a Leader Can Make Change Happen ... 39
SECTION 7: IMPLEMENTING LEAN AND SIX-SIGMA ... 40
7.1 Teaching Lean and Six Sigma ... 40
7.1.1 Key Elements of Lean ... 41
7.1.2 Key Elements of Six Sigma ... 41
7.2 The Transition ... 42
7.2.1 Beginning the Continuous Improvement Journey ... 42
7.2.2 Implementation Approach ... 43
7.2.3 Team Process ... 43
7.2.4 Team Accomplishments ... 44
7.2.5 Lessons Learned ... 47
7.3 Creating a Lean Function ... 48
TABLE OF CONTENTS Cont'd
SECTION 8: IMPROVING THE SUPPLY CHAIN ... 50
8.1 As-Is Supply Chain ... 51
8.2 Inter-Company Logistics ... 52
8.2.1 Transfer pricing practices ... 54
8.3 Raw Material Suppliers ... 56
8.4 Demand Forecasting and Scheduling ... 58
8.5 Supply Chain Workshop ... 59
8.5.1 Approach ... 59
8.5.2 Results ... 61
SECTION 9: PROPOSED FUTURE STATE AND IMPLEMENTATION ... 63
9.1 Proposed Future State ... 63
9.1.1 Future State Map and Elements ... 63
9.2.1 Key Supporting Processes ... 67
9.2.1.1 Human Resources ... 67
9.2.1.2 Production Control (SFDCS) ... 69
9.2.1.3 Total Productive Maintenance (TPM) ... 74
9.2.1.4 Product and Process Engineering ... 76
9.2 Implementation Approach ... 77
9.3 Issues and Challenges to Implementation ... 79
9.4 Summary of Recommended Actions ... 80
SECTION 10: SUMMARY ... 82
10.1 Accomplishments ... 81
10.2 Lessons Learned and Personal Reflections ... 85
10.2.1 Leadership Practices and Principles ... 88
10.3 Conclusions ... 93
BIBLIOGRAPHY ... 94
Appendix A: Current State Process Maps ... 96
Appendix B: The Basics of Lean (Teaching Materials) ... 97
Appendix C: The Basics of Six Sigma (Teaching Materials) ... 103
Appendix D: Sample Team Accomplishment Presentation ... 105
Appendix E: Prof J. Byrnes: Supply Chain Workshop Presentation ... 107
TABLE OF FIGURES AND CHARTS Figure 2-1 Figure 2-2 Figure 2-3 Figure 3-1 Figure 3-2 Figure 4-1 Figure 4-2 Figure 4-3 Figure 5-1 Figure 5-2 Figure 5-3 Figure 5-4 Figure 7-1 Figure 7-2 Figure 7-3 Figure 7-4 Figure 8-1 Figure 8-2 Figure 9-1 Figure 9-2 Figure 9-3 Figure 9-4 Figure 9-5 Figure 9-6 Figure 10-1 Figure 10-2 Figure 10-3
Market and Revenue mix ... ABB Wessel Longford plant Photo ... Organizational Structure ... Basic Manufacturing Process .... ... Facilities Layout and Basic Operations...
LAI transition to Lean Roadmap ...
Lean Company Robust Change Process ... Project Transformation Roadmap ... Current-State Process Map (Telecom and LAN)... Generic Profitability Analysis ... Cost Distribution ... Typical Telecom Demand Variation ... ... Typical Scrap Round-up ... Typical Group Tool Box and Supply Cabinet ... Typical Visual Management Shop Aid ...
CV Line Personnel Pass-Through ...
ABB Wessel Longford Supply Chain Diagram ... Eircom/ABB team Report-Out ... Proposed Future-State Map ... The Death Spiral ...
SFDCS Logon Screen ... SFDCS Main Screen ... Insulation Planning Screen ... Proposed Organization Changes ... Inventory Data ...
OEE Data ...
Bishops' Overall Change Capacity Assessment ...
14 15 17 20 22 25 25 26 29 30 31 32 44 45 46 47 51 61 64 68 71 71 72 78 84 85 88
SECTION 1: INTRODUCTION AND OVERVIEW
1.1 Introduction
This thesis is based on research that was conducted at the ABB Wessel Cable plant in Longford Ireland as part of an internship project for the Leaders for Manufacturing Program,
Massachusetts Institute of Technology, Cambridge Massachusetts. The internship was
sponsored by the ABB Corporation Central Research Center and the ABB Wessel Industries Ltd. of Dublin Ireland. The research examines the operations of the Longford plant and analyzes the opportunities for the application of Value Stream Management principles, Lean Manufacturing and Six Sigma tools and concepts. This project will also review current material flows and scheduling practices using Value Stream Mapping and Profitability Mapping to identify potential improvements. Based on this information, and the supplemental research, a future state of operations will be recommended.
1.2 Motivation and Objectives
The primary motivation of the internship was that the senior management of ABB Wessel
needed to turn their company around, because it had been steadily been losing money since 1996 when the Irish Telecom industry was privatized. They needed a sustainable way to be profitable again. They knew that their company would need to be fundamentally different in culture, organizational structure and strategy/philosophy, and that it would require an outside catalyst to start the transformation. It was understood that this internship period of six and one half months was the critical foundational phase of what would be a two to three year transformation. To this end, Tom Flynn (General Manager) and I sat down and made the following project objectives:
* Start the cultural transformation from Hierarchal to Team-based * Create a customer-focused organization
* Lower the operating costs by eliminating waste within the entire Value Stream * Create the capacity for new business growth
* Attract Corporate investment
* Help ABB Wessel prove to themselves and others that they could change, improve and become competitive again.
1.3 Background
Value Stream Management requires the ability to be able to step back and view the entire value stream from a broad perspective. It involves understanding what does and does not create value from the customer's perspective, rather than the perspective of individual departments or
organizations. A Value Stream Manager is a person that is responsible for increasing the ratio of value to non-value by eliminating waste throughout the entire value chain, including moving beyond traditional buyer/supplier roles to unlock trapped value and ensuring that the product meets or exceeds the customer's requirements.
The ABB Wessel plant in Longford had had little or no exposure to modem manufacturing principles such as Lean or Six Sigma; and in many ways was like a time capsule from the early
1980's. This setting offered a unique opportunity to apply Value Chain Management principles and teach/implement Lean Manufacturing techniques and material flow within the plant.
1.4 Reader's guide to Sections and Thesis
Section 1 Provides an introduction to the thesis and an understanding of the scope and
motivation for the project. It also provides relevant background to the thesis.
Section 2 Provides background on the setting for the thesis and important issues affecting it.
It provides an insight into the ABB Wessel Cable Company and the competitive environment it faces today. It also describes the ABB Wessel Cable Company in its current form and gives an overview to the ABB Wessel production facility in Longford Ireland.
Section 3 Describes the ABB Wessel facility operations, customers, suppliers and current management practices. It provides an overview of the basic material flow and the cable manufacturing process.
Section 4 Provides an overview of the organizational transformation roadmap that was used for this project and also describes several alternative organizational transformation models and their processes.
Section 5 Describes and analyzes the current state of the ABB Wessel operations. This Section also describes how the Value Stream Mapping process was used at ABB Wessel and details the operations of the facility through description and data. It also highlights the key challenges and issues with the current operations.
Section 6 This Section investigates the topic of leadership and cultural change and describes
the processes that were used.
Section 7 Describes the process of teaching Lean principles and Six Sigma tools and concepts. It also describes the transition to a Lean continuous improvement environment of teamwork.
Section 8 Describes the current Supply Chain at ABB Wessel and details the challenges and
improvement approach utilized.
Section 9 Outlines a proposed future state and how it is being implemented at ABB Wessel. This Section also addresses key issues and challenges to this implementation plan.
Section 10 This Section summarizes the objectives, accomplishments, conclusions and
SECTION 2: PROJECT SETTING
While the main emphasis of this thesis is on Value Stream Management processes, steps, improvement techniques/tools, and the lessons learned during this critical phase of the turn around initiative conducted at ABB Wessel in Longford, Ireland, it is first crucial to understand the context and setting where this work was done. To do this it is necessary to understand the company and major issues that have influenced the current environment; for it is my belief that it is just as important to know how ABB Wessel got into this condition as it is to know how to get out of it. For this project, the two most relevant influences are the culture and the business environment of the ABB Corporation. The following Section gives a description of ABB's past and their present business goals and objectives.
2.1 ABB Corporation
The ABB Corporation (Asea Brown Boveri Ltd) was formed in 1988 as a result of a merger between ASEA (Allmanna Suenska Elektriska Aktiebolaget) and BBC (Brown, Boveri and Cie).
ASEA was one of the top ten power technologies companies in the world, specializing in nuclear
power plants and robotics. BBC was a leader in power transformer technology and hydroelectric power generators. The history of these two companies before the merger to form ABB goes back 120 years to the late nineteenth century, and has a long and illustrious record of innovation and technical leadership in many industries around the world.
ABB has recently streamlined its divisional structure to focus on two core businesses: Power Technologies and Automation Technologies. The Oil, Gas and Petrochemicals Division has been slated for divestment. ABB's Power Technologies Division serves electric, gas and water utilities as well as industrial and commercial customers, with a broad range of products, systems and services for power transmission and distribution. ABB's Automation Technologies Division blends a robust product and service portfolio with end-user expertise and global presence to deliver solutions for control, motion, protection, and plant integration (ABB Wessel is part of the Power Technologies division).
According to the ABB corporate website their current business strategy is simple: Offer more value for customers while building a leaner organization. A few years ago ABB expanded its holdings through acquisitions and its portfolio had grown to almost 900 plants. As a result, it found that it had also gotten away from its core competencies. Today they are down to a little more than 700 facilities in over 100 countries world wide. At one point last year they could have
been facing bankruptcy due to a potentially ruinous asbestos settlement in the United States which was fortunately capped at $1.2 billion by the US courts.
2.1.1 ABB Culture
ABB is a company of many cultures; it is as diverse as its global holdings. This is sustained in many ways by its decentralized approach to managing their holdings as loosely coupled bundles of assets. The glue that holds this global organization together involves the overall information reporting system (reporting performance measures to the top executives from each of the businesses and profit centers) and a softer kind of bond, the ABB policy bible, which includes the firm's mission, values and expectations, along with guidelines for overall behavior. In other words, it is used as a guide to the corporate culture. Having said this, it was evident during this project that the culture was changing, especially in the area of Human Resource Management, where they are becoming more focused on internal people development and processes to grow the bottom line rather than acquisitions.
2.1.2 Competitive Environment
The competitive landscape in the Power Transmission and Distribution and Automation
industries has changed dramatically in the past decade, largely due to technological revolution, globalization, and increased utility privatization. ABB's main competitors in these industries are a who's who of industrial giants, companies such as GE, Fugi, Hitachi, Eaton, Seimens, Pirelli and Emerson, just to name a few. As industry boundaries continue to be blurred or eliminated, the fight for market share continues to be fueled by fewer distinctions between industrial and service businesses, major advances in communications and logistics, and many government trade tariffs and policies which are being removed have also exasperated this phenomenon. ABB is currently striving to reduce cost through ever greater efficiency and economies of scale and scope.
ABB has, until recently, responded to these changes through strategic consolidation and
divestiture. They are now refocusing their resources on core activities and a renewed dedication to developing human capital and intellectual property. Additionally, ABB is under pressure from
it shareholders to improve operational performance in several areas. This has led them to embrace Lean as their manufacturing philosophy, although it is still in its implementation infancy, there is increasing interest and resources being made available to eliminate waste throughout the enterprise.
2.2 ABB Wessel Cable Background
ABB Wessel is in the business of manufacturing and selling low-voltage energy cables,
telecoms/network cable, and some specialty cables. The Longford plant was constructed in 1981
by a Swedish company Wessel Cable Ltd., in partnership with the Irish Development
Association (IDA), which still owns 25% of the business. The plant was originally designed as a high-volume telephone cable manufacturing plant to supply telephone cable to the fast-growing, nationally-owned telephone company (Eircom). The plant was primarily outfitted with used equipment purchased from cable manufacturers in the UK and Northern Europe who were either getting out of the business or moving their operations to low-cost locations in Asia or Eastern Europe.
Until the end of 1999, the company had shown considerable profitability even though it was very inefficient. At which time, their market collapsed, due to the Irish telecom industry being
privatized. In addition to the privatization, many entry barriers were lifted by the government of Ireland causing severe price competition.
The ABB Corporation had obtained Wessel Cable Industries in 1996 and even though ABB Wessel has increased their production by 25%, revenues continued to decline. Since 2000 the contribution margin has dropped by more than 50% and the company presented a loss of 13 million USD, during the period of 2000 to 2002. The projected losses for 2002-2003 are 3 million USD primarily due to a decrease in the price of copper. Based on this current financial situation, there was a high risk that the company would run out of cash before the end of 2003.
In the past, ABB Wessel had been run independently of the ABB group. They did not brand their products as ABB nor did they sell to other ABB businesses. The focus of ABB over the past three years has been on trying to sell the business, however that has proved elusive. As a consequence, strategic and operational issues were neglected within ABB Wessel, as well as any restructuring and process improvements. As a result, the organization, processes, and cost structure are unable to compete within the market. The cost structure is far too high; the organization had many duplications, internal competition, and inefficient processes.
ABB Wessel produces approximately 250 SKU's of telecom and low-voltage cables primarily for the Irish and UK markets (see figure 2-1 below). They are the largest telecom and
low-voltage cable manufacturer in Ireland (59% of total volume). They operate out of two separate
and independent plants, located in Dublin and Longford. The primary internship site was Longford, a 60,000 sq ft facility with 84 employees that operates a three shift, five days/week production schedule.
Revenue Mix Market Mix
Figure 2-1 Revenue and Market Mix
ABB Wessel has numerous competitors worldwide. As a result there is considerable spare
capacity in the cable industry. This industry has continued to contract for the last 5 years, and
many competitors are still trying to right-size their facilities. Increased competition from Southeast Asia (possibly as a result of very low shipping costs and creative consignment
cable of the kind ABB Wessel manufactures have become a commodity item and considered relatively low technology. Everyone in this market would like to raise prices, but there is always a supplier who upsets the balance and lowers prices, trying to capture volume to spread cost over more products, this keeps the prices low. The telecom and low-voltage cable industry is not an attractive industry at this time.
2.2.1 Plant Description
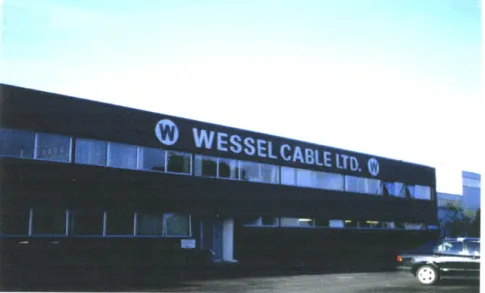
Physically, the ABB Wessel plant in Longford is located on a hill overlooking the small town of Longford and the beautiful rural farms surrounding it. It is not uncommon, early in the morning, to be stopped on the road to the plant as the dairy cows from the surrounding fields are herded
down the road to be milked at a local farm. The factory itself is quite compact and constructed of steel structural members and polystyrene insulated corrugated steel panels. The entire operation (60,000 sq ft) is housed under one roof. The front of the building, facing the road, is
where the offices and employee parking is located -and at the back and sides of the building,
much of the finished goods storage is located (See figure 2-2 photograph of Longford Plant). The shop floor is laid out in an orthogonal grid with three main aisle ways running north-south and one running east-west. In general raw materials are received at the south end and finished goods are loaded and shipped out of the north end.
Figure 2-2 ABB Wessel Longford Plant
2.2.2 Culture and Organization
As previously mentioned, ABB Wessel was very profitable during its first 16 years of its
existence, while they had a virtual monopoly in the telephone cable market in Ireland. This past economic success in many ways helped to cover up a multitude of problems and reinforce, in the employees' minds, poor practices and behaviors. ABB Wessel has always been very
hierarchical, with authoritarian managers that ran the plant with very little oversight from
corporate headquarters and with little input from the employees; the goal was always to produce more and more volume. Employees were just supposed to carry out managements instructions, not to take part in the decision process.
There are two distinct groups at the plant, management and the unionized workforce.
Traditionally there has been very little cooperation or teamwork between them. A good example of this is the seating arrangement in the lunch room, where management has its own table well away from the direct reports. Christmas parties are held separately for management and union workforce. Historically, almost all hiring was done by the plant manager, whose lack of HR training and practices had led to very little diversity (all white Catholic males, many of whom are related). The average age of the workforce is very high, 30% of employees are over 55; 24% are
45-55; 22% are 35-45; and 24% are under 35. The turnover of employees is quite low and the
average length of service is 16.7 yrs, with extremely high absenteeism, between 6-8 %.
ABB Wessel's largest customer (Eircom) was at one time 80% of their business. Not
surprisingly, the Eircom business has dominated the business strategy of ABB Wessel. The fear of losing the account to a competitor (prisoners' dilemma) has affected all decisions/policies for many years. The prisoners' dilemma is a classic example of game theory and it illustrates the problem faced by most oligopolistic firms. Due to this dependence on Eircom, ABB Wessel has slowly seen the profits in this sector erode, while offering ever increasing services and discounts to Eircom. As a result, resources (people and money) wasn't made available to help grow other parts of the business and the company is suffering the consequences of these decisions today.
The organizational structure was fairly typical for a small plant. The management structure was very flat with very few layers of management, which one would expect in an operation of 84
people. (See figure 2-3 below). Floor supervisors typically would have 10-20 employees reporting to them depending on the shift.
Directorl
I
I
Figure 2-3 Organizational Structure
.- -... ... ...
SECTION 3: ABB WESSEL OPERATIONS
The intent of this Section is to describe the operations at the ABB Wessel Cable plant and to give the reader an idea of the environment. This Section will also provide a basic overview of
manufacturing processes; describe the facilities, flow of materials, and information that support that process. It will also describe elements of the work environment that are relevant to the operations and culture within the plant.
3.1 Cable Operations
The ABB Wessel plant in Longford Ireland is one of the largest single employers in the area, not to mention related jobs with suppliers and support services. At the time of this research ABB Wessel produced approximately 3,000-4,000 km of cable daily. This cable is produced on 4 basic production lines: Telecom, Low-Voltage Power, Rubber and Data.
3.1.1 Customers
ABB Wessel has seventeen primary customers that fall into six major categories, they are:
National Telecoms, National & Regional Utilities, OEMS, Installation Companies,
Wholesalers/Distributors, and internally (sister plant in Dublin). As previously mentioned, an overwhelming majority of revenues (currently over 50%) comes from business with one customer, the Irish national telecom company, Eircom. In recent years ABB Wessel has been actively trying to reduce this dependence by expanding their presence primarily in the UK with wholesaler/distributors such as Hagemayer who sell low voltage cable (House Wire and Low smoke and Fume LSF) cable to contractors and installers. Another key customer is the Irish power company ESB. This company used to purchase much more product from ABB Wessel, prior to privatization.
3.1.2 Suppliers
Traditionally, ABB Wessel's procurement policy was that of having a broad base of suppliers and always having multiple sources for every item. This was thought to be a logical approach since most, if not all, raw materials and supplies required were essentially commodities. Over
time this model changed, as it became more popular to have a few key suppliers (relationship purchasing), and since ABB Wessel does not purchase extremely large quantities they tried this approach. There have been problems though, primarily due to the lack of a supplier
management strategy, selection qualification criteria, performance measurements and a reluctance to share key data, such as production forecasts.
The direction today is to go back to the broad base transactional purchasing model, which is thought, by the procurement department, to ensure competitive pricing and allows flexible purchasing practices, in most cases month-to-month with only verbal agreements and very little documentation.
The key supplier to the Longford plant is their sister plant in Dublin. This facility supplies the main ingredient for these cables (copper). Deliveries are usually three times a week and the
copper is supplied in 1.5 ton large baskets or bobbins in three different diameters, depending on whether or not it is going to be drawn down to a smaller diameter. Even though the copper is
originally purchased on the commodities metal markets, because these plants are considered solely independent tax entities, there is negotiated transfer pricing involved.
3.2 Manufacturing Operations
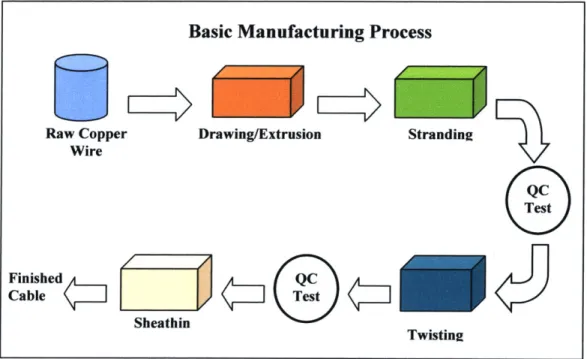
The manufacturing process in a cable plant is relatively simple and consists of five basic
manufacturing processes, Drawing, Extruding, Stranding, Twisting and Sheathing. All of these processes utilize specialized machines and a relatively small amount of touch labor to produce the finished product. The telephone cable process is depicted below in figure 3-1.
Copper is typically delivered to the plant in the form of 2.6 mm diameter wire, which is drawn down to the needed diameter and insulation materials, plus color, is extruded on to it. This wire will become the basic building block for many other products as it goes to the next process where it is paired by color combination, and stranded into pairs and subassemblies of multiple pairs. The next step in the manufacturing process is to twist these subassemblies into larger final assemblies prior to sheathing with protective materials and coating such as PVC and
to 100% functional testing after the Stranding and Twisting processes and a 10% sampling after Sheathing.
All of these processes are what would be considered fast cycle time processes and can be run at
speeds from 100-400 m/s. This means that once the process is running correctly for a given product, a lot of product can be made in a relatively short time. Traditionally, fast cycle time processes have been run in very large batches that maximize the amount of time the equipment is
actually producing product. Since the time to change setups and to get proper alignment
generally creates significant scrap and lengthy periods of down time, it was considered common sense to reduce setup costs by running the biggest lot size possible.
Work in Process (WIP) and finished goods are primarily transported through the series of
processes on large drums up to 1.6 meters in height and weighing as much 5 tons. Due to the
size and bulkiness of the drums, forklifts are required to move them. Proper factory flow design and limited WIP storage areas are essential to an efficient operation of this design.
Raw Copper Wire FinishedA Cable Sheathin Stranding
Basic Manufacturing Process
Drawing/Extrusion QC Test : QC Ki Test Twisting
Figure 3-1 Basic Manufacturing Process
3.2.1 Production Planning and Scheduling
Production planning and scheduling at ABB Wessel was a very manual process with hardly any system support; it was primarily based on the personal experience of the planner and plant manager. Demand planning was based on sales forecast, finished goods stock levels, and historical data (26 wk average). The production planning suffered greatly from the quality of
sales forecasting. This was a simple historical average over a particular period (i.e., 4 weeks or 12 months) and the fluctuations in demand which could vary greatly and had some seasonality. In addition, the rate of absenteeism and the unreliability of machines led to problems of reaching the planned production schedule. Economic batch sizes were typically not defined and the focus was on long batch runs and achieving high machine utilization.
There were no daily production meetings with stakeholders (such as floor supervision, production planners, management, and operators) conducted to discuss the production plan, priorities or challenges. Better communication and a production scheduling system was greatly needed to help optimize WIP based on lot sizes to meet the demand within capacity constraints, and to help identify bottlenecks to prevent late shipments or infeasible schedules.
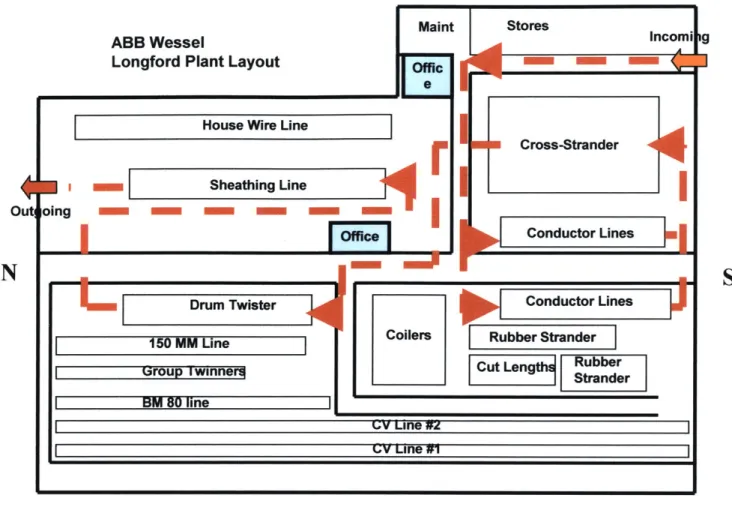
3.2.2 Facilities Layout and Basic Operations
Figure 3-2 shows a detailed layout of the cable manufacturing operations and a simplified view of material flow to support the telephone cable operations. The plant itself is very
self-contained, with raw material storage and maintenance co-located on the shop floor.
Most raw materials (except bulk polyethylene and wooden drums) arrive at the south receiving dock where they are entered into stores inventory and placed on racks or moved directly to point-of-use locations on the shop floor. In the case of copper and plywood reels, often times they are stored outside due to a lack of proper storage space inside. Movement of the raw materials is primarily performed by forklifts, which often creates a bottleneck. The product moves generally south to north, but the flow is not ideal because of the location of several machines which cause the flow to double back on several times before being completed.
ABB Wessel
Longford Plant Layout
House Wire Line
- p Maint
ICL
r
*g
I
oSheathing Line oing - - - - - II
rfi
Drum Twister I 150 M Line rou winne ineI
Stores Incomi A Cross-Strander Conductor Lines Conductor LinesCoilers Rubber Strander
Length R er
V ne #2 %V Une fI
Figure 3-2 Facilities Layout and Basic Operations 3.3 Manufacturing Environment
The manufacturing environment at the ABB Wessel Longford facility was not what the average person would expect for a plant as new as this one. Even though the plant was built in 1981, it basically had been run into the ground after years of pushing for greater and greater volume, followed by 4 years of neglect and cannibalism of parts and supplies. The plant was on its last legs. Housekeeping in the facility was virtually non-existent. For example, garbage, scrap, old
WIP, and dirt could be found everywhere on the premises. Work areas did not have waste bins,
brooms, or dust pans. Oil, water, and lubricants could be seen on the floor from leaking
machines, forklifts, and roof. The floor was littered with cigarette butts and plastic tea cups. In addition, the machines were dirty and often missing key components, tooling and setup
instructions, and product specifications as well as quality sheets were not maintained.
a
Out,N
19S
I .-- ... ...L.1
I
iEmployee health and safety had been a problem for a long time. At the time of this research there had been over 20 accidents in 2003, resulting in several very lengthy employee absences
and a great deal of lost productivity. The people were not trained to act responsibly and were not encouraged to report accidents or near misses or wear safety equipment, such as safety glasses or hearing protection. Emergency exits were frequently blocked by WIP, surplus equipment, disused electrical wiring, and leaking water and stream pipes were virtually everywhere.
Basically, there was no preventative maintenance performed on the machines. Machines were run until they broke down. All maintenance or overhauls were executed during the yearly two-week shut down. No history of maintenance or performance problems were kept, therefore root cause analysis of breakdowns was not conducted. In addition, not all shifts were covered by maintenance personnel. The Longford plant had no electrician on evenings and nights and no mechanic on nights. The engineering/maintenance staff was not adequately trained in the repair of machines and often would have to rely on an outside consultant company to come in to perform diagnosis and instruct them on how to fix the problem.
Overtime was the norm. It occurred almost daily for most operators, and was used by
supervision as a reward system. In addition to weekend shifts, overtime was necessary during the week to cover absences or catch up because of machine breakdowns. Since there are very few salaried and management employees supporting the constant operations, often the plant operated without supervision or a member of management on the premises.
SECTION 4: ROADMAP TO TRANSFORMATION
The objective of this section is to present several examples of organizational transformation models and their processes and highlights there strengths and weaknesses. An overview of the roadmap to organizational transformation that was used for this project is then provided.
4.1 The Importance of a Roadmap
Having a good roadmap is important from the standpoint that it will help to guide an
organization through the transformation process and help keep it from getting side tracked or derailed along the way. Once an organization decides it needs/wants to transition to a lean operation, or under take a substantial change initiative. There are potentially many roadmaps available. The literature is rich in this area and just about every book or paper on Lean and culture change will provide one. I have selected a couple here for reference. One particularly complete one is the Lean Aerospace Initiative (LAI) transition to Lean roadmap shown here in figure 4-1. It is very good at outlining the tactical and functional aspects of a lean transition from a production operations perspective. I do have some minor criticisms of it though, from the stand point that it does not try to represent the interaction or influence that a Lean transformation has with a company's culture and the process to take when expanding the Lean transformation out into the internal and external supply chain. This aspect of the transition to Lean is what a major portion of this thesis addresses.
A slightly more simplified roadmap is presented in a book by James A. Jordan Jr. and Frederick J. Michel titled "The Lean Company- Making the Right Choices". It depicts a company's Lean
transformation as a change process (see figure 4-2 Lean Company Robust Change Process). This idealized diagram shows many of the same steps or phases found in the LAI roadmap; again it does not address the supply chain, but perhaps is more cognizant to the cultural aspect of Lean transformations.
Production Operations
Transition-To-Lean Roadmap
Phase . ase.
identify Design
MMAS, EVWU ek.
Training andftunan Resources
Phase 5 Phase . Implement Total
Financial Procurwnent
kftlDnrUWM Engthearing
Phase 0 Phase I
Adopt Leon Paradigm Prepare
Build vision Integrate with
EnEnterprise
Establish need TOP Level
Wnant as
Foster lean dership Establish an oadn
leaming
Make the rn Leant
ea )
commitment Implemwe ftation
em nt i 0: a I "fi. ew in Sr. TOWKS) Developrat mplernentation strategy Develop a plant. 'mrasa
address worldbroe changes Address Site specific Cultural Issues Train key people Expand ENTRY
Figure 4-1 LAI Transition to Lean Roadmap
1. Recognize the need to change
2. Create and articulate a vision for the Lean company
17 3. Assess the current identify required channesstate to
4. Build an integrated plan for Lean chante initiatives
5. Focus and sustain commitment
To Lean chanee initiatives
7. Continually challenge Progress
Figure 4-2 Lean Company Robust Change Process
-Legal Supply Chain/External Environment
Enmerpnse I Proauctron ysRem imerace
0 0afty
Phase 2
Define Value
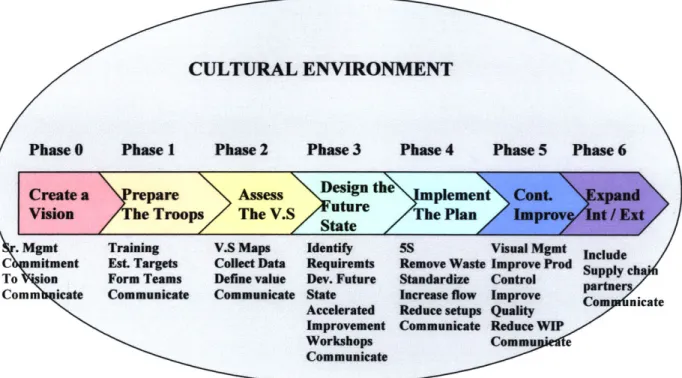
4.2 Overview of Roadmap Used
For the ABB Wessel project I developed a roadmap that included many of the same attributes of these examples and included the aspects of supply chain and cultural environment. This
graphical representation was helpful to upper management to visualize the process and its components and is offered here to assist the reader in following the developments of the project as he or she reads this thesis and to further fuel thought on this subject.
CULTURAL ENVIRONMENT
Phase 0 Phase 1 Phase 2 Phase 3 Phase 4 Phase 5 Phase 6
repare Assess Design the plement
V'1*Q*- '. he Troops The V.S Str The Plan
I :. II. cState
Mgmt Training V.S Maps Identify 5S Visual Mgmt Include
C mitment Est. Targets Colect Data Requiremts Remove Waste Improve Prod Supply ch
To ion Form Teams Define value Dev. Future Standardize Control pplr
Comm icate Communicate Communicate State Increase flow Improve Con nicate
Accelerated Reduce setups Quality
Improvement Communicate Reduce WIP
Workshops Commu
Communicate
Figure 4-3 Project Transformation Roadmap
As shown above, I have the cultural environment enveloping the Lean transformation process. This is a key success element, because each component of the process can be thought of as the growth and maturing of the seed that was planted back in phase 0. The cultural environment can either nurture it allowing it to grow, or stifle its development and ultimately kill it.
Communication is a common theme in this roadmap; all parties simply can not communicate enough during the transformation. Management must be prepared for this, because it is the sharing of ideas and thoughts that strengthens the transformation. I will discuss the element of this cultural environment further in section 6.
SECTION 5:
CURRENT STATE ANALYSIS
The objective of this Section is to describe the key aspects of the current operations at the ABB Wessel plant in Longford Ireland. This will be done through qualitative descriptions of the processes and analysis of the current operating methods. This Section will also describe the Value Stream Mapping process that was used to analyze operational efficiency and discuss the Value Stream. It will present the data collected, describe management processes and discuss the key findings.
5.1 Value Stream Mapping
According to Rother and Shook in their pioneering book "Learning to See- Value Stream Mapping to Add Value and Eliminate Muda" there are several objectives of Value Stream
Mapping. Most importantly is to give an enterprise view of the manufacturing operation to the managers and/or operators. Everyday, people working in a manufacturing environment, often
fall into a fire-fighting mode and lose sight of the overall system and their role in it. Taking the time to prepare and utilize the techniques of Value Stream Mapping allows you to step back and
consider the entire operation from your customer back to the suppliers. Additionally, it is an excellent tool to help the senior management and the plant manager to visualize and assess all processes under their control.
5.1.1 Value Stream Mapping Process
The process itself is very simple and straightforward. You usually start with customer delivery and work your way back through the entire process documenting the process graphically and
collecting data along the way. This process results in a single page map of the Value Stream and its component processes using simple graphical symbols.
The user collects data such as cycle time, WIP levels, quality levels, and equipment performance data. The actual current inventories that are witnessed and the operating performance at the time of the mapping should be recorded. Depending on the complexity of the process and the number of components involved additional data may need to be collected from other sources. A
very important part of the Value Stream Mapping process is documenting the relationships between the manufacturing processes and the controls used to manage these processes, such as production scheduling and production information. Unlike most process mapping techniques that often only document the basic product flow, Value Stream Mapping also documents the flow of information within the system. Where the materials are stored (raw materials and WIP) and what triggers the movement of material from one process to the next are key pieces of information.
5.1.2 Process Maps for ABB Wessel
The current-state maps that were created for ABB Wessel's Longford plant telecom and LAN (local area network) operations are described here as process maps, because if it were a true Value Stream Map it would include the suppliers, customers and shipping. If a complete Value Stream Map had been performed, these two process maps would be represented graphically as single process boxes with inputs and outputs. The process maps for the cable manufacturing operations represent a mapping of the detail operations of these internal processes. This
distinction between process and Value Stream maps is subtle, but important, since it ensures that a greater enterprise, and cable manufacturing's role within it, is not lost.
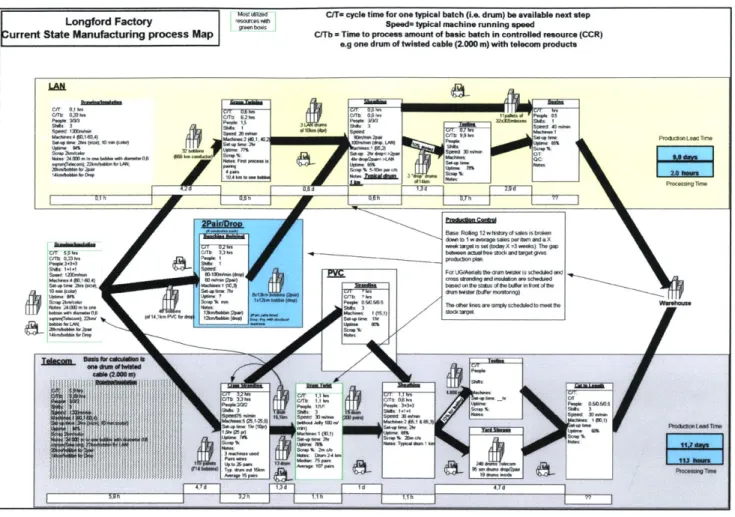
Figure 5-1 below shows the current-state process map for the telecom and LAN cable lines, which was created by the subject matter experts from the ABB Corporate Research Center in Vassa, Finland. This map appears cluttered at this scale; therefore a larger and easier to read copy is included in Appendix A.
Longford Factory ro
urrent State Manufacturing process Map :e-is
CiT= cycle time for one typical batch (i.e. drum) be available next step
Speed= typical machine running speed
CrTb = Time to process amount of basic batch in controlled resource (CCR)
e.g one drum of twisted cable (2.000 m) with telecom products
Pro
cae~e lm
CB": am in12... 621- A csMw. 0 teeP.. a
PBegO. 3eteW P3eeses B... I
beweas
Sim.e ekad.~~e
FeJ2ees12.efuse.1 sd..Xen*M
seed ..d
Sot-Wbse M *-2m0., A2 2fW (et. 0 eeete iW~b
va....W..W SOed Mb.. IF.?)p Sw BO Dk.A- O
t ~ ~ ~ . %%"331:
... _ __ .. 3.... Beep 0.8 o2d2.. A.I. Na..I sTim
Figure 5-1, Current State Process Map Telecom and LAN
As seen in the process map above, various symbols are used to identify different processes. The stacked boxes represent WIP, rectangular boxes represent a process or manufacturing operation that must occur, and forklifts represent product movement. Information flows are depicted with line arrows. Non-manufacturing processes such as receiving, production control and shipping are not depicted. Block arrows represent material flows. The manufacturing operations boxes contain data about the operation such as; cycle time, manpower/shifts, equipment up time, machine speed and setup time. Perhaps the most valuable output of process maps such as the one shown in Figure 5-1 is the final totals of lead time and process time. For example, the lead time for the LAN cable was 11.7 days, but during that time only 11.3 hours was process time. This means that almost 11 days of the total 11.7 days to produce the product the product was sitting with no value added activity being done to it. The situation was very similar for the telecom line where the lead time was 9.0 days with only 2.0 hrs of process time. This analysis very clearly shows that there was considerable room for improvement.
5.1.3 Cost and Profitability Analysis
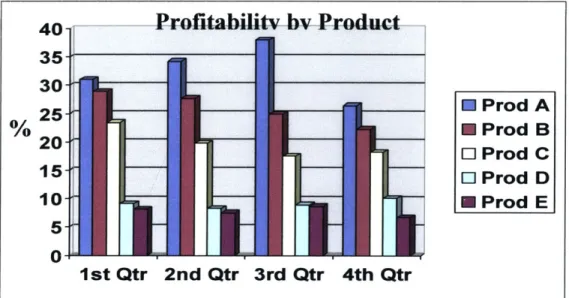
Profitability analysis is another tool that was used and is simple and very illustrative. The concept is to analyze each product to ascertain its profitability. It is important when conducting this analysis, that it is clearly understood how fixed and overhead costs are being allocated. It might be necessary to make changes in the financial accounting numbers in order to get an accurate picture of product profitability. In this particular example, overhead and fixed costs were allocated by machine hours. The goal of this process is to identify which products need
help and which product you should potentially retire. This information is also very useful when
deciding where and how to utilize production capacity and overtime. (See figure 5-2 for a
generic profitability analysis). As you can see, it is very easy to distinguish that product families
D and E need the most attention. The next step in this analysis was to conduct activity-based
costing (ABC) for each product in the family. When this was done at ABB Wessel, Longford, it was found that for a specific product family, four of the twelve products were actually losing money and 3 of the twelve had a profit of less than 10%. This knowledge led to a rethinking of the basic processes and materials used for this product family, culminating in a major technology development initiative.
-P__
1st Qtr 2n
rnfi*ohuluf'i, h'u PrgbduuPf .~xuuur~xxw v U7Y u uru7uu~u~
-d Qtr 3r-d Qtr 4th Qtr M Prod A M Prod B 0 Prod C E Prod D M Prod E
Figure 5-2 Generic Profitability Analysis
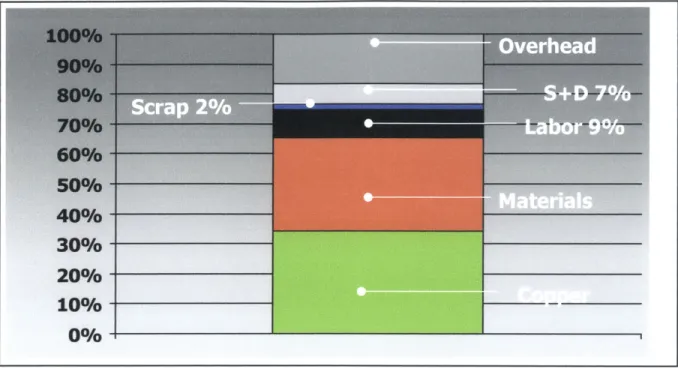
Understanding the cost distribution of an operation is also another fundamental, yet essential, piece of knowledge when starting to understand how and where to focus improvement activities.
40-35, 30 %25 % 25 20 15 10 5 0 ...
Figure 5-3 Cost Distribution, below, is a snapshot of the cost landscape at ABB Wessel just prior to the research activity.
Figure 5-3 Cost Distribution
5.2 Current State of Operations
In this research Value Stream Mapping, cost and profitability analysis were the main tools used to help understand the operations and to identify areas on which to focus the improvement activities. The following section explains the current state of operations and details the process used for making decisions. It also provides metrics or data whenever possible.
5.2.1 Demand Variation
At ABB Wessel, like most manufacturing plants, the production planning was driven by the forecasted demand for the products by the customers. Variation in demand and variation in the lead time to supply the demand created the need to buffer production from the demand by building excess inventory. These variations also had the potential to result in the well known "bull-whip" which refers to the amplification of demand fluctuations from the bottom of the supply chain to the top. This phenomenon was first observed by Forrester (1961) in case studies of industrial dynamics models.
Sources of demand variation usually came from several areas. The first source was the inability of the customers to perform to their own schedules. The reasons for this variability could range from weather, to lack of on time state or city planning approval, or unreliable subcontractors. Additionally, their own basic scheduling/planning systems did not give their buyers sufficient visibility into when the job was to actually be performed and consequently when the telephone cable would be needed at the site. A buyer would simply be notified that a specific job had been authorized and what the intended completion date was. This completion date could be as much as 90 days in the future, leaving it up to the buyers to guess when the work might actually start
and when the cable would be needed. (See figure 5-4 Typical Telecom Demand Variation).
20000-18000 16000 14000 12000 QTY/ 10000 KM 8000 6000 4000- 200
0-I~~
Telecom Demand - 23 wksg~ '~ ~
I I I I I I I I I I
WEEKS
Figure 5-4 Typical Telecom Demand Variation
The second source of variation came from the need to produce product or subcomponents for the sister plant, because they had fallen behind or had a machine malfunction. By its nature, this demand would come on an irregular basis and would vary significantly. This demand would be coordinated with management and generally resulted in overtime to play catch up with regularly scheduled production.
...
The final source of demand variation was created internally due to inconsistent inventory and production policies and practices. The undisciplined approach to production planning created variations in inventory and increases in WIP, the following sections of inventory and batch size will discuss this further and present data to illustrate this issue.
5.2.2 Scheduling
Production operations were controlled via a production priority list distributed daily to the shop foremen by the production planner. This production priority list was a simple hand written list of the product requirements (type and quantity) for each process in the shop. The production
planner would also distribute new production record sheets to each of the operators' stations and collect the previous day's sheets. The production planner was also responsible for checking WIP and finished goods inventories, which he usually did twice a day. These data were manually combined with the customers scheduled usage numbers, sales forecasts, historical production numbers, material availability and operator or machine availability to produce a production schedule. Needless to say, the production schedule was a very fluid document due to frequent production interruptions, material shortages, machine breakdowns, and changes in management decisions.
5.2.3 Changeovers
Changeover data by job was not available for the ABB Wessel operations. However, many changeovers were witnessed during this research and a wide variation in times to accomplish
changeover was seen. Typical changeovers were in the range of 45-90 minutes, the reason for
this variation is multifaceted, from mechanical problems to operator skill and experience, to the differences in changeover complexity from one product to another. Times were also clearly impacted by the number of personnel involved, availability of forklifts and mechanics, and the urgency of the production need. This was obviously an area that could use more attention.
5.3 Key Operational Issues
Four key operational issues (waste in the basic system, scheduling practices, machine downtime, and changeovers) faced ABB Wessel operation at the Longford plant and presented opportunities
for dramatic improvement. The following sections review these issues and describe the impact of these issues on the ability to create a stable productive operating environment.
5.3.1 Waste in the System
As we can see clearly in the process map figure 5-1 there is a great deal of dead time and high WIP levels in the process flow that represents a considerable amount of dead money and waste in the system. This challenge was addressed by the individual continuous improvement teams (CIT's) which were formed to identify and eliminate waste throughout their processes. They primarily utilized Lean manufacturing principles and Six Sigma tools and concepts to
accomplish this task.
5.3.2 Production Scheduling Practices
The current production planning and scheduling process, as described, was very manual and subject to human error and frequent changes in methodology. The need for a more automated system with a set of rules to enforce consistent batch sizing, inventory management, and reduction in changeover costs was needed. In Section 9, I will describe a new system being developed, called the Shop Floor Data Collection System (SFDCS) that is a first step toward this goal, and will make the production planning and scheduling function much easier, consistent, and accurate.
5.3.3 Machine Downtime
Machine downtime is definitely one of the most significant contributors to poor overall operating performance at the Longford facility. The result of this unscheduled downtime is that the 5 day 3 shift operation has been forced to extend operations to nearly 7 days per week to meet demand. As with most problems, the reasons and solutions were quite varied. First and foremost was the need for a proper preventive maintenance program, skilled mechanics and operator involvement in the responsibility for maintaining and ensuring high levels of machine uptime. The current situation has created a self-perpetuating casual loop: unscheduled downtime results in less production capacity, less production capacity leaves less open time to conduct preventative maintenance. The objective here is to break the current cycle at ABB Wessel. The price of not implementing a preventative maintenance program can also be evaluated as the cost of this extra
production capacity and the lack of extra capacity to develop new products. This topic will be addressed in more detail in Section 9.
5.3.4 Changeovers
The distinction between machine downtime and changeovers is quite clear. Changeovers and setups are planned, machine downtime is unplanned. So whenever a changeover is scheduled it is important that it be done as quickly as possible. To accomplish this, the CIT's identified several things such as proper and available tooling, modular and color coded tooling, quick reference product specifications, group work rules, etc., to be reviewed for implementation.
SECTION 6: CULTURAL CHANGE AND LEADERSHIP
This Section investigates the topics of cultural change and leadership, it describes the philosophy and process used and outlines some of the leadership practices and used along the way.
"There is nothing more difficult and dangerous, or more doubtful of success, than an attempt to introduce a new order of things in any state. For the innovator has for enemies all those who derived advantages
from
the old order of things while those who expect to be benefited by the new institutions will be but lukewarm defenders"Niccolo Machiavelli The Prince
6.1 The Importance of Culture
As managers we hear a lot about company cultures; but what are they really, and what
determines culture and why is it so important? Corporate culture is often defined as the sum of formal and informal behaviors that a company adopts as their way of doing business. Formal behaviors are such things as written mission statements, vision statements, and organizational charts. The informal side deals with how work gets done, procedures, how employees are treated
by management, and how they treat each other.
A company's culture is important because it filters and seeps through to every nook and cranny
of the business, including its customers and suppliers. An employee that feels undervalued and frustrated will project that to customers and to their coworkers. Culture can be one of the few things that your competitors cannot duplicate. They can copy your products, services, and marketing, etc., but they cannot copy your people and how they work together. A healthy company culture is also self-perpetuating, because good people will gravitate to it and continue to make it stronger and better. For example, Southwest Airlines is widely recognized as having one of the best company cultures today; consequently every year they have literally thousands of very well qualified applicants to select from.
One of my objectives during this project was to understand the role of culture in implementing Lean and more generally in turning around an organization. I started by forming the foundation of a new culture and new set of behaviors and standards for the people at ABB Wessel. This new culture was to be based on teamwork and cooperation. Of course changing a culture takes time, more time than I had; but as the old saying goes "a house is only as strong as its
foundation", so these activities were extremely important to the future success of the company.
6.1.1 Approach to Changing the Culture
The decision to make fundamental changes in company culture is often a response to a need to adapt to powerful external forces. The situation at ABB Wessel was no different, the
organization needed to change or it would die. Like organisms in nature, organizations need to adapt to their environment or they will become extinct. Darwin's evolutionary theory applies to the evolution of all species including business organizations. According to Darwin, "It is not
necessarily the strongest or the most intelligent who survive, but those that can adapt and change."
"If the rate of change on the outside exceeds the rate of change on the inside, the end is near" Jack Welch Retired CEO of GE
The approach I utilized was a four step process that I developed based on my experience, education and intuition.
1) The first step in this process was deciding on the new company culture and business strategy.
For ABB Wessel, the senior management wanted to become much more customer focused, cost competitive, team oriented, and Lean in all of it aspects of its day-to-day operations. It was obvious that a transformation such as this would require fundamental changes and re-alignments in order to put the organization and culture in synch with the new realities and strategies.
2) The second step was to try to determine what the core values of the existing culture were. What I found was that there was considerable importance put on authority, past profitability, and tradition; but nothing that I would have called core values, such as integrity, diversity, teamwork, etc. This puzzled me at first, because there was no vision or mission statements, no organization