HAL Id: inria-00353555
https://hal.inria.fr/inria-00353555
Submitted on 15 Jan 2009
HAL is a multi-disciplinary open access
archive for the deposit and dissemination of
sci-entific research documents, whether they are
pub-lished or not. The documents may come from
teaching and research institutions in France or
abroad, or from public or private research centers.
L’archive ouverte pluridisciplinaire HAL, est
destinée au dépôt et à la diffusion de documents
scientifiques de niveau recherche, publiés ou non,
émanant des établissements d’enseignement et de
recherche français ou étrangers, des laboratoires
publics ou privés.
The Website for Graph Visualization Software
References (GVSR)
Bruno Pinaud, Pascale Kuntz, Fabien Picarougne
To cite this version:
Bruno Pinaud, Pascale Kuntz, Fabien Picarougne. The Website for Graph Visualization Software
References (GVSR). Graph Drawing: 14th Int. Symp., GD 2006, Sep 2006, Karlsruhe, Germany.
pp.440-441, �10.1007/978-3-540-70904-6_42�. �inria-00353555�
The Website for Graph Visualization Software
References (GVSR)
Bruno Pinaud, Pascale Kuntz, and Fabien Picarougne
Laboratoire d’informatique de Nantes Atlantique - France [email protected]
Abstract. Graph drawing software are now commonly used. However, the choice of a well-adapted program may be hard for an inexperienced user. This poster presents a website (http://www.polytech.univ-nantes. fr/GVSR/) built to help users choose a program adapted to their prob-lems. So far, this site uniformely presents fifty programs and aims at helping users both in their choices and in comparing the programs.
The current profusion of available graph drawing programs lets the non-specialist user often confused. Some programs have been developed in close partnership with the scientific community (e.g. Pajek for social networks). But generally speaking, the choice of a program well-adapted to both the data and the methodology remains difficult for a user expert in his field but not in graph drawing. Recent books can be used as guides [1,2], and several websites present lists of general or specialized programs [3,4,5] or synthetic views of different types of layouts [6]. However, either the information is too complex for a non-specialist or it is presented incompletely or in a heterogeneous form uneasy to explore. Consequently much effort is required to compare the various programs. Those restrictions led us to develop a website called “Graph Visualization Software References” (http://www.polytech.univ-nantes.fr/GVSR/). Built as a directory, it presents the programs with a uniform text-based description along with a screenshot. This site keeps evolving and so far contains about fifty various software descriptions classified into five types: libraries, visualization tools, knowledge representation, 3D only tools, and specific tools. Our objec-tives are to facilitate the users’ choices and to compare programs with common criteria.
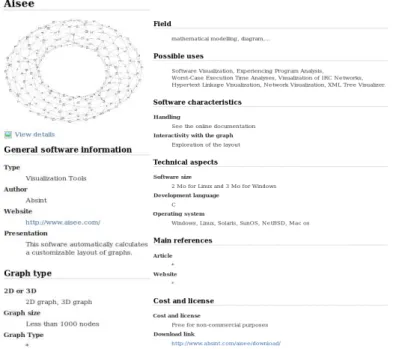
Each program has its own description card (Fig. 1) made of a screenshot, general information (e.g. author(s)’ name, website, . . . ), specific information on the visualization (e.g. possible uses, graph type(s), . . . ), technical information (e.g. operating system(s), license(s), . . . ) and references (e.g. publication(s), web-site(s)). Each card is described by an XML file. The files are managed with the native XML database “Exist ”. Some of the existing functionalities are an auto-matic indexing of the data and an organization of the XML files in collections like in a computer hard-disk. The communication with the user’s web browser is done with the Apache Tomcat servlet container via “JavaServer Pages (JSP)”. This technology allows to easily create websites with a dynamic content indepen-dent from the server and client architectures. In addition, the site allows users
to propose new programs by simply completing an enclosed form. Finally, the site has an XQUERY-based search engine.
Fig. 1.Example of a software description card.
The content of the site keeps evolving by the addition of new programs and new functionalities. We are currently working on a benchmark for comparing different programs on the same graph base. However, as the graph description format is different for each program, we are working on a format converter via the Graph Exchange Language (GXL) [7].
References
1. Kaufmann, M., Wagner, D., eds.: Drawing Graphs: Methods and Models. Volume 2025 of LNCS. Springer (2001)
2. Mutzel, P., Jünger, M.: Graph Drawing Software. Springer Verlag (2003) 3. http://rw4.cs.uni-sb.de/users/sander/html/gstools.html.
4. http://directory.google.com/Top/Science/Math/Combinatorics/Software/ Graph_Drawing.
5. http://www.dia.uniroma3.it/research/ACG.html. 6. http://www.visualcomplexity.com/vc/index.cfm.
7. Winter, A.: Exchanging graphs with GXL. In Mutzel, P., Jünger, M., Leipert, S., eds.: Graph Drawing: 9th
Int. Symp. (GD’01). Volume 2265 of LCNS. Springer (2002) 485–500