Pour l'obtention du grade de
DOCTEUR DE L'UNIVERSITÉ DE POITIERS UFR des sciences fondamentales et appliquées
XLIM
(Diplôme National - Arrêté du 25 mai 2016)
École doctorale : Sciences et Ingénierie des Systèmes, Mathématiques, Informatique (Limoges) Secteur de recherche : Traitement du Signal et des Images
Présentée par :
Hong Nhung Pham
Graph-based registration for biomedical images
Directeur(s) de Thèse :
Philippe Carré, David Helbert, Pascal Bourdon Soutenue le 11 février 2019 devant le jury
Jury :
Président Ludovic Macaire Professeur des Universités, Université de Lille 1 Rapporteur Jean-Christophe Burie Professeur, L3i, Université de la Rochelle
Rapporteur Jean-Pierre Da Costa Maître de conférences, IMS, Bordeaux Sciences Agro Membre Philippe Carré Professeur, XLIM, Université de Poitiers
Membre David Helbert Maître de conférences, XLIM, Université de Poitiers Membre Pascal Bourdon Maître de conférences, XLIM, Université de Poitiers Membre Sylvie Treuillet Maître de conférences, Polytech, Orléans
Membre Frederic Louradour Professeur, XLIM, Université de Limoges
Pour citer cette thèse :
Hong Nhung Pham. Graph-based registration for biomedical images [En ligne]. Thèse Traitement du Signal et des Images. Poitiers : Université de Poitiers, 2019. Disponible sur Internet <http://theses.univ-poitiers.fr>
´
Ecole doctorale Sciences et Ing´enierie des Syst`emes, Math´ematiques, Informatique Secteur disciplinaire Traitement du Signal et des Images
Th`
ese de doctorat
Graph-based registration for biomedical images
Pr´esent´ee par : Hong Nhung PHAM
XLIM, UMR CNRS no7252
Sous la direction de :
Philippe CARR´E, David HELBERT et Pascal BOURDON
Devant le jury compos´e de :
Directeur de th`ese:
Philippe CARR´E, Professeur, Universit´e de Poitiers
Co-directeurs de th`ese:
David HELBERT, Maˆıtre de Conf´erences, Universit´e de Poitiers Pascal BOURDON, Maˆıtre de Conf´erences, Universit´e de Poitiers Rapporteurs:
Jean-Christophe BURIE, Professeur, Universit´e de La Rochelle
Jean-Pierre DA COSTA, Maˆıtre de Conf´erences, HDR, Bordeaux Sciences Agro Examinateurs:
Ludovic MACAIRE, Professeur, Universit´e de Lille 1
Sylvie TREUILLET, Maˆıtre de Conf´erences, Polytech’Orl´eans Fr´ed´eric LOURADOUR, Professeur, Universit´e de Limoges
This research was carried out at ASALI department of XLIM Laboratory, France. During the time of my research, I was given marvelous support and assistance by those who contributed to this research.
First of all, I would like to express my profound gratitude to my supervisor Prof. Philippe Carr´e, my co-supervisors David Helbert and Pascal Bourdon for giving me the opportunity to do PhD at XLIM laboratory. I was provided much guidance by them throughout my time of research. I am thankful for all of their ideas, en-couragements and supports. I appreciate that they guided me in the right research direction, but still prioritized my ideas and allowed this research to be my own work. My sincere acknowledgment is given to my thesis supervisor Prof. Philippe Carr´e for his motivation and immense knowledge. His ideas were always the helpful in solving many problems that I encountered during my research and helped my writing to be well organized. I give special thanks to David Helbert for always keeping me mo-tivated and inspiring me during the most difficult times of my research. He always believed in me and looked at the bright side of things. Whenever the going was tough and I got stuck, I sought him for help, and his optimism relieved my stress. He was always patient to give me suggestions as well as to fix all of my mistakes. I would also like to give appreciation to Pascal Bourdon for his advice and counseling. He was always able to point out different aspects of each problem as well. That helped me have new ideas to solve the problem.
Special thanks to the reviewers Prof. Jean-Christophe BURIE and Jean-Pierre DA COSTA for reviewing my thesis and providing interesting feedbacks and insight-ful comments. The feedback helped me better prepare for the defense and improve the manuscript as well. I am also grateful to all of the jury members for giving me different questions and ideas which made me look at my research from different perspectives. I am thankful to those who attended my thesis defense and those who contributed to the celebration. You all made my day a memorable one.
Special thanks to my colleagues at the lab for the stimulating discussions and contributing in one way or another to my PhD research. I am thankful to the
Photonique team of the XLIM laboratory for providing the biomedical images and supporting me in understanding the operating principle of the device.
Finally, I must especially express my gratitude to my parents for their consistent supports and always being there for me at all times. Thanks to all my family mem-bers, friends and loved ones for their moral support.
Hong Nhung PHAM Chasseneuil du Poitou February 2019
Multiphoton microscopy has become a powerful tool in biomedical research to vi-sualize the information of cell and tissue biology. The reasons why it has gained popularity are the ability to obtain high resolution optical sectioning, high contrast, and minimal phototoxicity within thick samples. This technology can be applied to applications on living organisms using optical fibers, thus, limits surgical biopsies. The working principle of the fiber scanner in the microendoscope device imposes an outgoing spiral scanning from the center to the periphery of the region to be captured, giving raw data on irregular grids. The term ”irregular grid” refers to the spatial coordinate system of the images. Classically, images are processed on integer pixel coordinates, so called ”regular grid”. In contrast, the images obtained by a spiral scanning have floating coordinates and different point distributions between the cen-ter region and the border. Ultimately, the microendoscope using optical fiber should allow in vivo applications for assessment of dangers (such as cancers). However, such kind of images produced by microendoscope introduces several limitations and challenges: narrow field of view, noise, distortions due to movement of the organisms and the device itself, irregularly sampled data by the spiral acquisition.
This research moves beyond the weaknesses and challenges of the imaging device by introducing novel approaches to image registration and mosaics. In particular, this thesis is formulated under the goal to enhance the field of view of the specialists. This targeted application is considered as a procedure that consists of several steps. It includes providing an appropriate image registration technique that accounts noise, distortions and the irregular sampling before constructing the mosaics.
Firstly, a novel Spectral Graph Wavelet based nonrigid registration approach is proposed to register images on regular grid. The optimization is under the well known Log-Demons framework. The success of this method is proven by its improvements compared to the existing methods that use the similar framework on noisy and non-noisy images on regular grid. This is a stepping stone towards building a registration method of images on irregular grids.
Secondly, motivated by the previous step, an innovative image registration method iii
of images on irregular grids is introduced. Here, the floating coordinates of the points and the difference in point distributions at different regions of the images can be eas-ily taken into account thanks to the Spectral Graph Wavelet decomposition and the Log-Demons framework. Both of these existing researches are fast and simple to implement on different types of data.
Lastly, we construct the mosaics from the image sequence on irregular grids. The registration of images on irregular grids is used to compensate for the motion distor-tions as well as the local deformation within the images.
Keywords: Confocal microscopy, microendoscope, image registration, image stitching, image mosaics, nonrigid image registration, Spectral Graph Wavelets, Demons, Log-Demons.
La microscopie multiphotonique est devenue un outil puissant dans la recherche biom´edicale pour visualiser les informations de la biologie cellulaire et tissulaire. Les raisons pour lesquelles il a gagn´e en popularit´e sont la capacit´e `a obtenir un sectionnement optique `a haute r´esolution, un contraste ´elev´e et une phototoxicit´e minimale dans des ´echantillons ´epais. Cette technologie peut ˆetre appliqu´ee `a des applications sur des organismes vivants utilisant des fibres optiques. Le principe de fonctionnement du scanner `a fibres optiques dans le microendoscope impose un balayage en spirale sortant du centre vers la p´eriph´erie de la r´egion `a capturer, four-nissant des donn´ees brutes sur des r´eseaux irr´eguliers. Le terme ”grille irr´eguli´ere” fait r´ef´erence au syst`eme de coordonn´ees spatiales des images. Classiquement, les images sont trait´ees en coordonn´ees enti`eres de pixels, appel´ees ”grille r´eguli`ere”. En revanche, les images obtenues par balayage en spirale ont des coordonn´ees flottantes et des distributions de points diff´erentes entre la r´egion centrale et la bordure. En fin de compte, le microendoscope utilisant la fibre optique devrait permettre des applications in vivo pour ´evaluer les dangers (tels que les cancers). Cependant, ce type d’images produites par le microendoscope pr´esente plusieurs limitations et d´efis: champ de vision ´etroit, bruit, distorsions dues au mouvement des organismes et du dispositif lui-mˆeme, donn´ees ´echantillonn´ees de mani`ere irr´eguli`ere par acquisition en spirale.
Cette recherche va au-del`a des faiblesses et des d´efis du dispositif d’imagerie en introduisant de nouvelles approches d’enregistrement des images et de mosa¨ıques. En particulier, cette th`ese est formul´ee dans le but d’am´eliorer le champ de vi-sion des sp´ecialistes. Cette application cibl´ee est consid´er´ee comme une proc´edure comportant plusieurs ´etapes. Cela inclut la fourniture d’une technique appropri´ee d’enregistrement d’image prenant en compte le bruit, les distorsions et l’´echantillonnage irr´egulier avant la construction des mosa¨ıques.
Premi`erement, une nouvelle approche d’enregistrement non rigide bas´ee sur Spec-tral Graph Wavelet est propos´ee pour enregistrer des images sur une grille r´eguli`ere. L’optimisation se fait dans le cadre bien connu de Log-Demons. Le succ`es de cette
m´ethode est prouv´e par ses am´eliorations par rapport aux m´ethodes existantes qui utilisent le mˆeme cadre pour les images bruit´ees et non bruit´ees sur une grille r´eguli`ere. Il s’agit d’un tremplin vers la construction d’une m´ethode d’enregistrement des images sur des grilles irr´eguli`eres.
Deuxi`emement, motiv´e par l’´etape pr´ec´edente, une m´ethode innovante d’enregistrement d’images sur des grilles irr´eguli`eres est introduite. Ici, les coordonn´ees flottantes des points et la diff´erence de distribution des points au niveau des diff´erentes r´egions des images peuvent ˆetre facilement prises en compte grˆace `a la d´ecomposition Spectral Graph Wavelet et au cadre Log-Demons. Ces deux recherches existantes sont rapides et simples `a mettre en œuvre sur diff´erents types de donn´ees.
Enfin, nous construisons les mosa¨ıques `a partir de la s´equence d’images sur des grilles irr´eguli`eres. L’enregistrement des images sur des grilles irr´eguli`eres est utilis´e pour compenser les d´eformations de mouvement ainsi que la d´eformation locale au sein des images.
Mots-cl´es: Microscopie confocale, microendoscope, enregistrement d’image,
cou-ture d’image, mosa¨ıques d’images, enregistrement d’image non rigide, Spectral Graph Wavelets, Demons, Log-Demons.
1 Introduction 1
1.1 Scientific objectives . . . 2
1.2 Thesis Organization . . . 4
2 Image Acquisition 5 2.1 Two photon microendoscope . . . 5
2.1.1 Double-clad air-silica microstructured endoscopic fiber . . . . 6
2.1.2 Scanning trajectory . . . 9
2.2 The microendoscopic images . . . 12
2.3 Conclusion . . . 15
3 Overview of Image Registration Concepts 17 3.1 Image Registration . . . 18
3.1.1 Non-rigid Image Registration . . . 19
3.1.2 Demons Framework and the Variants . . . 27
3.2 Summary and Discussion . . . 30
4 Graph-based Image Registration on a Regular Grid 33 4.1 Introduction . . . 34
4.2 Graph Theory . . . 35
4.2.1 Review on Graph Theory . . . 35
4.2.2 Graph definition . . . 37
4.2.3 Spectral Graph Theory . . . 40
4.3 From Demons Framework to Spectral Demons . . . 45
4.3.1 Demons Framework . . . 45
4.3.2 Spectral Demons . . . 49
4.3.3 Application of the process to microscopic images . . . 53
4.4 Spectral Bspline . . . 57
4.4.1 Bspline Registration . . . 57 vii
4.4.2 Spectral Bspline Image Registration . . . 61
4.4.3 Results . . . 62
4.5 Spectral Graph Wavelet (SGW) based Image Registration . . . 66
4.5.1 Objective function . . . 67
4.5.2 Results . . . 69
4.6 Conclusion . . . 77
5 Image Registration and Mosaicing of Images on Irregular Grids 79 5.1 Introduction . . . 79
5.2 Problem Formulation . . . 80
5.3 Graph construction for image on irregular grid . . . 84
5.4 Registration for Images on Irregular Grids . . . 87
5.4.1 Experimental Results . . . 90
5.5 Mosaics of images on irregular grids . . . 94
5.5.1 The workflow of mosaics construction . . . 95
5.5.2 Results . . . 97
5.6 Conclusions . . . 103
6 Conclusion and Perspectives 105 6.1 Future works . . . 107
4.1 Mean Square Error (MSE) between the fixed image and restored image
of Bspline and Spectral Bspline methods. . . 63
4.2 MSE between the restored image and the fixed image . . . 70
2.1 TPME system . . . 7
2.2 Custom-design air-silica DC-PCF . . . 8
2.3 Different scanning trajectories . . . 8
2.4 System axes . . . 9
2.5 Scanning performed by the optical fiber during excitation on a single axis (a) in using a real axis. (b) using a virtual axis. . . 10
2.6 Circular scan . . . 11
2.7 Spiral image acquisition . . . 12
2.8 Label-free microendoscopy images . . . 13
2.9 Label-free in vivo experiment . . . 14
2.10 Biological images taken by microendoscope . . . 15
3.1 Image registration . . . 18
3.2 Image registration classification . . . 20
4.1 Graph representation of digital image . . . 38
4.2 Graph representation of signal . . . 41
4.3 Feature matching . . . 50
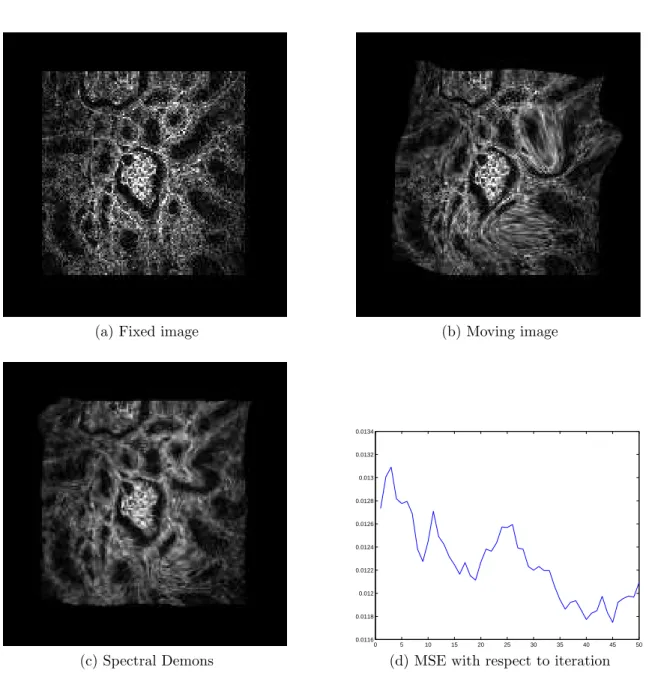
4.4 Spectral Demons method on Microscopic images . . . 55
4.5 Spectral Demons method on microendoscopic images . . . 56
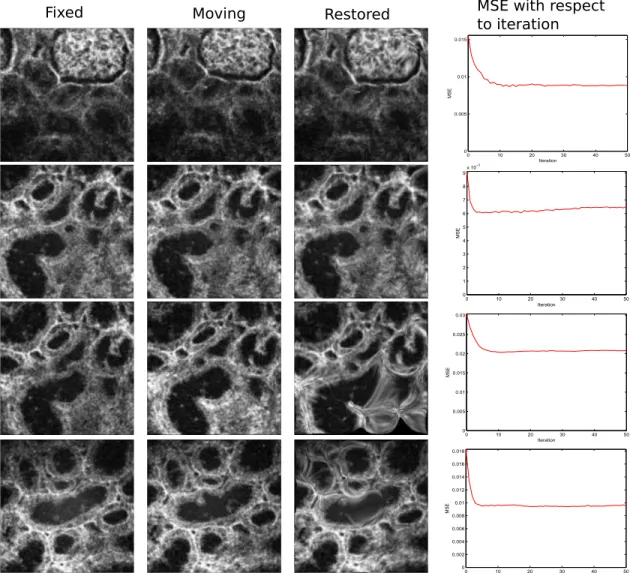
4.6 Comparison between Bspline registration and Spectral Bspline regis-tration of microscopic images . . . 65
4.7 Spectral Graph Wavelet coefficients . . . 66
4.8 Lena image with a random deformed image used in this experiment . 70 4.9 Mean Square Error (MSE) with respect to Gaussian noise, registration of Lena image . . . 72
4.10 Registration of Lena images with random deformations and increasing Gaussian noise added. . . 73
4.11 Pairs of T1 brain images and endomicroscopic images are used in this
experiment . . . 75
4.12 Comparison between our proposal and the existing methods on T1
brain images and endomicroscopic images when no noise is added . . 76
4.13 MSE of Log-Demons, Spectral Log-Demons methods, and our method
with respect to Gaussian noise (standard deviation σnoise) . . . 77
5.1 Panorama construction from a sequence of frames on irregular grids
without nonrigid deformation correction. . . 82
5.2 Two images cropped from an overlapping region of two frames, and the
representation of points on spiral acquisition of 20 turns, 80 points/-turn (the red points belong to the first image and the blue points
belong to the second image . . . 83
5.3 Graph topology of images cropped at different regions of a frame with
spiral acquisition of 20 turns, 80 points/turn . . . 86
5.4 Spectral Graph Wavelet Transform of image on irregular grid . . . 87
5.5 Spectral Graph Wavelets decomposition of a microendoscopic image
on an irregular grid , at 4 scales with respectively 1, 2, 4, 8, 16 of
graph connectivities from the top to the bottom. . . 88
5.6 Comparison between the registered images of our method and the
existing methods for two pairs of images(αg = 2, αs = 1, αi = 6 for
registration on irregular grid) . . . 91
5.7 SNR with respect to the number of iterations . . . 92
5.8 Registration with αg = 10, αs = 5, αi = 20 . . . 92
5.9 Registration result of the first pair of microendoscopic images on
ir-regular grids . . . 93
5.10 MSE values after registrations of the first pair of microendoscopic images with respect to the values of graph connectivity with two sets
of weighting parameters (αg = 1, αs = 5, αi = 20 and αg = 1, αs =
1, αi = 4) . . . 94
5.11 The pipeline to construct mosaic. . . 96
5.12 Two pair of random frames from the image sequence (First row: 9
frame difference, Second row: two consecutive frames) . . . 98
5.13 Panorama created from two frames from the image sequence (9 frame
difference). (Red channel: First image, Green channel: Second image) 99
5.14 Panorama created from two frames from the image sequence (con-secutive frames). (Red channel: First image, Green channel: Second image) . . . 100
5.15 Panorama created from three frames from the image sequence. . . 101 5.16 Panorama constructed from a sequence of 12 frames . . . 102
2PEF Two Photon Excited Fluorescence. AC Auto Correlation.
BFGS Broyden-Fletcher-Goldfarb-Shanno. CM Cut Mirror.
CT Computed Tomography.
DC-PCF Double-clad air-silica microstructured endoscopic fiber. DM Dichroic Mirror.
FFD Free Form Deformation. fps frame per second.
HDR High Dynamic Range. IR Energetic Infrared.
LBFGS Limited-memory Broyden-Fletcher-Goldfarb-Shanno. MI Mutual Information.
MO Micro-optics.
MRI Magnetic Resonance Imaging. MSE Mean Square Error.
NA Numerical Aperture. OD Outer Diameter.
PET Positron Emission Tomography. PZT Piezoelectric Tube.
SEM Scanning Electron Microscopy. SGW Spectral Graph Wavelet. SHG Second Harmonic Generation. SSD Sum of Square Difference.
TPME Two Photon Microendoscope. TPS Thin-Plate Spline.
Introduction
Contents
1.1 Scientific objectives . . . 2 1.2 Thesis Organization . . . 4 The context of this thesis is under the development of the multiphoton microen-doscope which is developed by the Photonics department at XLIM laboratory. The images taken by the novel acquisition system have a narrow field of view. The main aim of this thesis is to construct a mosaic from the image sequence to have a full view panorama.
The development of medical imaging has revolutionized the way physicians, biol-ogists, scientists and patients observe organisms to assess health and diseases. The medical equipments allow users to view inside living objects with or without cutting them open. While some machines such as X-ray machines, MRI machines, CT and PET scanners provide macroscopic views of body parts and organs, the microscope technology is designed to magnify the image of cells and objects that are too small to view with naked eyes. Thus, the microscope technology is one of the most in-novative inventions and has always been an essential tool for assessment of cell and tissue biology. However, a traditional microscope requires a surgical biopsy, meaning samples of tissues must be taken out from the patient to be examined. This process, however, is costly, takes a long time and is sometimes impossible to take samples from all the suspect parts.
The multiphoton microscope used in conjunction with optical fibers can obtain histological examination of living tissues in real time. Such a multiphoton microscope can be referred to as multiphoton microendoscope. This technology overcomes the limitations of classical microscopes in the way it removes or limits surgical biopsies.
In additions, it carries out the advantages of the multiphoton microscope technol-ogy that could produce high resolution optical sectioning, high contrast and least phototoxicity within a thick sample. The optical fiber of the microendoscope scans over time on living objects. Each scan has a spiral path starting from the center to the periphery of the region to be captured, covering a disc-shape. Consequently, the important information, usually located at the center of the region, is emphasized. Despite all the advantages of the multiphoton microendoscopic, processing of the images acquired by this machine suffers from several aspects. The spiral sampling takes place temporally along the spiral path. This process produces a list of points on an irregular grid. The measurements are more at the center than at the borders of the image. The absences of some pixels and information redundancies disrupt the reconstruction of the image. Such images reveal features which introduce additional complexities to process. In addition, the movements of the probe and of the living tissue often cause motion distortions and local displacements.
Furthermore, although the multiphoton microendoscope can provide high reso-lution images, it can not capture a full region of a large area at once. The clinician needs to move the probe around the region to capture several images. It is difficult for physicians to look at several images with a narrow field of view and give an accu-rate assessment. Thus, it is important to construct an accuaccu-rate panorama from the image sequence in order to enhance the field of view. This will in turn help physician have a good interpretation of the images, especially when it may relate to human lives.
This thesis is set out towards the goal of providing an accurate wide field of view in optical biopsy to the clinicians. There are several important building blocks in the pipeline to construct a mosaic. Also, it is indisputable that an appropriate nonrigid registration is necessary to compensate for the soft deformations and distortions of the images in the sequence. This is not only true for microendoscopic images but also for other kinds of medical images.
1.1
Scientific objectives
As mentioned earlier, the aim of this thesis is to construct a mosaic from the microen-doscopic image sequence. This also consists of finding a supportive non-rigid image registration technique that accounts for noise, local deformations and is adapted with the data on irregular grids. Before providing an appropriate approach, these questions should be answered:
irregu-larly sampled data, while to the best of our knowledge, most of the existing applications process the images on a regular grid?
❼ The second question is how to account for the noise and distortions that are unavoidable during the capture?
For such kind of irregularly sampled data, it is important to find an appropriate data representation that helps the mathematical study of the data. In recent years, the signal processing on graphs has been exposed to different types of data, and has been broadened to the computer vision field. The advantage of graph representation is that it is simple and flexible to represent data regardless of the data structure. Recently, the graph spectrum was successfully used in spectral matching and image registration that motivates our research on graph signal processing. This partially answers to the first question that the data are represented by graphs and our registration problem is cast into the graph matching problem.
However, the graph representation is normally computationally expensive and time consuming. This pops up an additional question, which is to find a suitable registration framework that can be adapted to the expensive computation of graphs. A survey of the literature reveals a numerous number of innovative image registration techniques. The Demons approach is one of the most powerful nonrigid registration frameworks. It was found to be computationally efficient and easy to implement. These desirable features of the Demons approach have motivated an extensive num-ber of research to extend from the classical one. The research of Lombaert et al [70], that uses graph spectrum under the Log-Demons framework to successfully regis-ter images with large and complex deformations, has gained much attention in the literature. But it was proven to be sensitive to noise [70].
The first contribution of this thesis is inspired by the success of the Spectral Log-Demons method. The role of graph spectrum was replaced by the Spectral Graph Wavelets while keeping the use of the Log-Demons framework. The Spectral Graph Wavelets decomposition was recently provided by Hammond et al [48]. It is defined through the graph spectral domains, thus, carries out the advantages of the graph spectrum and represents the data at different scales. Our contribution outperforms the existing methods under the Log-Demons framework when noise exists. This answers to our second question of finding a technique that is adaptable to noise.
The second contribution of this thesis is motivated by the previous contribution. The Log-Demons framework is cast to match points of images on irregular grids. While the same framework fails to register the microendoscopic images on regular grid, the method on irregular grids successfully registers the raw data without any projection on a regular grid. Consequently, the mosaic construction with a motion
compensation by the image registration on irregular grids can remove a part of the shearing and misalignments appealing on the mosaic.
In conclusion, this thesis proposes a Spectral Graph Wavelet based image reg-istration method that can be adapted to noisy images. While existing regreg-istration methods either use the classical wavelets or the spectral constraint, our registration method uses the Spectral Graph Wavelets decomposition. This method not only provides an efficient tool to find correspondence between images but also gives new perspectives in using the Graph Wavelets for registration. In addition, our registra-tion method of images on irregular grids gives a new point of view of the way we treat the input images in the continuous domain of the raw data instead of the discrete domain. Ultimately, the mosaic construction from the raw data on irregular grids captured by microendoscope with nonlinear deformation correction can provide an accurate full view of the object to the experts to help their assessment of health.
1.2
Thesis Organization
The remainder of this manuscript is organized as follows:
❼ Chapter 2 introduces the image acquisition process as well as describes the multiphoton microendoscope used to capture images. We here also describe the scanning trajectory of the probe and later point out the properties of the images taken by multiphoton microendoscope.
❼ Chapter 3 provides an exhaustive review of existing non-rigid image registration methods. The analysis of the state-of-the-art of nonrigid image registration and how it is classified is covered in this chapter.
❼ Chapter 4 gives an introduction to our methods on a regular grid. It begins with a review of the spectral graph theory and later describes the registration methods using graph spectrum under the Bspline framework and the Log-Demons framework. We then introduce our contribution using Spectral Graph Wavelets under the Log-Demons framework in the last section of this chapter. ❼ The registration on irregular grids is depicted in Chapter 5. We finally con-struct the mosaic from the image sequence on irregular grids with the motion compensation by the registration on irregular grids.
❼ Chapter 6 highlights the global conclusion on all the presented results and gives future research directions.
Image Acquisition
Contents
2.1 Two photon microendoscope . . . 5
2.1.1 Double-clad air-silica microstructured endoscopic fiber . . 6 2.1.2 Scanning trajectory . . . 9
2.2 The microendoscopic images . . . 12
2.3 Conclusion . . . 15 This chapter provides a description of the image acquisition process. Subsection 2.1 describes the multiphoton microendoscope used for capturing images. It pro-vides the different scanning trajectory and highlights the advantages of the scanning trajectory considered in this work. The working principle of the fiber-scanner is pre-sented briefly. Next, a description of how the camera produces different scanning path is given. Finally, the subsection 2.1.2 introduces how a spiral scanning tra-jectory is obtained. The subsection 2.2 illustrates comprehensive properties of the biomedical images used in this research work. For a more extensive understanding of the acquisition system, we refer the interested readers to the research of Ducourthial et al [31, 30]. The following sections are constructed and partially translated from [31, 30].
2.1
Two photon microendoscope
Multiphoton microscopy has gained popularity in different fields of biological research such as embryology and neurobiology. This is because it has the ability to provide
high-resolution optical sectioning within thick tissue samples, high constrast, with low level of phototoxicity. It has been reported that multiphoton microscopy enables 3D imaging with significantly high penetration depth. As an example, a penetration depth ranging from 500 and 600 microns at 800nm is reported for given samples [51]. In addition, they have been shown to provide reduced image photobleaching. Photobleaching is the phenomenon of signal loss happening when the fluorophore loses the ability to fluoresce. The numerous advantages of multiphoton microscopy contribute to its attractiveness for use in living organisms, using an optical fiber.
Figure 2.1 describes the structure of a two photon microendoscope (TPME). As shown in Figure 2.1, the TPME system is fed by a standard MIRA 900 Ti:Sapphire oscillator (150fs, 76MHz, 810nm, 10nm, 2W). In order to control polarization, three different half-wave plates are used where it is necessary in the setup. A micro-optics (MO) is used to focus the beam at the endoscopic fiber output.
2.1.1
Double-clad air-silica microstructured endoscopic fiber
The Double-clad air-silica microstructured endoscopic fiber (DC-PCF) is designed using smaller core size in order to improve special resolution and TPME excitation efficiency [31]. Figure 2.2 shows the cross-section of a custom air-silica DC-PCF. It is made of a small single-mode inner core in order to ensure high spatial resolution while preserving the desired temporal confinement of excitation pulses. The inner core is made of pure silica that delivers energetic infrared (IR) ultrashort pulses. The ultrashort pulses are essential for efficient multiphoton excitation, at the output of a several meters long optical fiber, which is required in a clinical environment. It has a diameter of around 3.5µm, a numerical aperture (NA) of 0.13 at 800nm and free from autofluorescence since it is made of pure silica. Light is guided in the core using a surrounding air-silica microstructured cladding. The cladding is in turn surrounded by a second cladding acting just like a second large area collecting core. The second cladding allows for collecting the visible light that is useful during deep tissues in vivo imaging. Light guidance is multimode and allowed by an air-clad i.e. outer ring of air holes. The multimode second core has a diameter of 188µm. This outer air hole ring has a high air-filling fraction providing a NA of 0.3 at 400nm. It is used to guide all the light collected by the imaging micro-lens located after the endoscopic fiber.
Figure 2.1 – TPME system with linear and nonlinear pulse shaping [31] (a) Scheme of the experimental setup; CM: cut mirror; DM: dichroic mirror; PZT: piezoelectric tube. The miniature fiber-scanning imaging probe is embedded inside a 2.2mm outer diameter (OD) stainless steel biocompatible tube. (b) Second order auto correlation (AC) of the IR excitation pulse at the exit of the 5m long endoscopic fiber for a delivered power of 20mW . The corresponding pulse duration is 39fs (FWHM), assuming a deconvolution factor of 1.54.
Figure 2.2 – Custom-design air-silica DC-PCF used as the endoscopic fiber within the TPME [31] (a) Close view of the inner core of the fiber through scanning electron microscopy (SEM). Pure silica is in grey and air in black. (b) SEM image of the fiber cross-section without its outer polymer mechanical cladding. The silica jacket and the second core diameters are respectively equal to 266µm and 188µm. The red square denotes the inner core and its microstructured cladding which are depicted in (a). (c) DC-PCF flexibility.
2.1.2
Scanning trajectory
There exist several possibilities of scanning trajectory by the laser spot. Figure 2.3 (left) shows a classical scanning method, where the scanning path involves rows and columns. This allows for a homogeneous sampling of the field, but requires a massive difference between the frequencies of the two axes of movement, with a significantly high frequency ratio (about frequency values of hundreds). Another sampling method, shown in Figure 2.3 (middle), follows a spiral path. This scanning method produces a dense sampling of the center field. This scanning is useful in cases where in-depth observation of thick sample in the center field of view and end at the edges such as an embryo are required. Another possibility, shown in Figure 2.3 (right), is to use a Lissajous scan by sending two sinusoidal signals of different frequencies on the two mirrors. A major disadvantage of this approach is that it leads to under-sampling at the center of the field and over-sample at the image periphery.
Spiral scanning method is chosen because it is the most adequate and suitable solution for cases where the most important information is usually located at the center of the observed field. This helps to avoid under-sampling of vital information in the observed field. Next, the working principle of the fiber-scanner is presented briefly. A piezoelectric ceramic tube (PZT) revolves around the fiber, allowing for imposing the trajectory of the last few millimetres of the fiber forming a resonating cantilever. Thus, creating an outgoing spiral scanning pattern in two dimensions. After optimization, it is possible to work with a large field of view without image distortion at a rate of 8 frames per second (fps).
Y y
X
x θ
Figure 2.4 – System axes. −→x , −→y : axes defined by the actual electrodes;−→X and −→Y : defined axes by the virtual electrodes corresponding to the resonator’s own axes.
The optical fiber micro-scanner is excited on its own mechanical axes using virtual
electrodes (Vx, Vy). The virtual electrodes themselves correspond to a linear
(X, Y ) which correspond to a linear combination of the two actual electrodes (x, y) defined by the equations 2.1 and 2.2.
− → X = cos(θ)−→x + sin(θ)−→y (2.1) − → Y = − sin(θ)−→x + cos(θ)−→y (2.2)
Here, (Vx, Vy) and (VX, VY) represents voltages applied on the real and virtual
elec-trodes respectively. In Figure 2.4, the value of angle θ is determined by applying a
sinusoidal voltage solely on the axis −→X such as:
VX(t) = cos(ωt) (2.3)
VY(t) = 0 (2.4)
This is achieved when real voltages are applied:
On x : Vx(t) = cos(ωt) cos(θ) (2.5)
On y : Vy(t) = cos(ωt) sin(θ) (2.6)
The value of θ is varied while the shape of the trajectory obtained by the camera is observed. If θ is zero, an elliptical trajectory is produced, serving as the starting point from which a rectilinear trajectory can be produced. Figure 2.5 shows the path of the fiber before and after optimization of the value of θ ( θ = 0.5585 rad = 32
degree). As displayed in Figure 2.5 (b), the angle between axis −→x and −→X is 31.75
degree and corresponds to the value of θ used to synthesize the control signals.
Figure 2.5 – Scanning performed by the optical fiber during excitation on a single axis (a) in using a real axis. (b) using a virtual axis.
Spiral scanning trajectory is obtained by drawing a circular path from the object center with increasing radius. The equations below give the definitions of the voltage applied on the axis for circular scan:
VX(t) = cos(ωt) (2.7)
VY(t) = sin(ωt + φ0) (2.8)
Figure 2.6 (a) shows an ellipse oriented according to the axis. The weight of each axis is adjusted using a simple coefficient of amplitude in order to obtain an improved result. This is shown in Figure 2.6 (b).
Figure 2.6 – Circular scan (a) before, (b) after adjusting the weights of the two axes. In brief, the working principle of the fiber-scanner is that a piezoelectric ceramic tube goes around the fiber. By this, the trajectory of the last few millimetres of the fiber forming a resonation cantilever is imposed. Thus creating an outgoing spiral scanning pattern in two dimensions. Once the circular trajectory is obtained in a controlled manner, it is necessary to do amplitude modulation. This is carried out in order to obtain a spiral path starting from the center to the periphery, covering a disc-shaped image field (Figure 2.7). The example is a scan of ten rounds. Considering the horizontal axis, we can see twenty samples along the axis and a twofold number of turns. In a real case, the trajectory scans 125 turns, taking 500 samples each turn, giving 500 x 125 = 62500 pixels in total. The next section describes the characteristics of the biological images taken by microendoscope.
−0.2 −0.1 0 0.1 0.2 −0.2 −0.1 0 0.1 0.2 Sample Scan Vx V y
(a) Spiral scanning (b) Microendoscopic image
projected on a regular grid Figure 2.7 – Spiral image acquisition
2.2
The microendoscopic images
Until now the acquisition system of the microendoscope has been described. It plays an important role in forming the distinct features of the microendoscopic images. In this section, the microendoscopic images and their characteristics in the image processing field are depicted. Figure 2.8 shows the outcomes of the TPME tested ex vivo on various unstained biological tissue samples.
Figure 2.8(a) and Figure 2.8(b) show the SHG images of the collagen fiber net-work of a thick unstained intact and flesh rat tail tendon. In order to prove that TPME provides high sensitivity, the images were obtained without averaging at 8fps and with 5mW of power on the samples. The red arrows indicate the rectilinear polarization impinging the sample. The SHG signal is stronger when the excitation polarization is parallel to the collagen fibers, proving the ability of the TPME to perform nonlinear polarization anisotropy probing. Figure 2.8(c) shows a bimodal image of a label-free section of a mouse ear. The most paramount parts of the ear have been identified on the figure D: dermis; E: epidermis; IC: internal cartilage. Figure 2.8(d) shows a sample of a healthy human lung taken in the alveolar area (i.e. alveolar wall and alveolar entrances). This sample was recorded at a depth of 100µm below the sample surface. The extracellular matrix elastic fibers appear in red through intrinsic 2PEF while some amount of SHG in green from collagen is detected entangled in the main elastin fiber. The pulmonary alveolar duct and alveolar entrances can be seen in the left part of the figure. Figure 2.8(e) shows a perspective view of a collagen-rich tissue of a mouse aorta, while (f) to (h) shows three perspective views of the extracellular matrix network at 3 different locations
Figure 2.8 – Label-free microendoscopy images of fixed tissue samples ex vivo [31]. Intrinsic 2PEF in red (elastin) and SHG in green (collagen). (a) to (d): raw optical sections. (e) to (h): perspective view from Image 3D software from a set of sixty optical sections each one corresponding to a given depth below the tissue surface, from depth 0µm to 300µm.
within a healthy human distal lung sample. In vivo experiment, Authors [31] ob-served the kidney of a living anaesthetized mouse using the TPME. Figure 2.9 shows the label-free captured images in the in vivo experiment.
As mentioned earlier, spiral sampling is preferred here because it is the most suitable solution for cases where the most important information is usually located at the center of the observed field. However, such images (produced by spiral scanning) exhibit features which introduce additional complexities in processing. In order to study the features of such images and their related problems, let us consider the images in Figure 2.10. The images are the ones used in this work and they were taken by the microendoscope in grayscale.
The spiral sampling may introduce a number of problems such as:
❼ Inaccuracy in comparing two image parts: since the point density is more at the center and lower at the edge regions, the center of an image corresponds to the edge region of another image. Hence, comparing the two parts may not be accurate.
❼ Complexity in spiral image acquisition: this is mainly due to data complexity and variety (or additional steps) for acquiring the images.
Figure 2.9 – Label-free in vivo experiment [31] (a) Anaesthetized mouse with one kidney being elevated from the body and clamped between two tongue depressors, beneath the 2.2 mm TPME probe (red arrow). A constant power of 30mw was launched onto the tissues. (b) SHG (in green) and 2PEF (in red) raw image of respectively the collagen of the capsule and the intracellular flavins of epithelial cells of the kidney tubules. (c) same as in (b) but with a larger FOV of 450µm (d) successive optical sections of a fibrosis kidney, 6 days after fibrosis induction, taken just after mouse death; the imaging depth below the organ surface is indicated in the bottom in white; in (d), FOVs are 250µm wide.
❼ Difficulty in finding appropriate shape feature approach: this is due to deforma-tion such as stretching, compression due to heart rate, breathing or distordeforma-tions that occurs while recording.
❼ Difficulty in image texture feature analysis: this is due to uneven illumination caused by moving or spinning motion of tiny tissues.
Figure 2.10 – Biological images taken by microendoscope
2.3
Conclusion
In this chapter, the principle of the multiphoton microendoscope with the new tech-nology, as well as the spiral scanning trajectory of the fiber optic were briefly re-viewed. Such scanning is preferable when important information is placed at the center of the region to be captured. The images obtained after vivo test on living object have disc-shape. The measurement are more at the center while there are missing points at the regions close to the edges. Therefore, processing on microen-doscopic images may introduce several challenges. Firstly, the difference in point distributions of the center and the outer regions of the images makes it difficult to find an appropriate similarity measurement between two images. Secondly, the complexity of the spiral image acquisition makes the processing on this kind of data more complicated. Thirdly, the images taken on soft tissues do not likely have shape features. This is because of the deformations due to the stretching of the tissues, movement and distortions due to heart rate and the effect of the device, making it difficult to find an appropriate shape matching technique. Lastly, the uneven
illumi-nation changes and the complex texture of the images are also challenging problems to overcome.
Although the images taken by microendoscope have great resolution, and impor-tant information is captured, the images are still limited to the narrow field of view due to the size of the probe. The images suffer from distortions and noise due to the movement of the sensor, breathing and heart rate of the object. The small field of view makes it difficult for the image readers (such as doctors) to give an accurate assessment of the patients’ diseases. A good way to enhance the image field of view is to do image mosaics. To do that, it is important to find a supportive image regis-tration method that can adapt to the properties of the images. Ideally, the method should be able to register the images with a spiral acquisition.
This work proposes to develop image registration and stitching method on regular and irregular grid. In particular, the next chapter provides an overview of different image registration methods. After that, our contribution in image registration for biomedical images on regular grids is described. Motivated by this contribution, an image registration approach on irregular grids to adapt with the spiral acquisition is then proposed. The registration on irregular grids is then used to compensate the local distortion in our last contribution in image mosaics from the images on irregular grids.
Overview of Image Registration
Concepts
Contents
3.1 Image Registration . . . 18 3.1.1 Non-rigid Image Registration . . . 19 3.1.2 Demons Framework and the Variants . . . 27
3.2 Summary and Discussion . . . 30
Nowadays, medical image processing is indispensable in many critical medical equipments such as microscope and endoscope, PET and CT scanners, ultrasound and MRI machines, and X-ray machines. Medical imaging is required to be highly accurate as it is one of the keys related to human life. The applications can help doctors evaluate patients’ health, assist surgeries and assess dangers appearing on the sample. The development of these equipments requires the improvements of the image processing part as well. Image registration is a key block in any medical image processing application and is consequently required to meet higher demands. This chapter provides a review of different image registration methods in the literature. Hence, showing the development of image registration in the past decades.
3.1
Image Registration
Image registration is a fundamental block that spatially determines the correspon-dence between points or regions of two images of the same scene but obtained from different viewpoints and at different times or with different sensors (Figure 3.1). It is considered as a valuable assistant in many applications in computer vision such as atlas construction, image recognition and mosaicing, especially in medical imaging. Comprehensive review can be found in previous surveys [139, 133, 132, 108, 85].
In general, image registration is recognized as rigid/affine and non-rigid depending
Image 1 Image 2
Transformation
Figure 3.1 – Image registration
on the nature of the transformation of objects in the images. The rigid/affine im-age registration accounts for the rotational and translational transformation globally on the entire image and the more sophisticated method is called affine registration. In contrast, the non-rigid image registration locally measures small displacements and finds non-uniform mappings between the images. In medical imaging, most of the transformations are complex (e.g. deformations of body cells due to the sensor movement and heart rate, anatomical variations in brain structures of different indi-viduals) and recognized as non-rigid so that the rigid/affine registration is no longer adequate. Non-rigid image registration satisfies the problem of different local geo-metric changes. It overcomes the limitations of the rigid image registration strategy.
This research focuses on the non-rigid image registration approach that account for the local movements of image elements.
3.1.1
Non-rigid Image Registration
Nonrigid image registration that finds the optimal deformable mapping between two images plays an important role in medical imaging. To explain the definition of this task more technically, the first image is referred to as the fixed image F and the other is called the moving image M . The application finds the optimal correspondence map φ from F to M that maximizes the similarity between F and M ◦φ. In the literature, the objective function is usually defined as a combination of two components, one is
the image similarity ESim between the fixed image and the moving image influenced
by the transformation map φ, while the other term is a regularization term EReg that
smooths the transformation. The transformation is then achieved by:
φopt = argminφ(ESim(F, M ◦ φ) + EReg(φ)), (3.1)
where the composition operator M ◦ φ expresses the transformation of M according to the transformation map φ.
According to Sotiras et al [109], nonrigid image registration can be divided into three stages: transformation model, similarity measurement, and optimization method. Registration methodologies can be classified with respect to the divergence of each stage according to [109]. For instance, based on the transformation model criterion, registration methodologies can be roughly categorized into different cate-gories such as elastic model, optical flow, spline model and diffusion model. Similarly, according to the similarity measurement criterion, the registration can be classified as geometric based method, intensity based method and hybrid method. The classi-fication based on the optimization stage divides the existing methods into different groups as Gradient descents, Gaussian Newton, Markov random fields and random walk. This can be seen graphically in Figure 3.2
Figure 3.2 – Image registration classification (Sotiras et al [109])
3.1.1.1 Transformation Model
The first research on optical flow motion estimation was proposed by Lucas and Kanade in 1981 [77]. This research has since motivated a tremendous quantity of research in image registration and alignment with different models. The simple definition of motion is that one point is assumed to keep the same intensity value over time, such that:
Lucas-Kanade algorithm supposes that the flow is constant in a local neighbor-hood and proposed a technique that uses image intensity gradient to iteratively compute the optical flow of a patch. On the other hand, Horn and Schunk [56] min-imize the mean error with an additional smoothness constraint that rather relies on the velocity of image pixel than on computing the differences in intensity. Another method that can work in case of fast movement was introduced by Bouguet in 2000 [13] that computes optical flows at different scale levels and passes the result from a higher level to a lower level.
A numerous number of other methods have been proposed over the past decades to handle the non-rigid image registration problem with different models and more sophisticated schemes. The choice of the transformation model is an important key that decides the robustness of the optimization.
The first model we can mention is the elastic deformation model. The idea of elastic based registration methodologies is that the moving image is deformed until it matches the fixed image. There exist an extensive number of researches based on this model [9, 103, 42]. Terzopoulos et al [112] introduced an approach for shape and non-rigid body motion reconstruction using external forces as energy constraints. Baicscy et al [9] and Shen et al [104] extended the previous works on elastic model to hierarchical schemes. More recently, in 2007, Ashburner [3] proposed a fast diffeomorphic registration based on elastic energy, in which the flow field is considered as a member of Lie algebra [72] through the exponential map. Deformations with larger magnitudes can be captured by viscous fluid models [27, 28, 20].
Since Thirion’s research [114], the diffusion model has become popular and mo-tivated other researches on the problem of deformable image registration, especially medical images. The registration consists of two main steps, namely the demons force search which is similar to optical flow and the regularization by a Gaussian kernel. Depending on how the demon forces are determined and how regularization is operated, different alternative versions of the Demons approach can be acquired.
Pennec et al [89] provided an insight of the Demons algorithm that the energy minimization can be considered as a second order gradient descent scheme. Cachier
et al [14] introduced a hidden auxiliary correspondence variable to put the similarity optimization and regularization in a well-posed optimization problem. The opti-mization on Demons framework with stationary velocity field was combined with the exponential map on the Lie group [72] to introduce a diffeomorphic registration [121], and symmetric log-domains registration [122]. Lorenzi et al [73] developed a regis-tration method based on the similar stationary velocity fields. It is built upon the Log-Demons framework to parameterize the transformation. The method is adapted with the similarity metric that implements a symmetric local correlation coefficient. More recently, Hadj et al [47], motivated by [73], incorporated the similarity metric with a confidence mask to improve the robustness of the algorithm. Fischer et al [36] proposed a fast diffusion based registration that exploits the underlying PDE for the regularization. Wang et al [125] recommended adaptive force strength adjustment iteratively in the iteration process . That improves the performance of the algorithm. The Demons framework was extended to spherical image registration in the work of Yeo et al [135]. Locally adaptive regularization was proposed in [15, 86]. Mansi et al [81] introduced a mathematical justification of the demons Gaussian regularization, in which the Gaussian smoothing is replaced by an elastic-like regularization.
The common point of those methods is that, the motion estimation is inspired by a physical model and the transformation must be consistent with some physical properties. On the other hand, a vast number of methods are derived by some interpolation schemes where deformations are known for some given sample points of the image. In this case, the rest of the image is interpolated through an interpolation function.
One of the important models is the Thin-Plate Spline (TPS), which was early used in registration problems by Bookstein et al [12]. Rohr et al [94] take into account the localization error of each landmark for deformation field approximation based on TPS. Rohr et al ’s research [93] is an extension of [94]. They showed that the estimation can tackle isotropic and anisotropic errors of the landmarks. Li et al [67] proposed a Compact Support TPS method and the support is restricted locally. Recently, the TPS can also be coupled with rigid/affine models to estimate dense matching for 3D ultrasound images [78], or is used to define the transformation while
training the images with convolutional neural networks in 3D image registration [33]. The Spline based motion model [111] takes over the majority in the class of registrations based on an interpolation strategy. The displacement field is modulated by a set of coefficients or a basis function and a set of control points. In other word, the displacement vector at each pixel is a linear combination of the displacements estimated at the control points.
The Free Form Deformation (FFD) is one of the most popular and successful models among the existing Spline based models in medical imaging. It was early proposed by [101]. The Bspline is the most successful among the spline based meth-ods because it is smooth, fast and can handle hierarchical schemes [21, 64]. For example, Rueckert et al [96] first applied Bspline into 3D MRI image registration with a steepest gradient descent optimization, and later in [95]. The authors showed how the deformation field can be constrained with different penalty functions, and tested on different biomedical images. Motion estimation is sometimes performed only on some region of interest while most of the Bspline based methods use a reg-ular grid of control points, [126] extended the problem to a method that uses an irregular grid of control points. The advantage of this model is that diffeomorphism and smoothness might be guaranteed.
From a theoretical point of view, the spline based approach, especially the FFD model allows to find smooth transformations. However, these methods suffer from performance and complexity drawbacks because of the gradient search optimization. In comparison, the Demons model originally does not guarantee smoothness, but it is fast in performance and is a strong theoretical framework that can be efficiently de-coupled with a diffeomorphic transformation. Our research includes the examination of these two models to find the most appropriate framework to our resources.
3.1.1.2 Similarity Measurement
Concerning the similarity measurement, it can be referred as voxel intensity similarity or image structure similarity. Therefore, with respect to the similarity measurement, image registration can be classified as intensity based, geometric based and hybrid
method that combines the two types of measurement.
Intensity based algorithms measure image similarity directly on the image grey values. They can be referred to as template matching technique. The most popular similarity measurements that can be used are cross-correlation, intensity difference and mutual information. Intensity cross-correlation based methods estimate how two images are linearly related. The larger the value of correlation, the better the two images match with each other. Fonseca et al [39] measure the spatial resolution, rotation and translation for remote sensing images. Andrew Simper [107] proposed a more sophisticated system to correct more complex mis-registration rather than just translation such as perspective changes and transformations caused by lens im-perfections. Rikard Berthilsson [11] were able to formulate the correlation between two images when there is an affine transformation. Although most cross intensity correlation based methods are suitable for images of same modality, Van et al [118, 32] showed that this method can also be applicable to match CT and MR images. Later, [110] applied a multi-resolutional scheme using cross correlation to adapt with MR-PET registration. Avants et al [6] maximize the cross correlation between im-age pairs while the moving imim-age is iteratively warped toward the fixed imim-age. Until now, the work still continues to gain attraction in the field of image processing [34, 5, 127].
In contrast to the Cross-Correlation based methods that maximize the image similarity, the intensity difference supposes two images that have the same struc-tures should have the least difference, thus the optimization minimizes the difference between two images. It is usually based on the sum of square difference (SSD) [4, 41, 131, 115, 129, 7, 61, 29]. For example, [128] employs SSD as an objective function to infer the perspective transformation. [29] minimizes SSD to align HDR images with fast translation and rotation. This is the most important and widely used similarity measurement in the field of non-rigid image registration.
While most of the mono-modal image registration researches use the intensity similarity/difference, the mutual information (MI) methods are present in most of registration methods for images of different modalities [139]. In this method, im-ages are supposed to have the maximal statistical dependence when they are best
aligned. For example, Collignon et al [25] measure the entropy of the joint probabil-ity distribution of the intensities of matched points in the two images. [123] presents an approach to MR and CT image registration. Maes et al and Collignon et al [79, 24] compute the entropy of the joint histogram. In [113], mutual information optimization is adapted to multi-resolution image pyramids.
In contrast to the intensity based method, the geometric based method is also known as feature based method that takes into account the geometrical structures or landmark information (e.g. edges, shapes, contours, graphs, surfaces,...) of the images. The feature based technique is divided into two stages: feature extraction and feature matching. Different key point detectors to extract features were pro-posed in the literature such as Harris [49], SIFT [74] and the variants, SURF [10] and the variants. Region, edge, corner, point or shape can also be seen considered as features. For example, the region feature is usually applied to nature images that focus on image with region of interest such as forests, lakes, fields, urban areas [40, 46, 50, 57, 102]. The edge feature based approach is efficient for images where edge information is well preserved. For instance, Li et al [66] proposed a contour-based approach to multisensor images. Li et al [68] proposed a matching method of aerial road network. Vujovic et al [124] identified the potential control points via detec-tion of elongated vertical structures of mammographic images and established the correspondence between these points. Lastly, feature extracted by wavelets is also widely used because of its ability to support multi-resolution scheme and image rep-resentation in both time and frequency domains, as well as its ability to characterize texture images. In this case, the image features are extracted via wavelet decom-position. The registration step then becomes a feature matching problem [53, 38, 134, 88]. Once the features are determined, they are put into the feature matching problem.
In the irregular sampling context, the points have floating coordinates and the images have different point densities at different regions of the images. It is difficult to perform a feature matching based on a keypoint detector (e.g. SURF, SIFT) approach. In addition, the images contain much noise and complex texture, a shape based approach such as wavelets that can characterize the shape and texture of the
images is more appropriate in this context. Furthermore, as stated earlier, the study of irregular data needs a good representation that can mathematically characterize the data structure.
Recently, graph matching became popular to formulate a feature matching prob-lem, in which structural constraints are formulated as an attribute of graph matching problem. Graph is a flexible and powerful tool to characterize different kinds of data regardless of whether the data is regular or irregular. A review on graph theory and matching is proposed in the following chapter of this thesis.
The intensity based technique is usually operated by a least squares optimization. Thus, it has the possibility to fall into local minima of non-convex optimization and it is computationally expensive to optimize the full image parameters. Moreover, intensity information alone does not guarantee the matching of objects with struc-tural changes. In other words, this method lacks geometric invariance and is only suitable for images with small displacements. The geometric based technique is more robust to structural changes and scene movements with global transformation. It is, however, limited in case of local deformation and the parts of the image that are not in the feature selection are not considered during the registration process.
Motivated by the fact that intensity based and geometric based methods comple-ment each other, many recent works have combined the two techniques together for more robust matching. The act of combining both methods is known as the hybrid method. Because of the ability to capitalize the advantages of intensity based and geometric based methods, most of the existing applications use the hybrid method for registering images. For instance, the hybrid method can be operated in a hi-erarchical scheme [87, 136, 58] that registers images at multiple scales. In [87], landmark based registration is operated at a coarse scale. Then, the result is prop-agated as initialization for Bspline registration at finer scales. In each scale in [136] the image is registered alternatively with landmark based and intensity based meth-ods. The resulting transformation from intensity based registration is passed to the next landmark based registration of the next scale. Authors [16] obtained non-rigid transformation by incorporating structural registration and grey-level registration. Instead of splitting landmark registration and intensity registration, some methods
utilize structural information as a constraint to optimize an objective function [54, 76, 75, 8, 106, 71].
Recently, the intensity based approach coupled with spectral matching has found great success in terms of medical image registration [71]. This method utilizes the Graph Spectrum to register images under the Log-Demons framework. The success of this approach motivates our research using graph based method and the Log-Demons framework. Let us here provide a brief review of the classical Demons method and its variants.
3.1.2
Demons Framework and the Variants
Biomedical image registration applications are constrained with several aspects. Two of the great important constraints are symmetry and diffeomorphism. The former imposes that the resulting deformation does not depend on the order of the in-put images while the later constraints the transformation to be smooth under large deformation. However, the elastic model in general is still limited to large deforma-tion and is not invertible while the viscous fluid model is computadeforma-tionally inefficient [108]. The Demons algorithm is famous for being computationally efficient. It has inspired a lot of research in symmetric registration and diffeomorphism [119, 73, 6], although the original one [114] is non-diffeomorphic. Let us here briefly review differ-ent methods based on the Demons framework from the classical one to the symmetric diffeomorphic version.
3.1.2.1 Classical Demons
The Demons approach proposed by Thirion [114] performs a non-rigid image-to-image matching as a diffusion process. It is a fast and efficient scheme, simple to implement that provides linear computational complexity [138]. Thus, it has inspired a various number of researches. The demons force was inspired from the concept of Maxwell’s demons in the field of thermodynamics and optical flow equation in image processing field. Classically, the goal of optical-flow based image registration is to find the dense motion field s from the fixed image F tothe moving image M that maps
the intensity space IF of F to the intensity space IM of M . The transformation is
acquired by optimizing the objective function that is defined according to a similarity and a regularity measure:
E(F, M, s) = αiESim(F, M, s) + αrEReg(s), (3.3)
where the weighting parameters αi, and αr respectively control the intensity
sim-ilarity and the level of smoothness of the transformation field, and αi + αr = 1.
Classically, the intensity term can be denoted by the sum of square error or mean square error of intensities of the two images, such that the similarity term is defined by ESim(F, M, s) = ||IF−IM◦s||2, and the regularity term is defined by EReg(s) = ||∇s||2.
The notation ||.|| defines the L2 norm and the notation ∇s means that a Gaussian filter is applied to s. The optimization is therefore operated in two steps. The first step is to find the demon forces at every point under the optical flow constraint. The second step is regularization acquired by applying a Gaussian filter to the transfor-mation field.
3.1.2.2 Alternative to Classical Demons
The energy function in Equation 3.4 indeed leads to a well-pose problem that the smoothness is guaranteed by the regularization term. However, the mixing of the similarity criterion and the regularization makes it difficult to theoretically justify how the optimization operates and makes the optimization steps computationally in-tensive, according to [120]. For a more tractable sub-problem optimization, a hidden auxiliary variable c is used to decouple the similarity optimization and the regular-ization[14]. The global energy function with respect to the current transformation and hidden correspondence is defined by:
Correspondence
The second term dist(s, c)2 = ||s − c||2 helps draw the hidden variable c close to the
actual transformation field s, and αx controls the correspondence uncertainty. The
optimization is an iterative scheme. In each iteration, correspondence is obtained through a free form update field u with an optical flow method to minimize the first composition called ”Correspondence” as in Equation 3.4. And then the regularization is to minimize the second composition called ”Regularization”, that is acquired by
applying a fluid like Gaussian filter with kernel (Kfluid whose standard deviation is
σfluid) to the whole transformation field (s ← Kfluid⋆ (c + u)).
3.1.2.3 The Log Demons
One of the limitations of the Demons method is that it does not guarantee dif-feomorphism. Diffeomorphism maintains the topology of the object and prevent transformation from folding onto itself. The Log-Demons registration proposed by Vercauteren et al [121] provides an invertible and diffeomorphic registration. It is parameterized on the Lie algebra [72] through the exponential map of a stationary velocity field v, with s = exp(v) resulting to a smoother and invertible registration compared to the classical Demons method. The computation of the exponential map of velocity field is estimated with the scaling and squaring method that was well described in [121].
3.1.2.4 Symmetric Log-Demons
The Log-Demons framework is invertible but is not symmetric. The term ”sym-metric” refers to the transformation that ignores the roles of the input images
(sF→M = s−1M→F) which leads to more consistent registration. The Log-Demons
framework is diffeomorphic and invertible, thus, the inverse of the transformation
can be obtained with backward computation s−1 = exp(−v). The symmetric
reg-istration is acquired by minimizing the cost function combining computations from
forward and inverse mappings ssym = argmins(E(F, M, s) + E(M, F, s−1)), that was
introduced in [122]. The optimization is achieved by using similar operation as in the previous version except that the velocity field is computed in forward and backward
mappings. Although the Demons approach of the original formulation is not diffeo-morphic and symmetric, it is still a strong theoretical and fundamental foundation that broadens more robust methods. The underlying optimization framework allows to easily combine the classical intensity and spatial constraints with additional con-straint (such as shape) for robust registrations. It is, in addition, an appropriate framework to incorporate with irregular data since it was originated by the Demons forces of irregularly distributed points.
A more elaborate description of the Demons, the Log-Demons and the Symmetric Log-Demons schemes will be provided in the next chapter of this manuscript.
3.2
Summary and Discussion
In this chapter, a review of the different nonrigid image registration methods is provided. These methods were roughly classified depending on the choices of the transformation model, the similarity measurement and the optimization method. The choice of the transformation model can either be among a physical model or a model derived by an interpolation scheme. The transformation based on physical model must be consistent with some physical properties such as elastic approach and demons approach. The transformation based on interpolation model is interpo-lated by some known sample points such as the Spline family models, also known as parametric models.
The Demons approach is known to be fast to execute and simple to implement and these properties motivate an extensive number of successful researches in the field of medical imaging. Although the classical one is limited to small deformations, it is still a fundamental framework and a solid theoretical foundation in the literature that allows researchers to propose much more powerful frameworks. A part of our research is also motivated by the Demons approach that will be discussed later in this manuscript.
The choice of similarity measurement was classified as intensity based, geometric based and hybrid based approaches. The intensity based method and the geometric based method alone have their own limitations. In fact, they complement each
![Figure 2.1 – TPME system with linear and nonlinear pulse shaping [31] (a) Scheme of the experimental setup; CM: cut mirror; DM: dichroic mirror; PZT: piezoelectric tube](https://thumb-eu.123doks.com/thumbv2/123doknet/7788270.259628/25.918.111.753.128.871/figure-linear-nonlinear-shaping-scheme-experimental-dichroic-piezoelectric.webp)
![Figure 2.2 – Custom-design air-silica DC-PCF used as the endoscopic fiber within the TPME [31] (a) Close view of the inner core of the fiber through scanning electron microscopy (SEM)](https://thumb-eu.123doks.com/thumbv2/123doknet/7788270.259628/26.918.167.806.210.391/figure-custom-design-silica-endoscopic-scanning-electron-microscopy.webp)
![Figure 2.8 – Label-free microendoscopy images of fixed tissue samples ex vivo [31].](https://thumb-eu.123doks.com/thumbv2/123doknet/7788270.259628/31.918.114.754.146.438/figure-label-free-microendoscopy-images-fixed-tissue-samples.webp)
![Figure 2.9 – Label-free in vivo experiment [31] (a) Anaesthetized mouse with one kidney being elevated from the body and clamped between two tongue depressors, beneath the 2.2 mm TPME probe (red arrow)](https://thumb-eu.123doks.com/thumbv2/123doknet/7788270.259628/32.918.165.807.145.354/figure-label-experiment-anaesthetized-elevated-clamped-depressors-beneath.webp)

![Figure 3.2 – Image registration classification (Sotiras et al [109])](https://thumb-eu.123doks.com/thumbv2/123doknet/7788270.259628/38.918.173.790.150.658/figure-image-registration-classification-sotiras-et-al.webp)