Ground subsidence monitoring with SAR interferometry techniques in
1the rural area of Al Wagan, UAE
2Nikolaos Liosis
1*, Prashanth Reddy Marpu
1, Kosmas Pavlopoulos
2and Taha
3Ouarda
3 41Institute Center for Water and Environment, Khalifa University of Science and Technology, 5
Masdar Institute, Masdar City, P.O. Box 54224, Abu Dhabi, United Arab Emirates; 6
2Department of Geography and Planning, Paris-Sorbonne University Abu Dhabi, P.O. Box 7
38044 AD UAE; 3Laboratoires d’Hydraulique Institut National de la Recherche Scientifique 8
Centre Eau Terre Environnement 490, rue de la Couronne Québec (Québec) G1K9A9 9
Canada; 10
*Corresponding author. Email: nliosis@masdar.ac.ae
11
Abstract
12
In this work, we investigate the past and present land deformation in Al Wagan
13
area in the United Arab Emirates. The area is primarily an agricultural region
14
where dependence on groundwater is documented. Such a reliance on ground
15
water resources in a region which is characterized by very low precipitation can
16
lead to significant land subsidence as was observed in this study which
17
identified fast and localized deformation trends. The quantification of terrain
18
distortions of large magnitude and small amplitude in this area with SAR
19
Interferometry is a challenging task using moderate resolution data due to the
20
incoherent surface background. Even though SAR acquisitions were sparse
over this region, the available ENVISAT, ALOS and Sentinel-1A imagery was
22
analysed with differential interferometry and the Small Baseline Subset
23
technique in order to provide fair estimates about the evolution of the
24
deformation pattern in a limited area. The depletion of the aquifer resources
25
which is confirmed from groundwater level data is speculated to be the most
26
probable cause. However these assumptions require further investigation in
27
order to discover a remediation for this problem.
28
Keywords: SAR Interferometry; SBAS; subsidence; groundwater; UAE 29
30
Introduction
31
Excessive groundwater extraction from the subsurface may lead to the depletion of
32
the aquifer’s natural resources, which potentially results in ground surface subsidence
33
phenomena. The agriculture sector of the United Arab Emirates (UAE) has been expanding
34
since the 1990s (Statistics Centre of Abu Dhabi, 2014), but since all these farms are situated
35
in an arid region with a hot desert climate and extremely sparse precipitation events, they
36
mostly relied on groundwater for their viability (Environmental Agency of Abu Dhabi,
37
2009).The direct implications of this are the diminishing natural aquifer resources of the
38
UAE, which has already been analysed in another study (Gonzalez et al., 2016), the
39
degradation of the water quality (Vrba, 2003; Al-Naeem, 2014) and the occurrence of
40
localized terrain subsidence (Holzer and Galloway, 2005).
41
Differential Synthetic Aperture Radar (SAR) Interferometry (DInSAR) is one of the
42
most effective remote sensing methods to quantify terrain distortions related to various
causes over a large spatial scale (Bürgmann et al., 2000; Ferretti, 2014). The multi-temporal
44
stacking techniques that have been developed in the past two decades, like Persistent
45
Scatterers (PS) (Ferretti et al., 2001; Hooper et al., 2004) and Small Baseline Subset (SBAS)
46
(Berardino et al., 2002; Lanari et al., 2004), are capable of providing accurate estimations of
47
the displacement time series and the deformation velocities, with the latter method being
48
more suitable for rural regions as it is based on identifying Distributed Scatterers (DS) that
49
are more common in natural environments in a stack of small baseline interferograms. There
50
already exist numerous studies where groundwater related subsidence phenomena were
51
successfully assessed with SBAS techniques (Chaussard et al., 2014; Kim et al., 2015;
52
Artesea et al., 2016). However, the accuracy and the reliability of the results is affected by
53
temporal decorrelation in rural areas where incoherent surface types, like sand and vegetation
54
are the dominant land covers (Bamler and Hartl, 1998; Massonnet and Feigl, 1998).
55
DInSAR applications are very sparse in the UAE mainly due to the extended presence
56
of the sandy geological background which significantly degrades the performance of the
57
process and the reliability of the final outputs. A previous study had demonstrated the
58
application of SBAS over an extended area of the Eastern part of the UAE focusing on the
59
most coherent parts and providing rough indications about the locations of particular ground
60
distortion zones (Cantone et al., 2013). However, to the authors’ knowledge, there are no
61
existing studies attempting to monitor localized surface deformations in the UAE at small
62
scales. The major challenge in this rural area where the subsidence phenomena were
63
extremely fast and localized was to define the optimum data resolution that allowed the
64
detection and depiction of the real deformation magnitude in the presence of high
65
decorrelation noise.
This work is part of the study currently being conducted in the UAE aiming to detect
67
regions affected by subsidence phenomena induced by subsurface resources exploitation and
68
to provide quantitative estimations about the spatiotemporal patterns of the terrain
69
displacements. The objective of the present work is to analyse the observations obtained by
70
conventional DInSAR and SBAS techniques and to demonstrate that despite the presence of
71
low coherence that obstructs the interferometric processing, reliable results may still be
72
obtained to provide a comprehensive overview of the subsidence phenomenon in the study
73
area over a larger spatial extent than is possible by sparse permanent GPS stations.
74 75
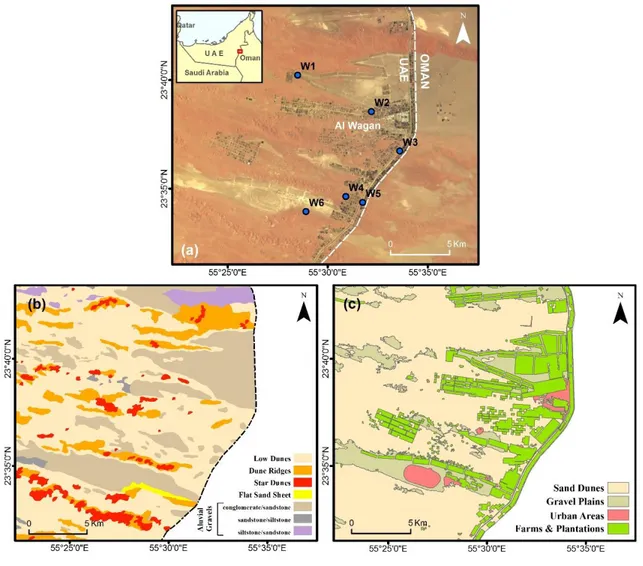
Study Area
76
Al Wagan is located on the eastern part of the Abu Dhabi Emirate, approximately 65
77
kilometres southwest of the city of Al Ain at the borders with Oman. Figure 1a depicts the
78
study area along with the locations of monitored wells from the Environmental Agency of
79
Abu Dhabi (EAD). It is a hot and arid region at the edge of the Rub' al Khali desert with a
80
generally flat terrain - except for the star dunes - at an average altitude of 170 meters. The
81
surrounding area of this sparsely populated town facilitates many farms at the west side of
82
the borders which unequally spread up to 18 kilometres towards the desert gradually fading
83
out. The farms along with other vegetated areas cover around 71 km2 over a total area of
84
approximately 357 km2.
85
The borders of the UAE with Oman at the study area roughly depict the transition
86
from the fluvial deposits in the east to the Aeolian deposits to the west. The geological
87
background of the north part of the region where the main settlement is sited consists of
88
fluvial quaternary deposits which are composed of a mixture of sandstone, conglomerates
and siltstone (Hili formation), formed by torrent activity originating from the Omani
90
mountains. The central and southern parts are mainly covered by low and star dunes of sandy
91
material transferred by aeolian processes. The heterogeneity of the local geology shown in
92
figure 1b is clearly visible in radar and optical satellite imagery and sporadic shifts between
93
these two main background types are not uncommon. The geological map of the area is not
94
totally reflected on the land use map (figure 1c), implying that the farms are not located
95
exclusively on the alluvial fans but on the sand deposits as well.
96
There were no active faults in the study area observed in the geological maps neither
97
mentioned in literature. The nearest regions that were affected by active tectonism in the
98
studied period were the Fujairah Mountains and the Musandam Peninsula (Yagoub, 2015).
99
Therefore it was considered in this study that the effects of earthquakes on surface
100
deformations were negligible and they were not taken into account.
101 102
103
Figure 1. a) Landsat 8 composite image (bands 4, 3, 2) of the study area dated 26/5/2017. b) 104
Geological map (BGS) c) Generalized land cover map (EAD). 105
106
Data
107
The interferometric analysis was performed with the use of the freely available
C-108
band and L-band SAR data covering the study area. Two C-band image stacks acquired from
109
the ENVISAT satellite by the Advanced Synthetic Aperture Radar (ASAR) sensor were
110
obtained from the European Space Agency (ESA). The descending stack consists of 32
111
acquisitions covering the period 7/8/2003 – 22/4/2010, while the ascending includes only 10
images from the period 3/4/2007 – 14/10/2008. Other C-band data used in this study were
113
the available Sentinel-1A acquisitions over the area of interest, but the sparsity of the data
114
did not allow a proper time series analysis. Three SAR acquisitions were used for differential
115
interferogram generation dated 18/2/2016, 2/12/2016 and 8/3/2017. The L-band data were
116
also sparse over this region, consisting of 7 ALOS PALSAR acquisitions from the period
117
5/8/2007 – 10/8/2009 obtained from the Alaska Satellite Facility (ASF). The general
118
characteristics of these radar data are presented in table 1.
119 120
Table 1. Main characteristics of the SAR data used in the study.
121 Sensor Number of images Pass Track/Frame Acquisition Mode Polarization
ENVISAT/ASAR 32 Descending 435/3123 IW-IM VV
ENVISAT/ASAR 10 Ascending 13/459 IW-IM VV
ALOS/PALSAR 4 Ascending 460/567 FBD HH-HV
ALOS/PALSAR 3 Ascending 460/567 FBS HH
Sentinel-1A 3 Ascending 130 IW VV-VH
122
The topographic phase removal was performed with the 3 arcsecond Digital Elevation
123
Model (DEM) of the Shuttle Radar Topography Mission (SRTM). Other data that were used
124
include the geological map of the area produced by the British Geological Survey (BGS)
125
under contract from the Ministry of Energy of the UAE, the Terrestrial Habitat map of the
126
UAE and the groundwater levels from the monitored wells of the study area obtained from
127
the Environmental Agency of Abu Dhabi (EAD) in the period 5/3/2000 – 9/9/2015.
128 129
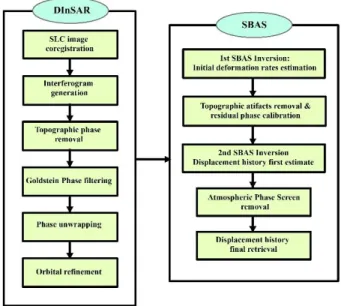
Methods
130
DInSAR relies on the isolation of the deformation phase component which
131
corresponds to the terrain movements between the two SAR acquisitions of similar geometry.
132
The Single Look Complex (SLC) images of each stack were coregistered on a single master
133
scene in order to compute the interferograms. Due to the flat relief of the study area the
134
SRTM DEM of 90 m. resolution was considered adequate for subtraction of the local
135
topography, since differences between trials with the ASTER and the 30 m. resolution SRTM
136
DEMs were insignificant. The Goldstein method was used to apply frequency domain phase
137
filtering to the differential interferograms (Goldstein and Werner, 1998) with small windows
138
in order to avoid aliasing fast deformation fringes, at the expense of preserving a lot of
139
decorrelation noise in the final outputs. After the phase unwrapping stage (Pepe and Lanari,
140
2006), orbital refinement was performed for estimation and removal of residual phase ramps
141
from the unwrapped interferometric stack by selecting ground control points common for all
142
the generated interferograms.
143
The SBAS technique is based on generating and stacking a series of interferograms
144
with small perpendicular baselines in order to reduce the spatial decorrelation effects.
145
Therefore, the DInSAR process was applied to interferograms that satisfied certain
146
temporal/perpendicular orbit criteria depending on the monitored surface types, the critical
147
baseline and the relative space-time dispersion of the acquisitions in each stack. At the first
148
inversion of the SBAS algorithm a primary estimate of the mean velocity field was obtained
149
by applying a low degree displacement model to the unwrapped phases. This low pass
150
deformation component along with possible topographic remnants was subtracted from the
wrapped interferograms. Subsequently, the residual phase was unwrapped and added back to
152
the subtracted deformation signals (Berardino et al., 2002).
153
In the second step the refined unwrapped interferograms were inverted with a
154
Singular Value Decomposition (SVD) approach in order to derive the time series of the
155
displacements (Lanari et al., 2007). The atmospheric signals were removed with low pass
156
spatial and high pass temporal filtering operations (Ferretti et al., 2000) and the final
157
deformation history and velocity of the multi-temporally coherent pixels was extracted along
158
with the topographic residuals between the DEM and the actual ground surface. The results
159
were geocoded in UTM zone 40N projected coordinate system and the data processing was
160
mainly performed with Sarscape software. The general workflow of the interferometric
161
processes applied in this study is summarized in figure 2.
162 163
164 165
Figure 2. Flow chart of the interferometric processes. 166
Interferometric processing and results
168
ENVISAT data
169
Since the acquisitions of the descending stack were temporally irregular with a gap
170
period from July 2004 to February 2006 (figure 4b), the thresholds for interferogram
171
generation were set to 800 days temporal / 360 m. perpendicular baseline in order to avoid
172
underlaps in the stack. The coherence maps showed that the alluvial gravels were remaining
173
generally coherent for more than two years in short baseline interferometric pairs, but the
174
coherence of the sand dune areas was completely lost within 35 days. The block structured
175
farms located in the sandy areas maintained their coherence at moderate levels for 100 - 150
176
days.
177
Despite the low phase signal quality the differential interferograms revealed a fast
178
subsidence pattern extended throughout the whole farmland area with the deformation
179
magnitude along the Line-Of-Sight (LOS) peaking at several points within the region,
180
especially along the west side of the highway that links the border settlements. In the central
181
and south regions, the deformations were even greater. But this observation relied only on
182
small temporally separated pairs as temporal decorrelation prevented from obtaining long
183
term estimations. A seasonal variation was also observed as the summer period pairs tended
184
to exhibit larger displacement signals than those of the winter season, reaching almost one
185
fringe per month south of the town of Al Wagan. If the observed subsidence was related to
186
groundwater pumping, the increased water demands of agriculture in a desert environment
187
during the hot and dry periods could explain this phenomenon. These primary observations
188
were consistent in all the temporally coherent interferograms of both the ascending and the
189
descending stacks, which reinforced the initial assumption of a fast subsidence phenomenon.
191
192 193
Figure 3. Differential interferograms from ENVISAT pairs. a) From descending pair 3/4/2004 - 194
9/3/2006, where temporal and fast fringes decorrelation are dominant in long time spans. b) 195
Descending pair 29/11/2007 - 17/4/2008, indicative of the lower fringe rates in the winter seasons. c) 196
Descending pair of 17/4/2008 – 26/6/2008. d) Descending pair 7/5/2009 - 11/2/2010, where the 197
deformation pattern is clear despite the decorrelation noise. e) Ascending pair 3/4/2007 – 12/2/2008. 198
f) Ascending pair 8/1/2008 – 27/5/2008. 199
200
The detection of this fast subsidence pattern depended on the maximum detectable
201
deformation gradient, which theoretically is one fringe per pixel (Massonnet and Feigl,
202
1998). Since in reality this threshold is significantly lower due to the presence of
203
decorrelation noise in low coherent areas (Baran et al., 2005), and fast fringes decorrelation
204
was observed in all the interferograms of more than two years separation, the images were
multilooked 1 x 5 (range x azimuth). For larger factors, the deformation pattern became
206
undetectable or ambiguous even in temporally adjacent pairs.
207
In order to obtain an initial estimation of the deformation velocities, interferometric
208
stacking was applied (Strozzi et al., 2001) after the phase unwrapping stage with pairs of
209
short perpendicular baselines (< 250 m). Due to temporal decorrelation and phase
210
unwrapping failures the reliability of the output linear deformation velocities was
211
compromised, however the areas of stability were delineated for subsequent reference point
212
selections.
213
The interferograms of the descending stack were then used as inputs for the SBAS
214
algorithm.After discarding the pairs with significant unwrapping errors, 84 interferograms
215
were inverted in order to extract the displacement history and velocities of the
multi-216
temporally coherent points. The relative time-baseline position of the images is shown in
217
figure 4b. The resulting deformation maps showed that cumulative subsidenceexceeded 1
218
meter and LOS displacement rates reached -18 cm/year in the most affected areas during the
219
sampling period, with the time series exhibiting a small seasonal effect. However, the
220
coherent pixel grid was sparse at the central and south parts of the study area where
221
subsidence appeared larger in the short temporal baseline interferograms, exhibiting
222
displacements equal or lower than those of the north part. Decorrelation and unwrapping
223
errors prevented from obtaining accurate estimates in those regions.
224
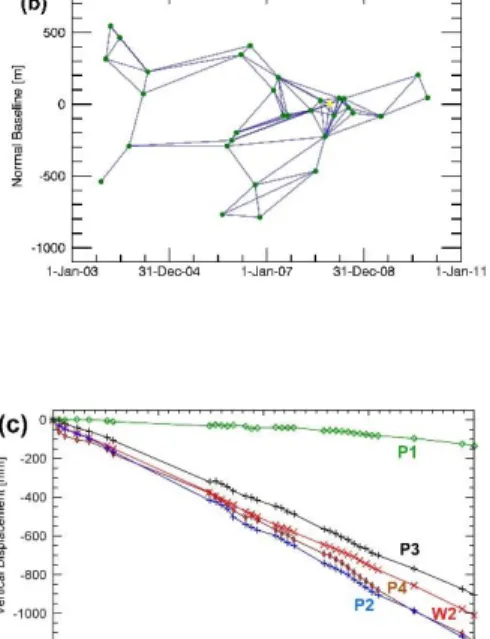
Figure 4a depicts the vertical deformation rates in the study area (valid under the
225
assumption of negligible horizontal component). Point P1 is located in the northernmost part
226
of the region where even though displacement rates were low, an accelerating subsidence
227
trend was observed after 2007. P2 is sited in the fast subsiding area near the town at the local
deformation maximum, while W2 is a monitored well within the same area. P3 and P4 are
229
representative points of the central and south subsiding regions respectively. Even though
230
according to the displacement history of figure 4c they exhibit lower or equal deformations
231
with point P2, it is noted that coherence levels were marginal in these areas and a sufficient
232
density of measure points was not achieved.
233
As a general observation, the linear model that was applied to the displacement
234
velocities could roughly capture the seasonal behaviour of the ground deformations. It is also
235
noted that a quadratic model was a more appropriate fit in the southern region proximate to
236
P4 as it was in the area of P1, with the subsidence phenomenon slightly accelerating after
237
2006. In either case, it is not certain whether this was due to the higher frequency of
238
acquisitions after that year (figure 4b), since the large temporally separated pairs of the
239
preceding gap period included many phase inconsistencies in the low coherent areas.
240 241
242 243
244 245
246 247
Figure 4. a) Vertical displacement velocities of the period 2003 - 2010. b) Time position plot
248
of the descending stack images, where nodes and arcs represent scenes and interferograms
249
respectively. c) Displacement history of selected points in the study area.
250 251
253
Figure 5. Evolution of the LOS deformation pattern obtained from the descending
254 acquisitions. a) 7/8/2003 - 22/7/2004. b) 7/8/2003 - 22/6/2006. c) 7/8/2003 - 22/5/2008.d) 255 7/8/2003 - 22/4/2010. 256 257
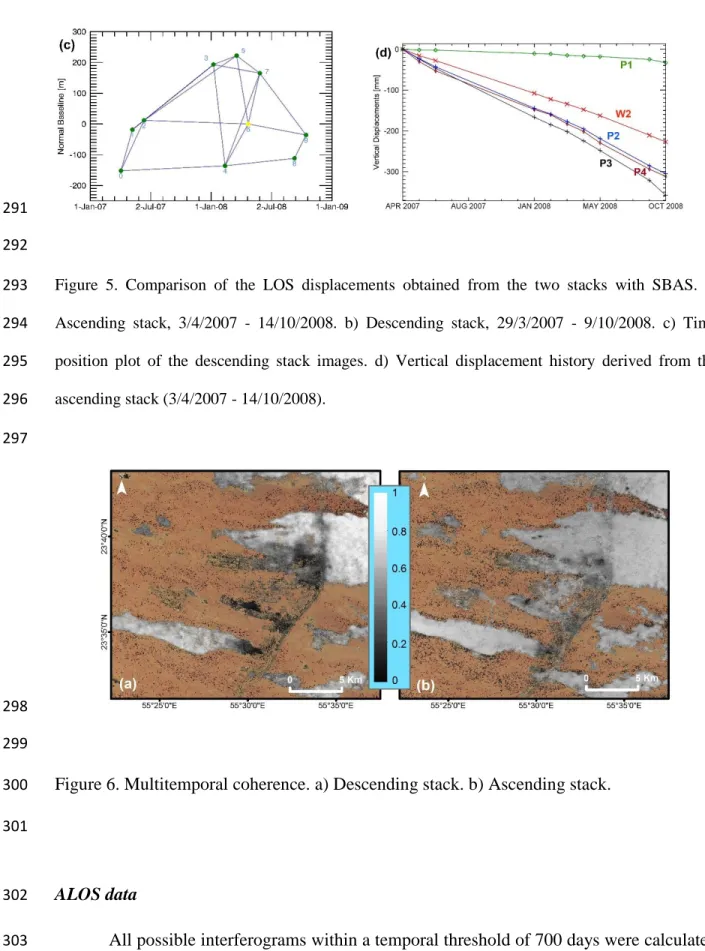
The SBAS technique was applied with 20 interferograms of the ascending stack
258
within 400 days temporal separation and 330 m. maximum normal baseline for comparison
259
with the results obtained from the descending stack. The generated maps replicated the
260
ground distortion pattern of the previous implementation which verified that the vertical
261
movements were dominant, considering the similar incident angle of the ascending and
262
descending acquisitions. The cumulative LOS displacements derived from the two stacks
263
were comparable in the northern area during similar observation periods.
264
However, in the central and southern regions of the study area, where the
265
multitemporal coherence was increased in the ascending stack, the deformations of the
266
commonly coherent pixels appeared significantly larger than those estimated from the
267
descending stack. These local deviations were mostly attributed to phase inconsistencies
268
induced by decorrelation noise in the interferograms of the descending stack rather than to a
269
horizontal component of the terrain movements. The coherence maps of both stacks are
270
shown in figure 6.
271
The comparison of the cumulative LOS displacements between the two stacks in the
272
sampling period of the ascending acquisitions is demonstrated in figures 7a and b. Figure 7d
273
illustrates the vertical displacement history of the selected points in the study area after the
274
application of a linear model to the subsidence rates. Points P1, P2 and W2 follow the same
pattern as derived from the descending stack. The estimated displacements in these areas
276
were precisely estimated due to the alluvial sediment background, which was adequately
277
coherent in both stacks. Points P3 and P4 exhibited faster subsidence rates than P2,
278
confirming the primary estimate from the differential interferograms of both stacks that these
279
regions were subsiding faster than the northern area.
280
On the other hand, the ascending stack could not provide precise estimates due to the
281
sparsity of acquisitions whereas local phase unwrapping failures in low coherent regions
282
were neither absent in the ascending pairs. Indicatively, the (multitemporal) coherence values
283
of points P3 and P4 were 0.48 and 0.26 respectively contrasted to 0.23 for both points in the
284
descending stack. Even though the time span of the acquisitions included two summer
285
periods,higher order models were not applieddue to the extended low coherent regions and
286
the small number of scenes. Nevertheless, this short time interval was considered too short
287
to draw safe conclusions about the exact deformation behaviour of these areas.
288 289
291 292
Figure 5. Comparison of the LOS displacements obtained from the two stacks with SBAS. a) 293
Ascending stack, 3/4/2007 - 14/10/2008. b) Descending stack, 29/3/2007 - 9/10/2008. c) Time 294
position plot of the descending stack images. d) Vertical displacement history derived from the 295 ascending stack (3/4/2007 - 14/10/2008). 296 297 298 299
Figure 6. Multitemporal coherence. a) Descending stack. b) Ascending stack.
300 301
ALOS data
302
All possible interferograms within a temporal threshold of 700 days were calculated
303
from the HH polarization images of the PALSAR acquisitions as all normal baselines were
less than 2300 m. Interferograms between the FBD and FBS mode acquisitions were created
305
after oversampling the FBD images in range to the pixel spacing of the FBS scenes (Werner
306
et al., 2007). As it was expected, the L-band interferograms exhibited higher coherence levels
307
and greater spatial coverage providing with a more comprehensive picture of the deformation
308
pattern in longer time spans than the ENVISAT pairs. After the phase unwrapping stage, 16
309
interferograms were inverted with SBAS.
310
The resulting deformation maps demonstrated an almost identical subsidence pattern
311
in terms of extent, even though non-systematic deviations were observed in comparison to
312
the C-band derived displacement maps that locally exceeded 2 cm when compared in similar
313
periods. Nonetheless, these differences were considered insignificant after taking into
314
account the small number of the scenes, the subsidence magnitude and the precision of
315
PALSAR in the achieved coherence levels (Pasquali et al., 2014). During the period 5/8/2007
316
– 10/8/2009, subsidence rates of 22 cm/year in the south, 21 cm/year in the central and 16
317
cm/year in the north farmland areas were observed from the ALOS velocity map (figure 8a).
318 319
321 322
Figure 8. a) Subsidence rates obtained from the ALOS data. b) Time-baseline plot of the ALOS 323 images. 324 325 Sentinel-1A data 326
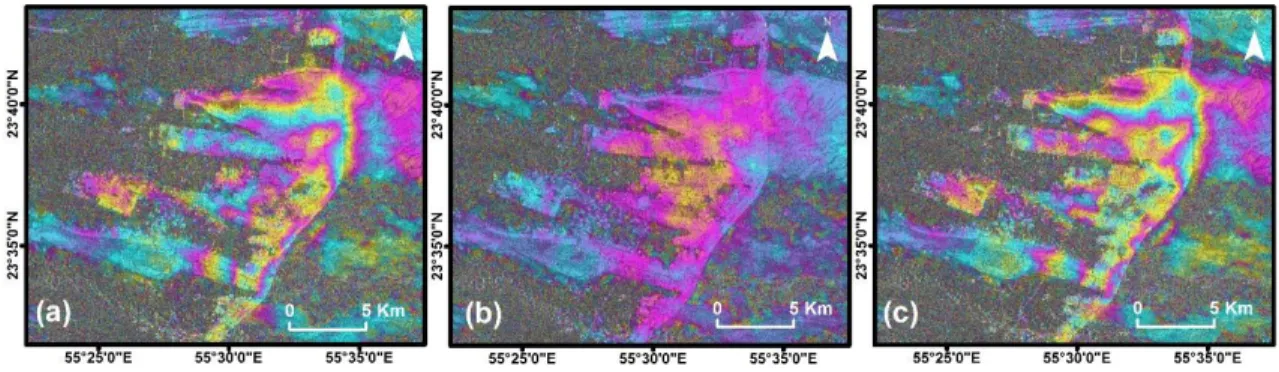
The Sentinel-1A images were multilooked 8 x 2 (range x azimuth) due to the lower fringe
327
rates and the differential interferograms (generated from the vertical polarization component)
328
verified the continuation of the subsidence phenomenon in a similar extent but with a lower
329
magnitude. Deformation fringes are clearly visible in pairs that include the summer season
330
but they are not as prominent in the winter pair, indicating declining deformation trends that
331
might have become a seasonal phenomenon, even though this is still an assumption. The
332
generated wrapped interferograms are shown in figure 9. Results that provide stronger
333
evidence about the recent evolution of the terrain distortions will be obtained when the
334
number of acquisitions from Sentinel-1 will be sufficient for a time series interferometric
335
analysis and the atmospheric artefacts in the interferograms are compensated for. Similar
336
deformation trends were also observed in GPS data recordings of the Abu Dhabi GRS
337
Network station of Al Wagan (personal communication with Abu Dhabi Municipality, Town
338
Planning sector, Spatial Data Division).
340
341
Figure 9. Differential interferograms from Sentinel-1A pairs. a) 18/2/2016 - 2/12/2016. b) 2/12/2016 342
- 8/3/2017. c) 18/2/2016 - 8/3/2017. 343
344
Correlation with groundwater levels
345
Since the subsidence phenomena in Al Wagan were attributed to water pumping from the
346
subsurface, correlations with the groundwater levels were sought. We considered the water
347
level data from local wells monitored by the Environmental Agency of Abu Dhabi (EAD).
348
Even though these measurements were not concurrent and with the same frequency for all
349
the wells, their temporal patterns was examined to define whether a relationship of the
350
groundwater level fluctuations with the terrain deformations exists.
351
The groundwater elevation reduces from east to west verifying that the aquifer surface
352
is inclined towards the west direction as mentioned in a previous study (Al Shahi, 2002). The
353
water level time series of the wells located within the north subsiding area are generally lower
354
contrasted to the surrounding region. This could be possibly related to groundwater extraction
355
which had started before the sampling period, but data prior to 2000 were not available. The
356
number of these wells is not adequate to extract conclusions about the spatial properties of
the local aquifer as these should be examined in a wider area level with more similar datasets,
358
but an indication of these spatial characteristics is locally provided.
359
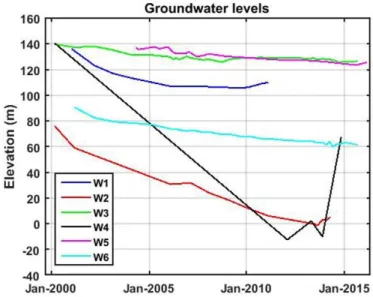
The main observation regards the declining trends exhibited from all of the
360
monitoring wells of the farmland area and the surroundings from 2000 and for the main
361
period of the DInSAR observations 2003-2010. In some of the wells, a recovery trend was
362
observed after 2012 without reaching the levels of 2000-2002, but in other cases the levels
363
were still reducing until September 2015. Inspection of Landsat 5 and 7 imagery from 1984
364
- 2003 showed that the land use scenery changed dramatically during the 1990s, as it was the
365
period of the farmland expansion. However, quantitative evidence about the start of the
366
aquifer resource exploitation was not available. Plots of the time series of the water levels
367
from selected representative wells are illustrated in figure 8.
368 369
370
Figure 10. Groundwater levels of the monitored wells shown in figure 1a. 371
Conclusions
373
Interferometric processing over the agricultural area of Al Wagan revealed a localized
374
subsidence phenomenon which is speculated to be groundwater related. It was observed from
375
different sensors that subsidence velocities reached 20 cm/year during 2003-2010 with the
376
terrain distortions exceeding -1 m. The land deformations of the study area would not have
377
been detected if the resolution was lowered by large multilooking factors. Even though the
378
area is not suitable for interferometric applications due to temporal decorrelation, DInSAR
379
and SBAS techniques may still provide a terrain distortion metric if no other tools are
380
available. The coherence maps were perfectly correlated with the land cover and the
381
geological maps of the region, an aspect worthy of future investigation in order to define and
382
develop the most appropriate techniques for mapping the surface deformations in the broader
383
area of the UAE. The Sentinel-1A data verified that the surface deformation phenomena are
384
still existent in the region constituting a potential hazard for the future.
385
According to the water level data, a correlation of the deformations with the
386
groundwater resources exists. However, these data do not suffice to explain the seasonality
387
of the subsidence pattern, while the fact that some areas are more affected than others even
388
though the water level declinations appear similar or lower suggests that the local geology
389
controls the phenomenon as well. The evaluation of the subsidence velocity field suggests
390
that the loose sandy material background is more prone to terrain distortions than the
391
compacted gravelly sediments of fluvial origin, but this also depends on the thickness of the
392
formations. This aspect will be further sought in the geotechnical engineering properties of
393
the different soil types of the study area by conducting in-situ sampling in the subsiding
farmland area and correlating the different subsidence rates with both the aquifer resources
395
depletion and the geophysical parameters of the varying geological background.
396
Another aspect that could be correlated with the deformation pattern of the farmlands
397
and the groundwater extraction for their maintenance regards the integration of optical
398
imagery within this study. Since the agricultural areas kept expanding during the past 20
399
years and the land cover changes are captured in Landsat images, this type of changes should
400
be reflected in the vegetation indices as well. It is expected that the time series analysis of
401
these indices for this temporal interval will be capable of providing more comprehensive
402
explanations about the excessive use of the aquifer resources in the area and the ground
403
deformations that were induced by this process in the study area. Future work will also
404
include accurate GPS measurements with Global Navigation Satellite Systems (GNSS)
405
equipment to validate the deformation time series that will be derived from the Sentinel-1A
406 data. 407 408 References 409
Al-Naeem, A. A. 2014. Effect of excess pumping on groundwater salinity and water level in Hail 410
region of Saudi Arabia. Research Journal of Environmental Toxicology, 8, 124. 411
Al Shahi, F. A. 2002. Assessment of Groundwater Resources in Selected Areas of AI Ain in the UAE. 412
Artesea, G., Fiaschib, S., Di Martirec, D., Tessitorec, S., Fabrisd, M., Achillid, V., Ahmedc, A., 413
Borgstrome, S., Calcaterrac, D. & Ramondinif, M. 2016. Monitoring of Land Subsidence in 414
Ravenna Municipality Using Integrated SAR-GPS Techniques: Description and First Results. 415
ISPRS-International Archives of the Photogrammetry, Remote Sensing and Spatial
416
Information Sciences, 23-28.
Bamler, R. & Hartl, P. 1998. Synthetic aperture radar interferometry. Inverse problems, 14, R1. 418
Baran, I., Stewart, M. & Claessens, S. 2005. A new functional model for determining minimum and 419
maximum detectable deformation gradient resolved by satellite radar interferometry. IEEE 420
Transactions on Geoscience and Remote Sensing, 43, 675-682.
421
Berardino, P., Fornaro, G., Lanari, R. & Sansosti, E. 2002. A new algorithm for surface deformation 422
monitoring based on small baseline differential SAR interferograms. IEEE Transactions on 423
Geoscience and Remote Sensing, 40, 2375-2383.
424
Bürgmann, R., Rosen, P. A. & Fielding, E. J. 2000. Synthetic aperture radar interferometry to measure 425
Earth’s surface topography and its deformation. Annual review of earth and planetary 426
sciences, 28, 169-209.
427
Cantone, A., Riccardi, P., Baker, H., Pasquali, P., Closson, D. & Karaki, N. A. Monitoring Small land 428
Subsidence Phenomena in the Al-Ain Region by Satellite SAR Interferometric Stacking. 429
Second EAGE International Conference on Engineering Geophysics, 2013. 430
Chaussard, E., Wdowinski, S., Cabral-Cano, E. & Amelung, F. 2014. Land subsidence in central Mexico 431
detected by ALOS InSAR time-series. Remote sensing of environment, 140, 94-106. 432
Environmental Agency of Abu Dhabi 2009. Abu Dhabi Water Resources Masterplan. 433
Ferretti, A. 2014. Satellite InSAR data: reservoir monitoring from space, EAGE Publications. 434
Ferretti, A., Prati, C. & Rocca, F. 2000. Nonlinear subsidence rate estimation using permanent 435
scatterers in differential SAR interferometry. IEEE Transactions on geoscience and remote 436
sensing, 38, 2202-2212.
437
Ferretti, A., Prati, C. & Rocca, F. 2001. Permanent scatterers in SAR interferometry. IEEE Transactions 438
on geoscience and remote sensing, 39, 8-20.
439
Goldstein, R. M. & Werner, C. L. 1998. Radar interferogram filtering for geophysical applications. 440
Geophysical research letters, 25, 4035-4038.
Gonzalez, R., Ouarda, T. B.M.J., Marpu, P. R., Allam, M. M., Eltahir, E. A. & Pearson, S. 2016. Water 442
Budget Analysis in Arid Regions, Application to the United Arab Emirates. Water, 8, 415. 443
Holzer, T. L. & Galloway, D. L. 2005. Impacts of land subsidence caused by withdrawal of 444
underground fluids in the United States. Reviews in Engineering Geology, 16, 87-99. 445
Hooper, A., Zebker, H., Segall, P. & Kampes, B. 2004. A new method for measuring deformation on 446
volcanoes and other natural terrains using InSAR persistent scatterers. Geophysical research 447
letters, 31.
448
Kim, J.-W., Lu, Z., Jia, Y. & Shum, C. 2015. Ground subsidence in Tucson, Arizona, monitored by time-449
series analysis using multi-sensor InSAR datasets from 1993 to 2011. ISPRS Journal of 450
Photogrammetry and Remote Sensing, 107, 126-141.
451
Lanari, R., Casu, F., Manzo, M., Zeni, G., Berardino, P., Manunta, M. & Pepe, A. 2007. An overview 452
of the small baseline subset algorithm: A DInSAR technique for surface deformation 453
analysis. Pure and Applied Geophysics, 164, 637-661. 454
Lanari, R., Mora, O., Manunta, M., Mallorquí, J. J., Berardino, P. & Sansosti, E. 2004. A small-baseline 455
approach for investigating deformations on full-resolution differential SAR interferograms. 456
IEEE Transactions on Geoscience and Remote Sensing, 42, 1377-1386.
457
Massonnet, D. & Feigl, K. L. 1998. Radar interferometry and its application to changes in the Earth's 458
surface. Reviews of geophysics, 36, 441-500. 459
Pasquali, P., Cantone, A., Riccardi, P., Defilippi, M., Ogushi, F., Gagliano, S. & Tamura, M. 2014. 460
Mapping of Ground Deformations with Interferometric Stacking Techniques. Land 461
Applications of Radar Remote Sensing. InTech.
462
Pepe, A. & Lanari, R. 2006. On the extension of the minimum cost flow algorithm for phase 463
unwrapping of multitemporal differential SAR interferograms. IEEE Transactions on 464
Geoscience and remote sensing, 44, 2374-2383.
Statistics Centre of Abu Dhabi 2014. Agricultural land uses 2013 Statistical Report. 466
Strozzi, T., Wegmuller, U., Tosi, L., Bitelli, G. & Spreckels, V. 2001. Land subsidence monitoring with 467
differential SAR interferometry. Photogrammetric engineering and remote sensing, 67, 468
1261-1270. 469
Vrba, J. 2003. The impact of aquifer intensive use on groundwater quality. Intensive use of 470
groundwater. Challenges and opportunities, 113-132.
471
Werner, C., Wegmüller, U., Strozzi, T., Wiesmann, A. & Santoro, M. PALSAR multi-mode 472
interferometric processing. Proc. First Joint PI Symp. ALOS Data Nodes for ALOS Sci. 473
Program, 2007. 19-23. 474
Yagoub, M. M. 2015. Spatio-temporal and hazard mapping of Earthquake in UAE (1984–2012): 475
Remote sensing and GIS application. Geoenvironmental Disasters, 2, 13. 476