HAL Id: hal-01012093
https://hal.archives-ouvertes.fr/hal-01012093
Preprint submitted on 25 Jun 2014HAL is a multi-disciplinary open access archive for the deposit and dissemination of sci-entific research documents, whether they are pub-lished or not. The documents may come from teaching and research institutions in France or abroad, or from public or private research centers.
L’archive ouverte pluridisciplinaire HAL, est destinée au dépôt et à la diffusion de documents scientifiques de niveau recherche, publiés ou non, émanant des établissements d’enseignement et de recherche français ou étrangers, des laboratoires publics ou privés.
Sovereign bond yields in emerging Asia: New evidence
Thi-Hong-Hanh Pham
To cite this version:
EA 4272
Sovereign bond yields in emerging
Asia: New evidence
Thi Hong Hanh Pham*
2014/18
(*) LEMNA - Université de Nantes
Laboratoire d’Economie et de Management Nantes-Atlantique Université de Nantes
Chemin de la Censive du Tertre – BP 52231 44322 Nantes cedex 3 – France www.univ-nantes.fr/iemn-iae/recherche Tél. +33 (0)2 40 14 17 17 – Fax +33 (0)2 40 14 17 49
D
o
cu
m
en
t
d
e
T
ra
va
il
W
o
rk
in
g
P
ap
er
2
Sovereign Bond Yields in emerging Asia: New evidence
PHAM Thi Hong Hanh
1LEMNA, Institute of Economics and Management, University of Nantes
Chemin de la Censive du Tertre, BP 52231, 44322 Nantes Cedex 3, FRANCE
Phone: +33 (0)2 40 14 17 33 /
Fax: +33 (0)2 40 14 16 50
E-mail: [email protected]Abstract:
This paper studies the determinants of sovereign bond yields in nine emerging Asian countries over the period 1994-2012. In the long-run, we first reveal that sovereign bond yields weakly and negatively depends on the changes in public debt. This result is not consistent with the theoretical hypothesis that rising government debt may foster sovereign bond yields through the default risk. Second, we fail to find out a long-run relationship between potential economic growth and sovereign borrowing costs in emerging Asia. Lastly, this paper evidences the preliminary interventions of emerging Asian authorities in separating government debt management from monetary management.
JEL: E43; E44; G18; H63; 016
Keywords: Debt market; Sovereign bond yields; Emerging Asia; Panel analysis
1 The author gratefully acknowledges financial support from the Chair Finance of the University of Nantes Research
3
1.
Introduction
After the 1997 Asian crisis, due to multiple bank failures and the vulnerability of a heavy reliance on foreign currency borrowing, emerging Asia has needed other alternatives to bank credit and foreign currency debt as sources of funding. Moreover, calling for other capital sources could allow emerging Asia to finance its accelerating growth and to avoid currency mismatches. In this circumstance, the choice of emerging Asia has been to develop a well-functioning local currency bond market, including government bonds, corporate bonds and mortgage bonds. A well-functioning local bond market, which is considered as an alternative to the banking sector brings a number of benefits to emerging Asia. First, the development of bond markets not only increases the supply of available financial assets, but also fosters a rise in competition on the financing market and contributes to lower borrowing and intermediation costs for households and companies. Second, the deepening of local bond market also results in the design of more sophisticated financial products (derivatives, securitization…) and the risk diversification. In particular, government bonds provide a benchmark yield curve for the issue of private sector bonds and thus facilitate the pricing. Third, in a strengthened local bond markets, the central banks dispose of more sophisticated instruments for their monetary policy and can apply interest rate policies instead of direct credit control policies. Lastly, a well-functioning yield curve provides efficient information about market expectations and allows central banks to use market-oriented instruments, notably interest rates, to manage their monetary policies instead of manipulating private credit or bank reserve requirements.
To foster the development of local bond markets, Asian authorities have had to face to a number of challenges. One of the key challenges is to shed light on determinants of bond yields. Resolving this issue also allows explaining a tremendous variation in the interest rates across countries and over time, which governments or companies pay on their external debt. In the literature, borrowing costs depend on the fundamental conditions in the economy, and especially the fiscal accounts. However, we should distinguish between long-run and short-long-run determinants of bond yields. The main reason is that the long-long-run linkage between borrowing costs and macroeconomic fundamentals can break down in the short-run, in particular during the periods of financial turmoil. In light of this meaning, the present paper tends to examine the long-run and short-run determinants of bond yields for a sample of emerging Asian countries - one of the most dynamic emerging financial markets. On the other hand, this paper only focuses on determinants of sovereign bond yields due to the fact that information on local currency bonds in emerging countries is lacking. We first employ
4 the General Method of Moments (GMM) estimator developed by Arellano and Bond (1991) for a dynamic heterogeneous panel will be used to assess explicitly the transmission channels through which the macroeconomic fundamentals can affect sovereign bond yields. We also use the Instrumental Variable (IV) estimator that allows controlling for simultaneity bias and reverse causality running from explicative variables to sovereign bond yields.
The rest of this paper is structured as follows. Section 2 reviews the existing literature. Section 3 documents recent trends in local bond yields in emerging Asia. Section 4 describes the data and details the chosen empirical method. Section 5 presents and discusses the empirical findings. Concluding remarks are in Section 6.
2.
Literature review
As mentioned in the introductory section, the existing literature distinguishes between the long-run and short-run determinants of sovereign bond yields. In the long term, the first determinant of sovereign bond yields is potential output growth. According to Laubach (2009), a useful benchmark model, which explains this relationship, is the Ramsey model of optimal growth. Combined with a representative household with CES utility, the Ramsey model implies that the deterministic steady state of the real rate of return on capital is determined by:
= + (1)
where r is the rate of return, g denotes the net growth rate of per capita consumption, σ is the coefficient of relative risk aversion, and θ is the household's rate of time preference. The rate of return positively depends on all three of these parameters.
The second long-run macroeconomic determinant of sovereign bond yields is the government debt. The link between the government debt and real bond yields can be illustrated by the fact that fiscal expansion may reduce private investment. Engen and Hubbard (2004) suggest that a decline in private investment leads to a lower steady-state capital stock, which in turn stimulates marginal product of capital and consequently increases real interest rate. Additionally, by developing an early-warning model of sovereign debt crises, Manasse et al. (2003) imply that rising government debt may foster sovereign bond yields through the default risk premium.
In addition to the long-run determinants, in the short-run, government bond yields may be also affected by a number of macroeconomic variables. First of all, monetary policy rate can affect nominal interest rates through its impact on inflation expectations. As shown in
5 neoclassical models with nominal rigidities (Woodford, 2003), the monetary authority has to control short-term real interest rates and reinforce the role of stabilization policy in order to affect real activity. The government control over short-term real interest rates can be written by the following equation (Laubach, 2009):
= + ∗+ + ∗ (2)
Where is expected inflation in the period (t+1), and the natural rate ∗ is a function of the factors shown in Equation 1 and presents the value of the real interest rate with the presence of nominal rigidities. From Equation 2, the real interest rate between two periods t and t+1 is defined as = − .
Together with monetary policy, financial openness has been considered as a short-run determinant of sovereign bond yields, especially in the case of emerging economies which have experienced comparatively large capital inflows over recent years. For instance, foreign investors can be an important source of demand for local debt securities and thus help lower bond yields (IMF, 2005). Foreign participation can also help increase the liquidity of government bond markets. However, foreign participation could lead to greater rate volatility. Differing from this meaning, Prasad and Rajan (2008) find that foreign participation, supported by the necessary institutional and regulatory framework, may minimize volatility. Lastly, temporary changes in fiscal position and variations of output gap are also considered as the key factors that lead to temporary changes in sovereign bond yields.
To shed light on the theoretical hypotheses, a large number of recent empirical works have been developed. Most of empirical studies have focused on the case of the U.S. and the key role of fiscal imbalance on determining sovereign bond yields. Using a sample of US states , Bayoumi et al. (1995) find that sovereign debt levels affect state spreads versus New Jersey (the benchmark) in a non-linear way. At the mean level of debt, an increase of one percentage point in the ratio of debt to state product can raise 23 basis points in interest rate. The non-linear relationship between fiscal imbalance and bond yields is also found in Conway and Orr (2002) for the major OECD countries, in which the impacts of fiscal factors on interest rate are non-linear and tend to be greater at higher levels of indebtedness. By contrast, employing a VAR approach, Plosser (1987) and Evans (1987) do not support the impact of unexpected changes in fiscal variables on government bond yields.2 On the other hand, several recent studies tend to show that sovereign borrowing costs could depend on
6 expected rather than current fiscal variables. Using predicted values of U.S. fiscal variables as determinants of sovereign bond yields, Laubach (2009) finds that a 1 percentage point increase in the expected government debt-to-GDP ratio raises real long-term government bond yield by about 2-5 basis points. Instead of the case study of the U.S., Chinn and Frankel (2005) use time series data for the 1988-2004 period to study separately the cases of five European countries (France, Germany, Italy, Spain, and the U.K.) and compare with the U.S. The author argues that the impact of a 1 percentage point increase in the government debt-to-GDP ratio on real long-term government bond yields varies slightly across countries. The impact is stronger in European countries, ranging from 5-8 basis points (Germany) to 10-16 basis points (France, Italy, the U.K., and Spain), compared to the U.S., where the impact is 5 basis points.
While the single-country studies mostly explore a static specification or the dynamic impacts of fiscal variables on government borrowing costs, the panel data studies typically employ the Fixed – effects (FE) estimation to resolve the question of interest. Together with fiscal variables measured by the debt-to-GDP ratio, another potential long-run determinants of sovereign bond yields, notably GDP growth, is also introduced in the cross-country studies. Kinoshita (2006) develops a dynamic general equilibrium model linking government bond yields to government debt. The author also provides numerical simulations by using a panel of 19 industrial economies. Kinoshita finds that the simulated and estimated interest rate effects of government debt tend to be small, while an increase in government consumption and debt leads to a considerably larger effect. Precisely, a 1 percentage point increase in the government debt-to-GDP ratio raises the real long-term government bond yield by about 2-5 basis points.
Similarly, basing on a panel of 16 OECD countries over 1960-2002, Ardagna et al. (2007) examines the impact of fiscal deficit and debt on long-term government bond yields through two different econometric approaches. In a simple static specification, they find that a one percentage point increase in the primary deficit relative to GDP increases contemporaneous long-term interest rates by about 10 basis points. On the other hand, in a VAR approach, the same shock leads to a cumulative increase of almost 150 basis points after 10 years. The authors also confirm nonlinearities in the impact of government debt: debt affects the interest rate only in the case of countries with above-average levels of debt. In another study basing on a sample of ten euro area countries over 1979-2002, Faini (2006) finds no significant impact of government debt on long-term government bond yields in individual country
7 regressions while the positive impact of public debt becomes significant for the 10 euro area countries as a whole. Similarly to Ardagna et al. (2007), Faini (2006) also concludes a non-linear relationship between sovereign debt and sovereign borrowing costs.
Recently, Poghosyan (2012) analyzes determinants of sovereign bond yields in 22 advanced economies over the 1980-2010 period by employing the panel cointegration techniques, which allows the author to distinguish between long-run (debt-to-GDP ratio, potential growth) and short-run (inflation, short-term interest rates, etc.) determinants. The main finding is that in the long-run, government bond yields increase by about 2 basis points due to a 1 percentage point increase in government debt-to-GDP ratio and by about 45 basis points due to a 1 percentage point increase in potential growth rate. In the short-run, sovereign bond yields deviate from the level determined by the long-run fundamentals, but about half of the deviation adjusts in one year.
Overall, the existing recent empirical literature on determinants of sovereign bond yields can be subdivided into two strands: single-country studies and panel data studies. On the other hand, to the best of our knowledge, the existing empirical studies seem to only focus on the case of advanced countries, except the contribution of Baldacci and Kumar (2010) using a sample of 31 advanced and emerging economies during the pre-crisis period 1980-2008. According to Baldacci and Kumar, higher deficits and public debt result in a significant increase in long-term interest rates. Moreover, the magnitude of this impact strongly dependents on initial fiscal, institutional and other structural conditions, as well as spillovers from global financial markets. However, the findings of this paper should be taken with caution given the very heterogeneous levels of economic development between advanced economies and emerging economies. The aim of our paper is, therefore, to provide a complementary contribution to the literature as asking for the question “What factors affect the sovereign bond yields in emerging Asia?”, which has not yet deal with in earlier studies.
3.
Recent trends in emerging Asia’s sovereign bond yields
As shown in Figure 1, sovereign bond yields in emerging Asia vary across countries and over the time. Since 1994, a downward trend in government bond yields has been observed in emerging Asia. In the case of Indonesia and the Philippines, the decline has been particularly significant, due to their structurally higher interest rates level. The main reason explaining this trend is the inflation decline and the improvement of economic fundamentals in emerging Asia. Besides, before the subprime crisis period, lower public debt in emerging
8 Asia and abundant global capital source lead to a sharp declining in sovereign bonds’ issuance. This favorable macroeconomic circumstance encouraged both foreign and domestic investors to buy local bonds and then push sovereign bond yields lower.
<Insert Figure 1>
In 2008, following the beginning of global economic recession, Asian sovereign bond yields went through two different phases. First, Asian yields surged in early 2008 due to an important increase in commodity prices, which in turn led to the back of inflationary concerns. Another main factor behind this figure is an important increase in central bank rate hikes as shown in Figure 2 (for example, 219bp in Indonesia, 42bp in India). The second phase began in the last half of 2009 when sovereign bond yields started to decline. This downturn could be explained by the global credit crisis (notably with the Lehman Brothers failure) and the subsequent lower growth and inflation expectations. A remarkable downfall is observed from the last quarter of 2009, when Asian central banks started a cycle of monetary easing and aggressively cutting rates.
<Insert Figure 2>
Despite local and global concerns, sovereign bond markets in Asia staged a recovery in the last quarter of 2011, with most yield curves flattening. So that, emerging Asian bond markets have been largely viewed as a safe haven for domestic and foreign investors for two following reasons. First, the low debt positions of most emerging East Asian economies make them attractive to investors compared with debt-laden Europe. On one hand, the balance sheets of most Asian economies remain strong. On the other hand, the external debt-to-GDP ratios have either declined significantly since 2009, or have stayed at manageable levels. Second, domestic factors in emerging Asia, including healthy banking systems, are also strengthening the bond markets in general and the sovereign bond markets in particular.
4.
Data and empirical methodology
As mentioned above, basing on a sample of 9 emerging Asian countries: China, Hong Kong – China, India, Indonesia, Korea, Malaysia, Philippines, Singapore, and Thailand, this empirical study aims to investigate the long-run and short-run determinants of sovereign bond yields. Given this aim, our empirical strategy endeavors to make maximum use of both the time and cross-country dimensions of available data sets, which dictates using data at a quarterly frequency in the estimation. Our empirical specification partially adopted from Pogoshyan (2012) takes the following form:
9
= + + + + ! + "!# × % + & + ' (3)
where i and t indices denote country and time, and the dependent variable is real sovereign bond yields ( . Equation 3 includes two long-run determinants (LRit-1): the potential growth rate and the debt-to-GDP ratio. In light of the existing literature, we also introduce in the empirical model five short-run determinants *+( : real money market rate (monetary policy effect), changes in inflation (nominal shocks), fiscal balance ratio (short-term fiscal policy), economic growth rate (cyclical fluctuations), and foreign participation in the local bond markets (captured by the stock of foreign holdings of local currency bonds). We also include lagged dependent variable in the right hand side of Equation 3. ,( is a disturbance
term assumed to satisfy the Gauss–Markov conditions. A trend term - has been introduced to allow for a shift of the intercept over time.
Differing from Pogoshyan (2012), we also tend to analyze the impacts of global factors on sovereign bond yields by introducing in the empirical model two indicators ./( . First, the U.S. Federal funds rate is used a proxy for global liquidity conditions. According to Csonto and Ivaschenko (2013), as lower Fed funds rate is assumed to be associated with higher liquidity, it is expected to have a positive relationship the variations of sovereign bond yields. Second, a dummy variable takes the value of 1 during the crisis period and of 0 in other cases. This dummy allows us to resolve the conundrum of government bond yields’ volatility and high fiscal imbalances observed in the aftermath of the crisis.
On the other hand, it is noteworthy that the magnitude of fiscal factors’ impact on sovereign bond yields varies across countries. Baldacci and Kumar (2010) argue that the overall impact of higher deficits on interest rates could be greater in countries with the following characteristics: weak initial fiscal conditions, weak or inadequate institutions, weak structural factors (such as low domestic savings), and limited access to global capital. For this reason, our empirical model also allows for an additional interactive term between the fiscal balance /0( and a dummy variable 1( reflecting countries’ characteristics listed above. However, several econometric problems may arise from Equation 3:
i)
The independent variables are assumed to be endogenous. Because causality may run in both directions – from independent variables to dependent variable and also these regressors may be correlated with the error term.ii)
Time-invariant individual characteristics (fixed effects) can be correlated with the explanatory variables.10
iii)
Introducing lagged dependent variable gives rise to the correlation between the regressors and the error term. Because of this correlation, dynamic panel data estimation of Equation 3 suffers from the Nickell (1981) bias, which disappears only if T tends to infinity.In addition, heteroscedasticity is expected to be present because, in the panel data, heterogeneous errors might exist with different panel members. To resolve these problems, the GMM method developed by Arellano and Bond (1991) seems to produce more efficient and consistent estimators compared with other procedures. This method also eliminates any endogeneity that may be due to the correlation of these country specific effects and the right hand side regressors. If we first difference Equation 3, we get:
∆ = ∆ + ∆ + ∆ + ∆ ! + "∆!# × % + & + ∆' (4)
In equation 4, we have removed group effects and time trend. We now turn to the two key tests of the GMM estimator. The first one is the serial correlation test derived by Arellano and Bond (1991), in which the null hypothesis assumes no serial correlation in error term. Arellano and Bond (1991) introduce the tests for serial correlation, often labelled “m1” for first-order and “m2” for second-order serial correlation. We expect to find the first-order serial correlation in the first differenced residuals. The key problem arises if there is the second or a higher order serial correlation, suggesting that some of the moment conditions are invalid. The second one is the Sargan test to assess the model specification and over-identifying restrictions, whether the instruments, as a group, appear exogenous. This test is also known in the GMM context as the Hansen’s J test.
Data setting
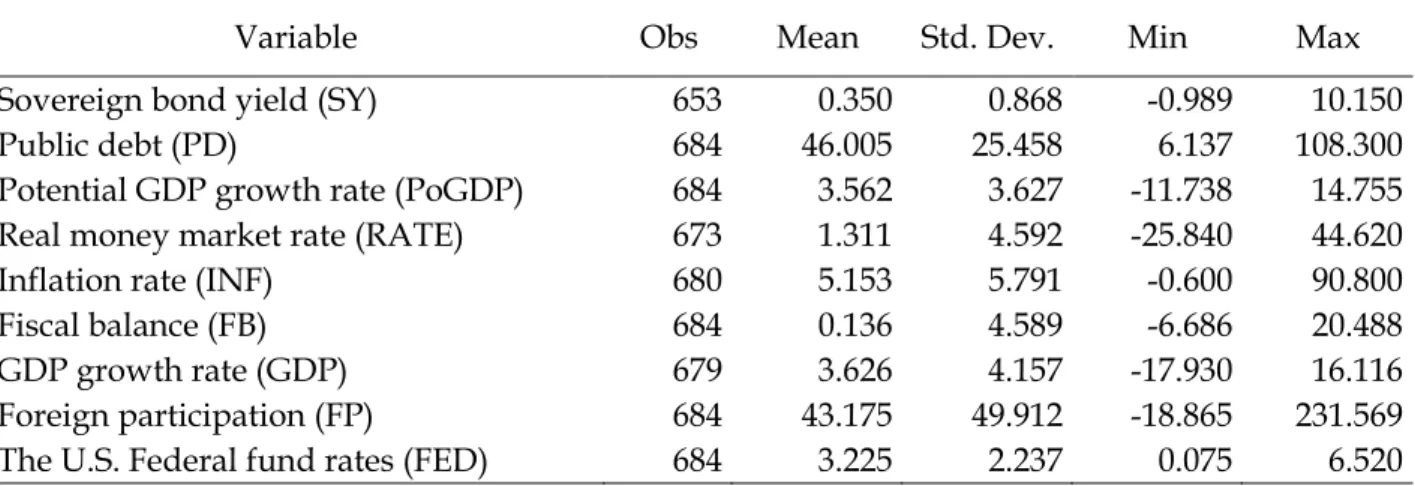
Our empirical analysis uses the sample consists of quarterly data on real sovereign bond yields and their fundamental determinants for the period 1994-2012 for nine emerging Asian countries. 10-year benchmark government bond yields available in Datastream will be used as a measure of sovereign borrowing costs Data on fundamental macroeconomic variables was obtained from the International Financial Statistics (IFS) and other international and national sources (see Appendix 1). Exceptionally, the data on potential economic growth rate is not available for the case of emerging and developing countries. We therefore use the average value of growth rates during ten previous periods as a potential growth rate. Appendix 1 and Table 1 provide the definition and source of all key variables, their units of
11 measurement, means, standard deviations (overall, between and within countries), and minimum and maximum values. Table 2 reports the correlation coefficients between all key variables which aid the modelling and help to confirm the choice of instruments. As shown in Table 1, almost correlation coefficients are significant that aids the modelling and help to confirm the choice of dependent variables. Besides, the magnitudes, the statistical significance even the sign of correlation coefficient have been more or less altered. Thus, we should not be surprised to see different empirical results on the impacts of macroeconomic variables on sovereign bond yields.
5.
Empirical findings
Table 3 reports the estimation results for different models: the baseline model (Model 1) and the models with the interaction terms between fiscal balance and dummy variables accounting for nonlinear impact of fiscal policy on bond yields. In general, we observe that the baseline model’s results are similar to those of other models, in which we control for countries’ different characteristics.
As reported in Table 3, the potential growth enters in all estimated regressions with a negative but insignificant coefficient. This result seems to be not consistent with the theoretical hypotheses discussed above. The negative sign of the potential economic growth coefficient does not support the hypothesis that faster growing economies pay higher borrowing costs. This negative sign should be explained by the fact that in a wealthy economy leads to a decrease in sovereign debt and then a decrease in sovereign borrowing costs. However, this long-run relationship is not statistically significant, implying that in emerging Asia, sovereign bond yields are not determined by potential economic growth.
Second, differing from earlier empirical works, we find evidence of a negative relationship between public debt and sovereign bond yields. This finding, once again, does not support the consideration of Manasse et al. (2003) that rising government debt may foster sovereign bond yields through the default risk premium. The negative but pretty small relationship between public debt and sovereign bond yields in emerging Asia may be explained in two ways. First, emerging Asia has experienced a number of supportive factors including strong underlying growth, conservative fiscal management, and financial repression that keep interest rates low even in a context of a rising sovereign debt. Second, comparing with advanced countries particularly debt-laden Europe, the balance sheets of most Asian economies remain strong (see Figure 3). External debt-to-GDP ratios have either declined significantly since 2009, as in the cases of Indonesia and the Philippines, or have stayed at
12 manageable levels. For this reason, in emerging Asia, the reaction of sovereign bond yields to public debt is so small: sovereign bond yields go down by about 0.5 basis points due to 100 points increase in public debt.
<Insert Figure 3>
Third, most of the short-run determinants enter in estimated regression with significant coefficients. The results suggest that bond yields increase significantly when the fiscal balance deteriorates: an increase in the fiscal deficit of 100 points pushes down bond yields by 5.8 basis points. Similarly, for each 100 points increase in inflation rate, real sovereign bond yields decrease about 3.2 basis points. Additionally, inflation has an additional effect on yields through its potential impact on volatility, which in turn could complicate the conduct of fiscal policy and lead to higher deficits (Baldacci and Kumar, 2010) that once again lessen the value of sovereign bond yields. In general, inflation expectation plays an important role, either direct or indirect, in explaining sovereign bond yields’ variation. Unlike the impact of inflation rate, that of short-run changes in Central Bank’s rate is not confirmed. This finding evidences the preliminary interventions of emerging Asian authorities in separating government debt management from monetary management. The separation of debt and monetary managements may bring a set of benefits for emerging Asia. First, this separation would offer the central bank a necessary independence in monetary management and an environment to pursue an inflation target, if assigned by the government. Second, this separation would also provide focus to the task of asset-liability management of government liabilities, undertake risk analysis and allow prioritizing government expenditure through higher awareness of interest costs.
Forth, economic growth is also significantly related to yields. In detail, higher growth leads to a compression in yields. This may be explained by the fact that higher growth results in higher tax revenues and smaller public social expenditures, which in turn reduce risk of fiscal slippage and fiscal vulnerability, and thus lower risk premium. Similarly, the relationship between foreign participation and bond yields is also negative. This finding seems to be consistent with some theoretical considerations meaning that foreign investors can be an important source of demand for local debt securities and thus allow lowering bond yields. In fact, foreign capital inflows enable emerging Asia to finance investment and foreign participation in local bond markets is seen as a way to accelerate the development of domestic financial infrastructure. Even though a growing demand of foreign investors for sovereign bonds lead to a decrease in bond yields, the emerging Asian authorities still tend to maintain an attractive level of sovereign bond yields in order to avoid the possible retire of
13 foreign investors especially in times of global financial instability. This issue is verified by such a small fall about 0.1 basis points in sovereign bond yield following 100 points increase in foreign participation.
Firth, relating to the impacts of global factors, on one hand, we find that the financial turmoil slightly drives sovereign bond yields up. On the other hand, the coefficient on the U.S. Federal funds rate is positive and significant. This result suggests that the U.S. monetary policy decisions at least partially reflect global risk aversion, which also influences sovereign bond markets in emerging Asia. Consequently, a short-run changes in the U.S. monetary policy results in a temporary rising trend in Asian real bond yields. Lastly, the empirical results find evidence that sovereign bond yields in emerging Asia do not depend on the initial level of macroeconomic characteristics such as fiscal condition, institutional quality, domestic savings and capital account openness.
We now turn our attention to the empirical results in the alternative models (Model 2-5) in which the fiscal balance is interacted with dummy variables accounting for several specific characteristics of each country (listed in the previous section). Overall, the empirical results are robust to controlling for the potential endogeneity of the fiscal balance due to the changes in some structural factors. As reported in Table 3, most of interactive terms between fiscal balance and macroeconomic characteristics enter in estimated model with an insignificant coefficient, except the case of Model 3, in which we control for the potential endogeneity of fiscal balance by using the initial level of public debt as an instrumental variable. Precisely, the interactive term between fiscal balance and initial debt level plays a negative and significant role in determining sovereign bond yields. This evidence reinforces the negative link between fiscal position and sovereign bond yields in emerging Asia. Overall, the empirical results allow us to conclude that the nature of short-run relationship between sovereign bond yields and fiscal balance does not depend on the initial level of macroeconomic fundamentals as suggested by Baldacci and Kumar (2010).
Sensitivity of empirical results
This sub-section carries out a set of robustness checks to examine the results’ sensitivity to alternative estimation strategies. The first robustness check involves using an alternative estimation method. We report in Table 4 the results of estimating the sovereign bond yields using the Fixed-effects FE estimator, in which country and time dummies are included. The empirical results are qualitatively very similar to those obtained using the Dynamic GMM estimator that are reported in Table 3. While the magnitude of estimated coefficients is
14 changed, most of coefficients have the same sign and are highly significant as those obtained with the GMM estimator.
We also estimated the same equation using Instrumental Variable (IV) estimator. In this step, instead of including in empirical model the interaction terms between fiscal balance and some specific characteristics of country, we estimate the model by directly instrumenting the fiscal balance with a set of structural macroeconomic variables. Moreover, the fundamental macroeconomic variables are now measured in percentage of GDP (not explained in dummy), including the initial level of: fiscal deficit, debt, institutional quality, domestic savings, and inward FDI. We use the average value over the 1990-1993 period as a proxy of the initial level of five variables listed above. The IV allows correcting the country-specific and time-specific effects and getting rid of any endogeneity in explanatory variables.
Above all, we test for the robustness of each IV estimated equation by performing four econometric tests, which results are reported in the lower part of Table 4. The first one is the under-identification test under the null hypothesis that the equation is under-identified. As reported in Table 4, the Kleibergen-Paap rk LM statistics are such important, meaning that the null hypothesis is rejected and the model is identified. Second, in the weak instrument test, the Kleibergen-Paap rk Wald F statistics, which are superior to the critical value of 5% maximal IV size proposed by Stock and Yogo (2002), also allow us to argue that weak instrument is not present in our models. Third, the Hansen J test checks the over-identification of all instruments. According to the empirical results, we cannot reject the null hypothesis of Hansen test, meaning that the instruments are valid instruments, notably uncorrelated with the error term, and that the excluded instruments are correctly excluded from the estimated equation. Lastly, the results of endogeneity test reported in the last line allow us to accept the null hypothesis that the specified endogenous regressors can actually be treated as exogenous.
We now look at the IV estimator’s main results reported in the last column of Table 4. The IV results are, by and large, similar to those of the GMM estimator in terms of sign and significance, but the magnitudes are different as would be expected. Therefore, we conclude that the qualitative nature of our results is robust to alternative estimation methods.
6.
Conclusion
The question about the fundamental factors, which can affect government borrowing costs, has been reviewed by a number of studies, either theoretical or empirical. However, this issue is less documented for emerging economies, especially for emerging Asian countries.
15 To fill this knowledge gap, this present paper attempts to shed light on the macroeconomic determinants of sovereign bond yields for a sample of nine emerging Asian countries over the period 1994-2012. Our empirical findings on the link between the long-run and short-run determinants and sovereign bond yields are, by and large, insensitive to a range of datasets and estimation methods.
We find that both country-specific fundamentals and global factors are important determinants of sovereign bond yields. Our empirical findings, however, provide only partial support to the concerned literature. In the long-run, we first reveal that the relationship between public debt and sovereign bond yields in emerging Asia is significant but weakly negative. This evidence is not consistent with the theoretical consideration suggesting that rising government debt may push up sovereign bond yields. Second, we fail to confirm the role of potential growth in explaining the changes in sovereign bond curve.
In the short-run, the empirical results suggest that emerging Asia’s sovereign bond yields negatively vary in function of the changes in economic growth rate, fiscal balance, inflation expectation, and foreign participation in the local bond markets. On the other hand, the variation of bond curve in emerging Asia depends on global factors, such as the U.S. monetary policy decision and global financial stability. This paper also finds out a rising independence between government debt management and the central bank’s monetary control.
To conclude, the present study is complementary to the existing literature that has seemed to only focus on the determinants of sovereign bond yields in advanced economies. Moreover, our results offer an important blessing for emerging Asia’s authorities aspiring to manage their sovereign bond curves by considering the changes in macroeconomics fundamentals such as public debt, economic growth, and fiscal balance and so on.
Acknowledgment: The author gratefully acknowledges financial support from the Chair Finance of the University of Nantes Research Foundation.
References
Ardagna, S., Caselli, F., and Lane, T., 2007. “Fiscal Discipline and the Cost of Public Debt Service: Some Estimates for OECD Countries”, The B.E. Journal of Macroeconomics, 7 1: pp. 1-33.
Arellano, M. and Bond, S.R., 1991. “Some Tests of Specification for Panel Data: Monte Carlo Evidence and an Application to Employment Equations”, Review of Economic Studies 58, pp. 277-297.
16 Baldacci, E., and Kumar, M., 2010. “Fiscal Deficits, Public Debt, and Sovereign Bond Yields”, IMF Working Paper 10/184 Washington: International Monetary Fund.
Bayoumi, T., Goldstein, M., and Woglom, G., 1995. “Do Credit Markets Discipline Sovereign Borrowers? Evidence from U.S. States”, Journal of Money, Credit and Banking, Vol. 24, No. 4.
Chinn, M., and Frankel, J., 2005. “The Euro Area and World Interest Rates”, Department of Economics, University of California, Santa Cruz Working Paper No. 1031.
Conway, P., and Orr, A., 2002. “The GIRM: A Global Interest Rate Model”, Westpac Institutional Bank Occasional Paper Wellington: Westpac Institutional Bank.
Csonto, B., and Ivaschenko, I., 2013. “Determinants of sovereign bond spreads in emerging markets: Local fundamentals and Global factors vs. Ever-changing misalignments”, IFM Working Paper, WP/13/164.
Engen, E., and Hubbard, G., 2004. “Federal Government Debt and Interest Rates”, NBER Working Paper No. 1068 Cambridge, Massachusetts: National Bureau of Economic Research.
Evans, P., 1987. “Interest Rates and Expected Future Budget Deficits in the U.S.”, Journal of
Political Economy, 951: pp. 34-58.
Faini, R., 2006. “Fiscal Policy and Interest Rates in Europe”, Economic Policy, pp. 443–89. Haugh, D., Ollivaud, P. and Turner, D., 2009. “What Drives Sovereign Risk Premiums? An Analysis of Recent Evidence from the Euro Area”, OECD Economics Department Working Paper No. 718.
Im, K., Pesaran, M.H. and Shin, Y., 1997. “Testing for unit roots in heterogeneous panels”
Journal of Econometrics, 1151, 53-74.
International Monetary Fund, 2005. “Development of Corporate Bond Markets in emerging countries” in the Global Financial Stability Report, September, 2005.
Kinoshita, N., 2006. “Government Debt and Long-Term Interest Rate” IMF Working Paper 06/63 Washington: International Monetary Fund.
Laubach, T., 2009. “New Evidence on the Interest Rate Effects of Budget Deficits and Debt”, Journal of European Economic Association, 7: pp. 858–85.
Levine, A., Lin, C.F. and Chu, C.S., 2002. “Unit root tests in panel data: asymptotic and finitesample properties”, Journal of Econometrics 108, 1-24.
Manasse, P., Roubini, N., and Schimmelpfennig, A., 2003. “Predicting Sovereign Debt Crises”, IMF Working Paper, WP/03/221.
Nickell, S. 1981. “Biases in dynamic models with fixed effects”, Econometrica 49, pp.1417-1426.
Pedroni, P., 1999. “Critical Values for Cointegration Tests in Heterogeneous Panels with Multiple Regressors”, Oxford Bulletin of Economics and Statistics 61, 653–678.
Plosser, C., 1987. “Fiscal Policy and the Term Structure”, Journal of Monetary Economics, Vol. 20 2: pp. 343-67.
Poghosyan, T., 2012. “Long-run and Short-run determinants of Sovereign Bond Yields in Advanced Economies”, IMF Working Paper, WP/12/271.
Prasad, E.S., and Rajan, R.G., 2008. "A Pragmatic Approach to Capital Account iberalization", Journal of Economic Perspectives, American Economic Association, Vol. 223, pp. 149-72.
Stock, J. H. and Yogo, M., 2002. “Testing for weak instruments in linear IV regression”, NBER Technical Working Paper No. 284. Cambridge, MA: NBER.
17 Woodford, M., 2003. “Interest and Prices: Foundations of a Theory of Monetary Policy”, Princeton, NJ: Princeton University Press.
Appendix 1: Description of Variables
Variable Description Source
Dependent variable
Real long-term interest rate on government bonds (in percent)
Nominal 10 year benchmark bond yield minus inflation divided over one plus inflation (Fisher's formula)
Datastream
Long-run determinants
Government debt Ratio of general government debt to GDP
WEO; Trading Economics
Potential growth Real GDP growth filtered of
cyclical fluctuations
Author’s calculations from Datastream
Short-run determinants
Real money market rate Nominal Central Bank’s rate minus inflation divided over one plus inflation (Fisher’s formula)
Datastream, Trading Econimics
Inflation rate CPI inflation Oxford Economics
Fiscal balance ratio Ratio of general government primary balance to GDP
WEO
Economic growth rate Real GDP growth Oxford Economics
Foreign participation stock of foreign holdings of local currency bonds
Oxford Economics
The U.S. Federal funds rate
The U.S. Federal funds rate Datastream
Dummy variables
Large Initial Fiscal Deficit Fiscal deficit above 2 percent of GDP in the previous year
WDI, IFS
High Initial Debt General government debt above 60 percent of GDP in the previous year
WDI, IFS
Quality of Institutions Regulatory quality index above sample average
Worldwide Governance Indicators, WDI
High FDI Annual FDI higher than 10 percent
of GDP
18 Figure 1 : 10 – year sovereign bond yields in emerging Asia
Source: Author’s creation from Datastream and Trading Economics
Figure 2: Central Bank’s interest rate
Source: Author’s creation from Datastream, Trading Economics and IFS database
0 2 4 6 8 10 12 14 16 18 20 1 9 9 4 Q 1 1 9 9 4 Q 4 1 9 9 5 Q 3 1 9 9 6 Q 2 1 9 9 7 Q 1 1 9 9 7 Q 4 1 9 9 8 Q 3 1 9 9 9 Q 2 2 0 0 0 Q 1 2 0 0 0 Q 4 2 0 0 1 Q 3 2 0 0 2 Q 2 2 0 0 3 Q 1 2 0 0 3 Q 4 2 0 0 4 Q 3 2 0 0 5 Q 2 2 0 0 6 Q 1 2 0 0 6 Q 4 2 0 0 7 Q 3 2 0 0 8 Q 2 2 0 0 9 Q 1 2 0 0 9 Q 4 2 0 1 0 Q 3 2 0 1 1 Q 2 2 0 1 2 Q 1 2 0 1 2 Q 4 2 0 1 3 Q 3
China Hong Kong India Indonesia Korea
Malaysia Philippines Singapore Thailand
0.00 10.00 20.00 30.00 40.00 50.00 60.00 70.00 80.00 1 9 9 4 Q 1 1 9 9 4 Q 4 1 9 9 5 Q 3 1 9 9 6 Q 2 1 9 9 7 Q 1 1 9 9 7 Q 4 1 9 9 8 Q 3 1 9 9 9 Q 2 2 0 0 0 Q 1 2 0 0 0 Q 4 2 0 0 1 Q 3 2 0 0 2 Q 2 2 0 0 3 Q 1 2 0 0 3 Q 4 2 0 0 4 Q 3 2 0 0 5 Q 2 2 0 0 6 Q 1 2 0 0 6 Q 4 2 0 0 7 Q 3 2 0 0 8 Q 2 2 0 0 9 Q 1 2 0 0 9 Q 4 2 0 1 0 Q 3 2 0 1 1 Q 2 2 0 1 2 Q 1 2 0 1 2 Q 4 2 0 1 3 Q 3
China Hong Kong India Indonesia Korea
19 Figure 3: External debt-to-GDP ratios in emerging Asia
Source: Author’s creation from WDI source
0.00 20.00 40.00 60.00 80.00 100.00 120.00 140.00
20 Table 1: Descriptive Statistics
Variable Obs Mean Std. Dev. Min Max
Sovereign bond yield (SY) 653 0.350 0.868 -0.989 10.150
Public debt (PD) 684 46.005 25.458 6.137 108.300
Potential GDP growth rate (PoGDP) 684 3.562 3.627 -11.738 14.755
Real money market rate (RATE) 673 1.311 4.592 -25.840 44.620
Inflation rate (INF) 680 5.153 5.791 -0.600 90.800
Fiscal balance (FB) 684 0.136 4.589 -6.686 20.488
GDP growth rate (GDP) 679 3.626 4.157 -17.930 16.116
Foreign participation (FP) 684 43.175 49.912 -18.865 231.569
The U.S. Federal fund rates (FED) 684 3.225 2.237 0.075 6.520
Table 2: Bivariate Correlation coefficients
SY PD PoGDP RATE INF FB GDP FP FED
SY 1.00 PD -0.075* 1.00 PoGDP -0.060 0.025 1.00 Money Rate 0.070* -0.064* 0.229* 1.00 INF -0.365* 0.018 0.029 -0.179* 1.00 FB -0.228* 0.185* -0.137* -0.027 -0.113* 1.00 GDP -0.026 0.059 0.706* 0.149* -0.153* -0.147* 1.00 FP 0.004 0.058 -0.366* -0.287* -0.206* 0.305* -0.331* 1.00 FED 0.015 -0.118* 0.040 0.361* 0.148* 0.218* 0.014 -0.216* 1.00
21 Table 3: GMM estimator’s results
Independent variables Model 1 Model 21 Model 31 Model 41 Model 51
Sovereign bond yield 0.597***
(0.104) 0.611*** (0.103) 0.609*** (0.102) 0.610*** (0.103) 0.611*** (0.102) Public debt -0.005** (0.002) -0.004** (0.002) -0.005** (0.002) -0.004** (0.002) -0.004** (0.002)
Potential GDP growth rate -0.011
(0.013) -0.018 (0.016) -0.017 (0.018) -0.015 (0.014) -0.017 (0.017)
Real money market rate -0.002
(0.007) -0.005 (0.007) -0.006 (0.006) -0.005 (0.007) -0.005 (0.007) Inflation rate -0.032** (0.015) -0.033** (0.015) -0.034** (0.015) -0.033** (0.015) -0.033** (0.015) Fiscal balance -0.058*** (0.009) -0.057*** (0.009) -0.046*** (0.011) -0.067** (0.029) -0.055*** (0.016) GDP growth rate -0.026*** (0.009) -0.030*** (0.009) -0.031*** (0.009) -0.029*** (0.010) -0.030*** (0.009) Foreign participation -0.001** (0.000) -0.002*** (0.001) -0.002*** (0.001) -0.002*** (0.001) -0.002*** (0.001) The U.S. Federal fund rates 0.034**
(0.011) 0.029** (0.012) 0.029** (0.013) 0.030** (0.013) 0.029** (0.012) Financial crisis 0.124* (0.073) 0.121* (0.068) 0.124* (0.066) 0.124* (0.067) 0.122* (0.068) Dummy variable
High initial fiscal deficit 0.005
(0.081)
0.004 (0.025)
High initial debt 0.061
(0.096) -0.020* (0.011) Quality of institutions -0.233 (0.187) 0.011 (0.024) High FDI -0.061 (0.067) -0.002 (0.011) Constant 0.717*** (0.188) 0.638*** (0.158) 0.675*** (0.200) 0.604*** (0.154) 0.632*** (0.168) Number of observations 623 623 623 623 623
Serial Corr. (m1) P-value 0.1284 0.1305 0.1317 0.1317 0.1310
Serial Corr. (m2) P-value 0.4443 0.4397 0.4408 0.4428 0.4402
Values in parentheses are robust standard errors. *** (**; *): Significant at 1%, 5% and 10% level respectively.
22 Table 4: Results of FE and IV estimators
Independent variables FE estimator IV estimator
Model 1 Model 21 Model 31 Model 41 Model 51
Sovereign bond yield 0.612*** (0.112) 0.624*** (0.111) 0.625*** (0.108) 0,620*** (0,110) 0,624*** (0,108) 0,683*** (0,135) Public debt -0.006** (0.002) -0.005** (0.002) -0.005** (0.002) -0,005** (0,002) -0,005** (0,002) -0,005*** (0,001) Potential GDP growth rate -0.007 (0.009) -0.012 (0.011) -0.013 (0.013) -0,010 (0,010) -0,011 (0,012) 0,005 (0,007) Real money market rate -0.002
(0.007) -0.004 (0.007) -0.005 (0.006) -0,004 (0,007) -0,004 (0,007) -0,003 (0,005) Inflation rate -0.031* (0.015) -0.031* (0.015) -0.032** (0.015) -0,031** (0,015) -0,031** (0,015) -0,026*** (0,009) Fiscal balance -0.051*** (0.010) -0.048*** (0.009) -0.045*** (0.012) -0,078** (0,037) -0,055** (0,018) -0,015*** (0,006) GDP growth rate -0.024** (0.010) -0.028** (0.010) -0.028** (0.011) -0,026** (0,010) -0,027** (0,010) -0,018*** (0,006) Foreign participation -0.001** (0.000) -0.002** (0.001) -0.002** (0.001) -0,001** (0,001) -0,002** (0,001) -0,001** (0,000) The U.S. Federal fund
rates 0.034*** (0.010) 0.030** (0.011) 0.030** (0.011) 0,032** (0,013) 0,030** (0,011) 0,022** (0,010) Financial crisis 0.169** (0.080) 0.146** (0.074) 0.144** (0.070) 0,147µµ (0,072) 0,145** (0,072) 0,123** (0,052) Dummy variables
High initial fiscal deficit 0.017 (0.087)
-0.007 (0.027)
High initial debt 0.101**
(0.047) -0.009 (0.008) Quality of institutions -0.201 (0.121) 0,029 (0,028) High FDI -0.047 (0.066) 0,007 (0,012) Constant 0.679*** (0.207) 0.578*** (0.176) 0.614*** (0.202) 0,542*** (0,173) 0,580*** (0,185) 0,186** (0,081) Number of observations 638 638 638 638 638 638 Underidentification test (Kleibergen-Paap rk LM statistic) 186.746 [0.000] Weak identification test
(Kleibergen-Paap rk Wald F statistic)
(148.342)a
Overidentification test of instruments (Hansen J statistic)
3.920 [0.4169]
Endogeneity test 2.671
[0.1022]
Values in parentheses are robust standard errors. Values in brackets are P-values. *** (**; *): Significant at 1%, 5% and 10% level respectively. 1: Model with the interaction of fiscal balance with dummy variables for countries'
characteristics in bold. Values in parentheses are robust standard errors. ()a, Critical value of 5 percent maximal IV size proposed by Stock and Yogo (2002).
Les Cahiers de la Chaire Finance rassemblent les documents de travail du LEMNA s'inscrivant dans des projets de recherche qu'elle soutient.
N° 2012-06
Are Islamic Indexes more Volatile than Conventional Indexes?
Evidence from Dow Jones Indexes
CHARLES Amélie, DARNÉ Olivier et POP Adrian
N° 2012-07
Large Shocks in the Volatility of the Dow Jones Industrial Average
Index: 1928-2010
CHARLES Amélie et DARNÉ Olivier
N° 2012-08
The Quality of Private Monitoring in European Banking: Completing
the Picture
POP Adrian et POP Diana
N° 2012-09
Effets socioéconomiques de la crise financière : implications pour le
Vietnam
LAUZANAS Jean-Marc, PERRAUDEAU Yves et POP Adrian
N° 2012-31
Efficiency Gains from Narrowing Banks: A Search-Theoretic Approach
TRIPIER Fabien
N° 2012-32
Volatility Persistence in Crude Oil Markets
CHARLES Amélie et DARNÉ Olivier
N° 2012-40
La modélisation en équilibre général et stochastique des cycles
économiques en Afrique Sub-saharienne : une revue de la littérature
NOUASSI Claude Francis et TRIPIER Fabien
Les opinions exposées dans ce document n’engagent que les auteurs. Ceux-ci assument la responsabilité de toute erreur ou omission.
La Chaire Finance est une initiative de la Banque Populaire Atlantique, la Caisse d’Epargne Bretagne-Pays de Loire, la Caisse des Dépôts, du Crédit Maritime et de l’Université de Nantes, sous l’égide de la Fondation de Projets de l’Université de Nantes.
Site web : http://www.univ-nantes.fr/fondation/chairefinance
Contact
Chaire Finance, Banque Populaire – Caisse d’Epargne IEMN-IAE, Chemin de Censive du Tertre – BP 52231
44322 Nantes cedex 3 Tél : +33 (0)2 40 14 16 60 Fax : +33 (0)2 40 14 16 50 Email : [email protected]