HAL Id: hal-00623794
https://hal.archives-ouvertes.fr/hal-00623794
Submitted on 15 Sep 2011HAL is a multi-disciplinary open access
archive for the deposit and dissemination of sci-entific research documents, whether they are pub-lished or not. The documents may come from teaching and research institutions in France or abroad, or from public or private research centers.
L’archive ouverte pluridisciplinaire HAL, est destinée au dépôt et à la diffusion de documents scientifiques de niveau recherche, publiés ou non, émanant des établissements d’enseignement et de recherche français ou étrangers, des laboratoires publics ou privés.
Improved scintillation time response in
(Lu0.5Gd0.5)2O3:Eu3+ compared with Lu2O3:Eu3+
transparent ceramics
Hélène Rétot, Samuel Blahuta, Aurélie Bessière, Bruno Viana, Brian
Lacourse, Eric Mattmann
To cite this version:
Hélène Rétot, Samuel Blahuta, Aurélie Bessière, Bruno Viana, Brian Lacourse, et al.. Improved scin-tillation time response in (Lu0.5Gd0.5)2O3:Eu3+ compared with Lu2O3:Eu3+ transparent ceramics. Journal of Physics D: Applied Physics, IOP Publishing, 2011, 44 (23), pp.235101. �10.1088/0022-3727/44/23/235101�. �hal-00623794�
Improved scintillation time response in
1(Lu
0.5
Gd
0.5
)
2
O
3
: Eu
3+
compared to Lu
2
O
3
:
2Eu
3+
transparent ceramics
3 4 5 6Hélène Rétot1,2, Samuel Blahuta1,2, Aurélie Bessière1*, Bruno Viana1 7
Brian LaCourse2, Eric Mattmann2 8
9 10 11
1
Laboratoire de Chimie de la Matière Condensée de Paris, UMR - CNRS 7574, Chimie-12
Paristech, 11 rue Pierre et Marie Curie, 75231 Paris Cedex 05, France. 13
14
2
Saint-Gobain Cristaux et Détecteurs, 104 Route de Larchant, 15
77140 St Pierre les Nemours, France 16
17
* tel number : +33 1 53 73 79 43 / fax number : +33 1 46 34 74 89 / e-mail :
aurelie-18 bessiere@chimie-paristech.fr 19 20 21 22 23
Abstract
1 2
The scintillation properties of two sesquioxides ceramics Lu2O3:Eu3+ and
3
(Lu0.5Gd0.5)2O3:Eu3+ were studied. Both ceramics present comparable transparency
4
and light yield whereas (Lu0.5Gd0.5)2O3:Eu3+ showed an order of magnitude reduced
5
afterglow in the 3-300 ms range. A thorough study of the location and behavior of 6
Eu3+dopant ions at C2and S6sites of Lu2O3and (Lu0.5Gd0.5)2O3structures was carried
7
out with low temperature selective excitation of Eu3+. This revealed that (i) at both C2
8
and S6sites, Eu3+4f-4f lifetime is shorter in (Lu0.5Gd0.5)2O3:Eu3+ than in Lu2O3:Eu3+
9
(ii) the host matrix (Lu0.5Gd0.5)2O3 as compared to Lu2O3 favors the location of Eu3+
10
at C2 site. As decay times of Eu3+ in C2 and S6 sites are 1.0 ms and 3.8 ms
11
respectively, the preferred occupation of C2 in (Lu0.5Gd0.5)2O3:Eu3+ implies a much
12
shorter decay time for (Lu0.5Gd0.5)2O3:Eu3+ in the 3-20 ms range. Reduction of
13
afterglow in the 20-300 ms range is illustrated by thermally stimulated luminescence 14
peaks presenting a highly reduced intensity for (Lu0.5Gd0.5)2O3:Eu3+ compared to
15
Lu2O3:Eu3+ implying reduced charge trapping defects in (Lu0.5Gd0.5)2O3:Eu3+
16
ceramics. 17
18
Keywords: ceramics, scintillation, Computed Tomography, luminescence, 19
sesquioxide 20
21 22
Introduction
1 2
A scintillator is a material able to detect ionizing radiation (X, , , -rays, 3
neutrons...) and convert them into visible light. In order to obtain performant
4
scintillators the high energy electron-hole pairs produced after ionisation should be
5
efficiently transferred to the luminescent center. This last stage is very
material-6
dependent. One of the most important application fields of scintillation is medical 7
imaging. Today the main scintillating materials for medical imaging are 8
Gd2O2S:Pr,Ce,F [1], (Y,Gd)O3:Eu,Pr [2] and CdWO4 [3,4] for X-ray Computed
9
Tomography (CT) whereas BGO (Bi4Ge3O12) [5,6], NaI:Tl [7], LYSO
10
((Lu,Y)SiO5:Ce3+) [8,9] and LPS (Lu2Si2O7) [10,11,12] are often used for Positron
11
Emission Tomography (PET).BGO [13], LYSO [14] and CsI:Tl [13] have also been
12
shown useful for megavoltage X-Ray imaging (portal imaging and cone-beam CT).In 13
the aim of decreasing the radiation dose received by the patient during a scan, 14
scintillators with enhanced efficiency are being investigated. In the first stage of 15
detection, the ionizing radiation must be stopped by the scintillator within the shortest 16
range of the material in order to produce sharp images. High density and high 17
effective atomic number are required for the host material. In that respect lutetium 18
sesquioxide Lu2O3 constitutes one of the best possible hosts with a density of 9.43
19
g/cm3 and an effective atomic number Zeff of 69. With its cubic structure it can be
20
synthesized as a transparent ceramics which is very advantageous to produce 21
scintillators at a lower cost. However obtaining a nanosecond fast response in Lu2O3
22
from 5d-4f emissions of dopants such as Ce3+, Pr3+or Tb3+was found impossible due 23
to the location of the 5d levels of Ln3+ (Ln = Ce, Pr, Tb) inside the conduction band 24
[15]. Nevertheless Eu3+ 4f-4f luminescence is observed in Lu2O3:Eu3+. It presents a
typical red luminescence that matches very well the sensitivity spectrum of 1
photodiode detectors and its decay time is in the order of millisecond in most hosts
2
[16]. Lempicki et al. in 2002 were the first to claim the use of Lu2O3:Eu3+ceramics as
3
a scintillator [17]. While a typical 1-2 ms response time is considered as totally 4
acceptable for scintillators in X-rays CT application, longer afterglow should be 5
suppressed so that CT images do not get blurred by delayed signals. Unfortunately 6
afterglow is often a limiting parameter in sesquioxide hosts. An afterglow of some 7
hundreds of milliseconds has been reported by several authors in Lu2O3:Eu3+
8
[18,19,20] as well as in Lu2O3:Tb3+ [21]. The afterglow in sesquioxides could
9
originate from Frenkel defects as the structure allows easy displacement of oxygen 10
atoms. However no experimental proof has been brought up till now. Alternatively 11
co-doping was reported as a way to reduce afterglow in some cases. Pr3+ [22] or Ti4+ 12
[23] co-doping in (Y,Gd)2O3:Eu3+ for instance were found to reduce persistent
13
luminescence of Eu3+. On the contrary Ca2+ addition in Lu2O3: Tb3+ [21] enhanced
14
long-lasting luminescence in the material. 15
In this work an alternate way to improve time response in Eu3+-doped 16
sesquioxides is reported. By heavily substituting the lutetium host cation with 17
gadolinium in Lu2O3 up to the composition (Lu0.5Gd0.5)2O3, the luminescence time
18
characteristics of the Eu3+-doped scintillating ceramics are very much improved while 19
the density of this latter compound (about 8.4 g/cm3) is still very favorable. Inthefirst 20
part of the paper the scintillation properties including afterglow measurements of 21
Lu2O3:Eu3+and (Lu0.5Gd0.5)2O3:Eu3+ceramics are investigated. Inthesecond part, the
22
selective excitation of Eu3+ in the two cationic sites of the structure unravels reasons 23
for different luminescence decay behaviors and the time reponse improvement of 24
(Lu0.5Gd0.5)2O3:Eu3+ceramics is discussed.
1
Experimental Section
2 3
The Lu2O3:Eu3+ and (Lu0.5Gd0.5)2O3:Eu3+ ceramics were elaborated by
Saint-4
Gobain Crystals. The startingpowders were synthesized by an inverse coprecipitation 5
method. A solution pH = 10 of ammonia and oxalic acid was prepared. For the 6
synthesis of Lu2O3:Eu3+, lutetium and europium nitrates were dissolved in ionized
7
water and then added dropwise to the ammonia/oxalic acid solution while stirring. A 8
white precipitate of Lu2(C2O4)3:Eu3+ was formed [17]. The precipitate was washed
9
first with water and then with ethanol before being dried for one hour at 100°C. The 10
powder was then fired at about 800°C.For (Lu0.5Gd0.5)2O3:Eu3+lutetium, gadolinium
11
and europium nitrates were used. The powders structure was checked by X-ray 12
diffraction and showed pure bixbyite structure with space group Ia-3 (206). Initial 13
Europium concentration was 6 at% and 7 at% (via Eu2O3) for Lu2O3 and 14
(Lu0.5Gd0.5)2O3ceramics, respectivelyas this concentration range was found optimum 15
with respect to the light yield of the ceramics [24]. After grinding, pellets were 16
prepared by pressing powders under isostatic conditions at room temperature and then 17
at high temperature. Finally the ceramics were pressed under isostatic conditions at 18
high temperature, before being annealed at 1000°C in air. Both ceramics are 1 cm-19
diameter large and 1 mm-thick. A Gd2O2S:Pr (GOS:Pr) ceramics of10 mm- diameter
20
and 1 mm-thickness also studied in our laboratory [25] is used as an element of 21
comparison. 22
Total transmission was measured using a UV-VIS Cary 6000i double beam 23
spectrophotometer. Ceramics samples were placed at the entrance of an integrating 24
sphere. They were excited on their entire surface from the front and light transmitted 25
and emitted in all directions behind the ceramics was collected by the integrating 1
sphere. 2
For radioluminescence measurements the ceramics were excited by X-rays 3
produced by a molybdenum tube operated at 50 KV and 20 mA impinging on the 4
samples surface with a 45° angle. Light was collected at 45° angle from the surface 5
via an optical fibre by a Princeton Charge Coupled Device (CCD) camera cooled at -6
65°C coupled with an Acton SpectraPro monochromator. 7
In thermally stimulated luminescence (TSL) experiments the ceramics were silver 8
glued on a copper sample holder attached to the cold head of a helium closed cycle 9
cryostat. They were first excited for 10 minutes through a beryllium window of the 10
cryostat by a molybdenum X-ray source operated at 50 KV and 20 mA. A Lakeshore 11
temperature controller was then used to apply a 20 K/min heating rate between 10 K 12
and 650 K. Luminescence was collected through a quartz window of the cryostat by 13
the same detection device as the one used in radioluminescence (optical fibre / 14
monochromator / CCD camera). 15
Afterglow was measured after X-ray excitationprovided by a tungsten X-Ray tube
16
operated at 120 kV and 13.3 mA on ceramics placed on a photodiode. Afterglow 17
measurement was carried out with a 1 ms integration time and up to 300 ms. 18
Laser-excited low temperature luminescence measurements were carried out on 19
ceramics silver glued on a copper sample holder mounted on the cold head of a closed 20
cycle cryogenic refrigerator. The cold head was cooled to 10 K. Fluorescence and 21
decay spectra were recorded using as excitation source an optical parametric oscillator 22
laser (10 Hz, 8 ns) pumped by the third harmonic of a YAG:Nd laser. A 23
Roper/Princeton Intensified Charged Couple Device (ICCD) detector was used to 24
detect the fluorescence with a time delay up to 20 ms. 25
1
Results
2 3
1. Scintillation properties of Lu2O3:Eu3+and (Lu0.5Gd0.5)2O3:Eu3+ceramics 4
5
In-line transmission of Lu2O3:Eu3+ and (Lu0.5Gd0.5)2O3:Eu3+ ceramics were
6
measured at the main emission wavelength of Eu3+, i.e. 612 nm, as 46 % and 38 %,
7
respectively. Though these values do not appear very high, the ceramics looked 8
transparent. Light was actually very much scattered as samples had not been polished 9
or coated with any anti-reflection layer. As the refractive index of the material is 10
rather high (1.93 and 1.95 at 612 nm for Lu2O3 and (Lu0.5Gd0.5)2O3 respectively) a
11
surface treatment is required to avoidlightlosses. In order to test the ability of the as-12
prepared ceramics to serve as efficient scintillator pixels used for instance in X-ray 13
CT, their total transmission spectrum was measured and is presented in Figure 1. Let 14
us remind that total transmission was measured with an integrating sphere able to 15
collect both transmitted and scattered light at the back of the ceramics. Therefore total 16
transmission corresponds to light potentially used by a photodetector placed at the 17
back of a scintillating element made of the 1 mm-thick ceramics. Figure 1 shows that 18
Lu2O3:Eu3+ and (Lu0.5Gd0.5)2O3:Eu3+ ceramics present a total transmission of 81 %
19
and 83 %, respectively at the main emission wavelength of Eu3+(612 nm), indicating 20
that the emitted photons should be efficiently extracted from the materials. Both 1 21
mm-thick ceramics, prepared here by the same procedure, show a similar and 22
satisfying optical quality in terms of total light transmission. 23
Note that the transmission spectra of Figure 1 show expected intra-configurational 24
4f-4f transition lines of Eu3+. The band gaps of Lu2O3 and (Lu0.5Gd0.5)2O3 precursor
powders were measured in a previous work as 5.6 eV and 5.4 eV, respectively [24]. 1
These values correspond to the absorption edge observed at the short-wavelength side 2
of the spectra around 220 nm. The spectra also display two absorption bands 3
identified as low transmission dips at 245 nm / 282 nm and at 245 nm / 293 nm for 4
Lu2O3:Eu3+and (Lu0.5Gd0.5)2O3:Eu3+, respectively. However this part of the spectrum
5
is modified by the fact that emitted light is not filtered out in this measurement. In that 6
way, the total transmission spectrum at wavelengths where high absorption also 7
reflects some features of an excitation spectrum of Eu3+ luminescence. Thus efficient 8
absorption bands for Eu3+luminescence may appear as high transmission values since 9
they imply intense luminescence of Eu3+ at 612 nm. Hence the spectrum in that range 10
can alternatively be read as two excitation bands at maxima of the transmission curve, 11
i.e. at 233 nm / 258 nm and 235 nm / 268 nm for Lu2O3:Eu3+ and
12
(Lu0.5Gd0.5)2O3:Eu3+, respectively. These values are comparable to what was
13
measured by Chen et al. on Lu2O3:Eu3+ceramics at 245 nm and 266 nm and attributed
14
to charge transfer (CT) absorption bands of Eu3+ [26]. Zych et al. also observed a 15
double band at 245 nm and 270 nm for a Lu2O3 :Eu3+ceramics which they attributed
16
to Eu3+CT bands in the two sites of Lu2O3[27].
17
The X-ray excited radioluminescence spectra of Lu2O3:6%Eu3+ and
18
(Lu0.5Gd0.5)2O3:7%Eu3+ are shown in Figure 2 along with the radioluminescence
19
spectrum of a standard Gd2O2S:Pr3+ non-transparent ceramics. The sesquioxides
20
spectra are composed of expected 4f-4f emission lines for Eu3+. The main line 21
corresponds to the 5D0 7F2 transition of Eu3+ at 612 nm and gives a bright red
22
luminescence that perfectly matches silicon photodetectors sensitivity [17]. The other 23
5
DJ 7FJ emission lines are identified on the figure and are very similar for both
24
compounds. The integrated intensities for both Lu2O3:Eu3+ and (Lu0.5Gd0.5)2O3:Eu3+
ceramics are in the range of the intensity for the GOS:Pr ceramics and are similar the 1
one to each other. However no absolute light yield value was here inferred from this 2
comparison as the transparency of the standard and the sesquioxides is different. 3
Pulse-height measurement, which was not available in our laboratory, or comparison 4
with an absolute reference should be carried out in order to measure an absolute light 5
output value. Note that the most recent work indicates a light yield as high as 70 000 6
photons/MeV obtained with a (Lu0.5Gd0.5)2O3: 10% Eu3+ceramics [28].
7
Figure 3 shows afterglow measurements of the two ceramics in part per million of 8
the initial light output. At 300 ms (Lu0.5Gd0.5)2O3:Eu3+ceramics presents an afterglow
9
about one order of magnitude lower than Lu2O3:Eu3+. Two parts can be distinguished
10
in the decays. Within the first milliseconds (up to 20 ms) the ceramics present a time 11
response in the order of the decay time of Eu3+ excited states. Pseudo decay times 12
calculated over the two ( 1) and three ( 2) first points are reported in Table 1 as an
13
element of comparison. They are reported here as “short afterglow”. Both 1and 2are
14
shorter for (Lu0.5Gd0.5)2O3:Eu3+ than for Lu2O3:Eu3+. A second part of the afterglow
15
curve can be distinguished between 50 ms and 300 ms. This part of the curves allows 16
us to evaluate the “long afterglow” decay times 3 reported in Table 1. The long
17
afterglow decay time is again found shorter for (Lu0.5Gd0.5)2O3:Eu3+ than for
18
Lu2O3:Eu3+.
19
TSL glow curves of both ceramics between 10 K and 535 K are shown in Figure 20
4. The glow curve of Lu2O3:Eu3+ ceramics presents a main peak at 195 K and two
21
peaks of lower intensity at 54 K and 110 K. The inset of Figure 4 zooms into the 22
250 K-450 K region. In that region three peaks of much lower intensity can be 23
distinguished at 297 K, 338 K and 375 K. At this point it is difficult to relate with 24
certainty any specific TSL peak to the afterglow observed above. Though of low 25
intensity, the peaks of the 250 K-450 K region might contribute to the afterglow. 1
However the afterglow at some hundred of ms in Lu2O3:Eu3+ may most probably be
2
related to the main TSL peak at 195 K. This hypothesis is supported by a study of 3
Kostler et al. on (Y,Gd)2O3:Eu3+[22] in which the TSL curve of (Y,Gd)2O3:Eu3+was
4
found very similar in shape above 150 K to the one presented here for Lu2O3:Eu3+
5
with a main peak at 180 K similar to our 195 K peak. By comparing the TSL curve 6
with the afterglow at 100 ms at various temperatures, they showed that the afterglow 7
at 100 ms was unambiguously related to the TSL peak at 180 K. 8
In Figure 4 the TSL glow curve of (Lu0.5Gd0.5)2O3:Eu3+ presents very similar
9
peaks position to Lu2O3:Eu3+. The main peak is slightly widened in
10
(Lu0.5Gd0.5)2O3:Eu3+ and its maximum is shifted from 195 K in Lu2O3:Eu3+to 205 K.
11
In the 250 K-450 K range, the same low intensity peaks as for Lu2O3:Eu3+ might be
12
present too though the sensitivity is too low to detect the two last peaks at 338 K and
13
375 K. Defects responsible for charge trapping in both compounds are therefore 14
probably of same nature. However all peaks of (Lu0.5Gd0.5)2O3:Eu3+ show a strongly
15
reduced intensity compared to those of Lu2O3:Eu3+.
16 17
2. Site selective excitation of Eu3+
18 19
A representation of the bixbyite structure of cubic lutetium sesquioxide is shown 20
in Figure 5. It is comparable to fluorine CaF2 with ¼ anionic vacancy. The oxygen
21
ions constitute a face centered cubic network with oxygen vacancies located on [1 1 22
1] directions. Two different cationic sites with symmetry C2and S6exist in a ratio 3:1.
23
C2sites are located at the center of the cubes that present two anionic vacancies on a
24
diagonal of a face of the cube. The cations at C2occupy 24d Wickoff positions at (u 0
¼). Two oxygen ions are at a medium distance of the C2cation (similar to the
cation-1
oxygen distances in S6 sites), two are at a shorter distance and two at a longer
2
distance. The C2cationic site is non centro-symmetric. S6sites (or C3i) are located at
3
the center of the cubes that present two anionic vacancies situated on the central 4
diagonal of the cube. The cations occupy 8b Wickoff positions at (¼ ¼ ¼ ). The six 5
oxygen ions are at equal distance from the central cation. The C2 cationic site is
6
centro-symmetric. The centro-symmetry character of the site determines the 7
luminescence spectrum of Eu3+. 8
Up to now contradictory results were published about a possible preferential 9
occupation of Eu3+ in one of the two cationic sites of the Lu2O3 structure. Concas et
10
al. [29] showed that Eu3+ occupy mainly C2 sites in 10%-doped materials whereas a
11
theoretical work from Stanek et al. demonstrated that Eu3+ should be mainly located 12
at S6 sites especially at low concentration [30]. Zych et al. also confirmed this
13
assertion and furthermore demonstrated that it is impossible to entirely remove 8b 14
emission coming from S6 sites in Lu2O3 compounds. However this author indicates 15
that 8b emission should be minimized in hosts like Sc2O3:Eu3+[31].
16
As a general LaPorte rule, the 4f-4f dipolar electric transitions of Eu3+ are parity 17
forbidden. When Eu3+is located at a centro-symmetric site such as S6these transitions
18
remain forbidden. The dipolar magnetic transitions which are anyway much weaker 19
are allowed if J = 0, ±1 while J= 0 J=0 transitions are forbidden. Hence for Eu3+ 20
at the S6site at 10 K only7F0 5D1transition in absorption and5D0 7F1transition
21
in emission can be observed. Other5D0 7Fj transitions might be observed but with
22
very weak intensity as they originate from vibronic excited states of 5D0. On the
23
contrary, the C2site presents no symmetry inversion so that opposite parity states such
24
as 5d are admixed with 4f states. A relaxation of the selection rule therefore takes 25
place and dipolar electric transitions become partly allowed. Hence for Eu3+in C2site
1
all the 5D0 7Fj transitions can be observed. Those for which J = 0, ±2 being
2
“hypersensitive” to this phenomenon are enhanced. 3
Luminescence spectra of Lu2O3:Eu3+ and (Lu0.5Gd0.5)2O3:Eu3+ ceramics were
4
recorded at 10 K by exciting the ceramics between 525 nm and 530 nm. This 5
excitation wavelength range allows excitation of Eu3+ via the 7F0 5D1 transition
6
which is allowed for Eu3+ at both sites. Laser excitation was used in the aim of 7
selectively exciting Eu3+ in C2 or S6 sites. At 10 K a very limited number of vibronic
8
states of 5D0 are populated. Hence 5D0 7F1 transitions will be allowed for Eu3+ at
9
both sites whereas 5D0 7F0transitions will be allowed (forced dipolar electric) for
10
Eu3+in C2sites and forbidden for Eu3+in S6sites.
11
The emission spectra of Lu2O3:Eu3+for four exciting wavelengths i(i = 1, 2, 3, 4)
12
located between 525 nm and 530 nm with 1 > 2 > 3 > 4 are shown in Figure 6.
13
They display luminescence lines corresponding to intraconfigurational 4f-4f 14
transitions from the excited5D0levels of Eu3+to the various spin-orbit split states7Fj.
15
The dominant emission line at 611 nm originates from the 5D0 7F2 hypersensitive
16
transition of Eu3+in C2. In order to identify the possible contributions of Eu3+at both
17
sites, the shortest wavelength range (580 nm – 605 nm) was looked upon into detail. 18
Two groups of emission lines have been distinguished : (i) a first group (group 1) of 19
lines are present for 1excitation (lowest energy) and their relative intensity decreases
20
when the excitation energy increases ( excdecreases): they are pointed out on the main
21
graph of Figure 6 at 581.1 nm, 587.5 nm, 593.7 nm and 600-601 nm. (ii) the second 22
group (group 2) of lines are absent for 1 excitation and their relative intensity
23
increases when excdecreases : they are shown in the insets of Figure 6 at 582.6 nm,
24
593.1 nm and 596.8 nm. The other emission lines of the 580 nm – 605 nm range are 25
of lower intensity and are attributed to transitions to various vibronic states of the7F1
1
level. 2
As energy transfer is known to happen from Eu3+ in S6 site to Eu3+ in C2 site
3
[31,32,33] any exciting wavelength i of Figure 6 would allow the observation of the
4
luminescence of Eu3+ in C2 sites either by direct excitation of Eu3+ in C2 or by
5
excitation of Eu3+in S6and subsequent energy transfer to Eu3+in C2. As the lines in
6
group 2 are not observed for 1 excitation, group 2 is identified as originating from
7
Eu3+in S6whereas group 1 lines are produced by Eu3+in C2.
8
For Eu3+ in C2 site the emission line at 581.1 nm being the one at the highest
9
energy is identified as the5D0 7F0 transition of Eu3+. The three other emissions at
10
587.5 nm, 593.7 nm and 600-601 nm were attributed to transitions from 5D0 to the
11
three Stark components of the7F1level hence leading to a crystal field splitting of 369
12
cm-1 for the 7F1 level. The energy positions of the 7F0 and the split 7F1 levels named
13
7
F1a 7F1band 7F1c levels are reported in Table 2. In order to verify this attribution the
14
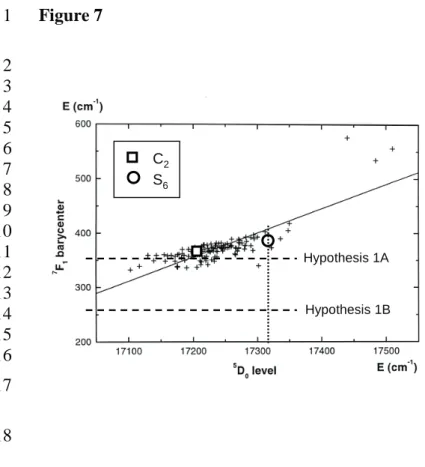
5
D0energy position and the barycenter of the7F1levels were reported in Figure 7. The
15
figure displays the barycenter law - in that case, for lanthanide cations, only the spin 16
orbit interaction is considered - enounced by Antic-Fidancev [34] corresponding to 17
the position of the7F1level barycenter without any effect of the crystal field in regard
18
to the position of the 5D0 level. Data for Eu3+ in C2 lie right on the line of the
19
barycenter law, which corroborates our attribution. 20
For Eu3+ in S6 site, the attribution of the emission lines shown in the insets of
21
Figure 6 is a little bit more delicate. The emission line at 582.6 nm is very close to the 22
5
D0 7F0 line of Eu3+ in C2 site (581.1 nm) and one could assume that it would
23
correspond to the 5D0 7F0 transition of Eu3+ in S6 site as it was reported in
24
Y2O3:Eu3+ by Hunt and Pappalardo [35]. However this transition is forbidden and
would therefore appear with a somewhat lower intensity. Like several others [32,33] 1
we would rather attribute this line to a 5D0 7F1 transition. Within this frame two
2
hypotheses can be drawn. In a first hypothesis (hypothesis 1), following Buijs [32], 3
Meijerink and Blasse [16], the lines at 582.6 nm and 593.1 nm would correspond to 4
transitions 5D0 7F1a and 5D0 7F1b whereas the line at 596.8 nm would be a
5
transition from 5D0 to a non-fundamental vibronic level of 7F1. According to groups
6
theory the 7F1 levels may split into only two levels, one of them being degenerated.
7
Depending on which one is degenerated two barycenter points (hypothesis 1A and 8
1B) were calculated as shown in Table 2. Their position is reported in Figure 7.Both 9
points seem too low regarding to the barycenter law of Antic-Fidancev. In a second 10
hypothesis (hypothesis 2), we assume a slightly distorted S6 site which allows the
11
three 7F1 levels to be non-degenerated. The three lines at 582.6 nm, 593.1 nm and
12
596.8 nm would then correspond to 5D0 7F1a, 7F1b, 7F1c transitions as reported in
13
Table 2. In that case, the barycenter point would be more properly located in Figure 7. 14
We therefore adopted this last hypothesis. 15
The emission spectra of (Lu0.5Gd0.5)2O3:Eu3+ at 10 K excited at three various
16
wavelengths in the 525 nm – 530 nm range are shown in Figure 8. They present 17
similar features to Lu2O3:Eu3+ with widened lines. This is explained by the disorder
18
created by the substitution of one half of lutetium ions by larger gadolinium ions. By 19
varying the excitation wavelength the spectra vary less than in the case of Lu2O3
20
:Eu3+. One can mainly observe the transition lines of5D0 7F0at 581 nm,5D0 7F1
21
(587,7 nm, 593,4 nm and 600,2 nm) of Eu3+in C2. The energy positions of the levels
22
are reported in Table 2. They are close to values for C2 site in Lu2O3. Note the
23
important fact that for Eu3+ in S6 only the 5D0 7F1 transition can be observed at
24
582.2 nm and with a weak intensity. This shows that the occupation ratio of Eu3+in S6
relative to C2 is smaller in (Lu0.5Gd0.5)2O3:Eu3+ than in Lu2O3:Eu3+. This difference
1
between the two compounds will be observed with even more acuity in the following 2
part of the paper (cf. Figure 10). 3
The decay curves at 10 K of Eu3+in C2and S6 sites was measured by exciting the
4
samples via the7F0 5D0 line and recording the 5D0 7F1a emission line. They are
5
shown in Figure 9. The decay profiles of Eu3+in S6 sites for both sesquioxides were
6
found mono-exponential with a decay time of several milliseconds. For Eu3+ in C2
7
sites the decays may appear bi-exponential though the second exponential part reaches 8
quickly the background level. Different decay times were calculated depending on the 9
site occupied by Eu3+. In Lu2O3:Eu3+, the trivalent europium at the S6 site presents a
10
characteristic lifetime of 4.7 ms whereas its main decay time is 1.4 ms at the C2 site.
11
These results are in line with decay times found by Zych et al. in Lu2O3:1%Eu3+ at
12
room temperature: 4.4 ms at the S6 site and 1.4 ms at the C2 site [31]. In
13
(Lu0.5Gd0.5)2O3:Eu3+,the lifetimes were measured as 3.8 ms and 1.0 ms for Eu3+at the
14
S6 and C2 sites, respectively. Hence in both host materials the decay times are much
15
shorter for Eu3+ at the C2 than at the S6 site, due to the much more symmetrical
16
character of S6relative to C2. On the other hand the (Lu0.5Gd0.5)2O3host contributes to
17
reducingthe decay times of Eu3+in both C2and S6sites which may be explained by a
18
less symmetrical environment in (Lu0.5Gd0.5)2O3than in Lu2O3. The decay time for the
19
second part of the curves for Eu3+in C2sites was not calculated as the signal was too
20
noisy. However the decay time is in the order of some milliseconds. This most 21
probably corresponds to the energy transfer from Eu3+at S6sites to Eu3+at C2sites as
22
it was shown to take place in ref. 31. 23
Those different time decaying emissions should therefore contribute to the “short 24
afterglow” of the ceramics as defined in the first paragraph. This can be visualized on 25
time-resolved luminescence spectra presented in Figure 10. Figure 10.A shows 1
spectra of Lu2O3:Eu3+. Over the first microseconds (spectrum (a)), emissionfrom Eu3+
2
in C2and S6sites is observed. The C2emission dominates with the hypersensitive5D0
3
7
F2 line. Over the 6-9 ms time range one can mainly observe the contribution of
4
Eu3+is S6sites as it corresponds to the decay time period of Eu3+in S6whereas Eu3+
5
fast emission in C2 has almost totally vanished. The 5D0 7F2 hypersensitive
6
transition of Eu3+in C2site is also observed with a weak intensity. Over the 20-25 ms
7
time interval the main part of Eu3+ emission in both sites has decayed. Only residual 8
emission from both sites is observed with a similar intensity. Similar features are 9
observed in Figure 10 B for (Lu0.5Gd0.5)2O3:Eu3+with a different ratio between C2and
10
S6 due to different decay times and different repartition of Eu3+ ions. Most clearly a
11
main difference between Lu2O3:Eu3+ and (Lu0.5Gd0.5)2O3:Eu3+ can be underlined in
12
the first microseconds in the zooms of spectra (a) : the intensity of the5D0 7F0line
13
of Eu3+ in S6 is much less important in (Lu0.5Gd0.5)2O3:Eu3+ (B) than in Lu2O3:Eu3+
14
(A). Quantitatively the ratio of the emissions from the 5D0 7F0 line of Eu3+in S6
15
over the 5D0 7F1a line of Eu3+ in C2 varies from 2.2 in Lu2O3:Eu3+ to 0.4 in
16
(Lu0.5Gd0.5)2O3:Eu3+. This shows again very clearly that the population of S6site over
17
C2by Eu3+is much lower in (Lu0.5Gd0.5)2O3:Eu3+than in Lu2O3:Eu3+.
18 19
Discussion
20 21
Transparent ceramics of Lu2O3: 6% Eu3+ and (Lu0.5Gd0.5)2O3 : 7 % Eu3+ were
22
prepared in a strictly identical way so that the differences between the two samples 23
are limited to the composition. Though it is always difficult to avoid any effect of the 24
microstructure in a ceramics sample, the two ceramics presented similar total 1
transmission and light output. 2
By selectively exciting Eu3+ at the two cationic sites of the sesquioxide structure 3
we could observe emission of the dopant ion at both sites in the Lu2O3:Eu3+and in the
4
(Lu0.5Gd0.5)2O3:Eu3+ ceramics though a very different repartition of Eu3+ in the two
5
sites was observed according to the composition. The decay time of the emitting 6
excited 5D0 state of Eu3+ was found very different from one site to the other. Light
7
emitted from the europium ions located in the non centro-symmetric C2 site almost
8
totally decayed within 3. C2 , i.e. 4-5 ms in Lu2O3:Eu3+ and 3-4 ms in
9
(Lu0.5Gd0.5)2O3:Eu3+. Europium ions occupying S6sites needed 3. S6, i.e. 14-15 ms in
10
Lu2O3 and 11-12 ms in (Lu0.5Gd0.5)2O3:Eu3+ to emit the quasi-totality of their
11
luminescence. Hence the repartition of dopant ions amongst the C2 and S6 sites is of
12
great importance as far as the time response of the scintillator is concerned. Even in 13
the hypothesis where no delay is introduced by charge trapping, the sole influence of 14
dopant repartition among the two sites affects what was measured here as the “short 15
afterglow”. Indeed the afterglow measured here up to 20 ms was found more 16
important for Lu2O3:Eu3+ than for (Lu0.5Gd0.5)2O3:Eu3+. This is directly related with
17
the decay times of Eu3+ which were found shorter in (Lu0.5Gd0.5)2O3:Eu3+ than in
18
Lu2O3:Eu3+ at both sites. This can be understood as the presence of gadolinium
19
introduces an asymmetry which may relax the selection rules for 4f-4f transitions and 20
therefore increase the probability in (Lu0.5Gd0.5)2O3:Eu3+ of the otherwise forbidden
21
transitions. 22
Moreover, we showed that the population of S6 sites by Eu3+ is much lower in
23
(Lu0.5Gd0.5)2O3:Eu3+than in Lu2O3:Eu3+. As the decay of Eu3+luminescence is at least
24
3 times longer in S6 than in C2 site, this fact will result in a shorter decay of Eu3+
luminescence measured in (Lu0.5Gd0.5)2O3:Eu3+ compared to Lu2O3:Eu3+. The
1
different Eu3+ localization in sites of (Lu0.5Gd0.5)2O3:Eu3+ relative to Lu2O3:Eu3+ can
2
be understood by considering the sizes of the Lu3+, Gd3+and Eu3+cations. Levy et al. 3
[36] showed that in cubic sesquioxides, an isovalent cationic dopant such as Eu3+ 4
preferably substitutes the host cation at the C2 site if it is smaller than the host cation
5
and at the S6site otherwise. This would originate from the presence around the cation
6
in C2 of bonds both shorter and longer than the average distance whereas all the
7
distances are equal in S6. The shorter bonds in C2 would therefore favor the presence
8
of smaller cations. In Lu2O3:Eu3+, Eu3+ being larger than Lu3+ would preferentially
9
occupy S6. In (Lu0.5Gd0.5)2O3 the average cationic size is bigger than in Lu2O3 so the
10
affinity of Eu3+for S6should decrease.
11
Finally we showed that the “long afterglow” was also higher in Lu2O3:Eu3+than in
12
(Lu0.5Gd0.5)2O3:Eu3+. The TSL glow curves were found consistent with this
13
observation as the TSL intensity was highly reduced in (Lu0.5Gd0.5)2O3:Eu3+compared
14
to Lu2O3:Eu3+ over the whole temperature range. However we showed that the main
15
TSL peak at around 200 K may be more specifically responsible for afterglow at 16
around 100-300 ms. Trojan et al. [20] recently showed that the afterglow in 17
Lu2O3:Eu3+was mainly related to Eu3+at S6sites. Either the energetic location of Eu3+
18
at S6site was more favorable to the transfer from the trap to the luminescent center or
19
the traps were located in the vicinity of Eu3+ at S6 sites [20]. We showed here that
20
(Lu0.5Gd0.5)2O3:Eu3+favored the location of Eu3+ ions more in C2 sites and less in S6
21
sites relative to the host Lu2O3. Following the argument of Trojan et al., this would
22
result in less afterglow, and that is precisely what was observed here (see Figure 3). 23
Alternatively the decrease of TSL intensity may be explained by a reduction in 24
stress and therefore of defects related to Eu3+ introduction into the host. One can 25
briefly analyze the induced distortion of the Lu2O3 host when introducing Eu3+ as a
1
dopant relatively to distortion occurring in the (Lu0.5Gd0.5)2O3 host. First, one can
2
observe an increase of the measured unit cell parameter from 10.391 Å for Lu2O3 to
3
10.602 Å for (Lu0.5Gd0.5)2O3, in good agreement with the variation of the ionic radii
4
of the constituent (0.95 Å, 0.938 Å and 0.848 Å for Eu3+, Gd3+ and Lu3+, 5
respectively). The distortion occurring when introducing Eu3+ ions in Lu2O3 can be
6
estimated by calculating the ratio of the lattice parameters of Eu2O3(no distortion and
7
a = 10.866 Å) and Lu2O3. In this case, the ratio is 4.5%. When introducing Eu3+in the
8
(Lu0.5Gd0.5)2O3 host, the ratio becomes 2.5%. This effect indicates that for
9
(Lu0.5Gd0.5)2O3 compounds the introduction of Eu3+ occurs with limited distortions
10
with regard to the Lu2O3host.
11 12
Conclusion
13 14
We propose a transparent ceramics prepared from the mixed sesquioxide 15
(Lu0.5Gd0.5)2O3 doped with trivalent europium as a potential new scintillator with
16
improved time response characteristics relative to the well-known Lu2O3:Eu3+.
17
(Lu0.5Gd0.5)2O3:Eu3+presents a density of about 8.4 g/cm3, which still lies amongst the
18
highest densities of existing scintillators and therefore is very favorable for efficient 19
X-rays absorption within a small thickness. The measured total transmission was 20
found close to the maximum value (81 %) while no laser quality polishing of the 21
samples has been done (this is usually the case in the scintillator field where the main 22
purpose is to extract the maximum light output). 23
With afterglow and TSL measurements we demonstrated the advantages of 24
(Lu0.5Gd0.5)2O3:Eu3+ceramics over Lu2O3:Eu3+. On the one hand (Lu0.5Gd0.5)2O3:Eu3+
presents a faster intrinsic decay time for Eu3+ and on the other hand the ceramics 1
shows a reduced afterglow over the hundreds of milliseconds time range and a 2
reduced TSL intensity over the 10 K - 650 K temperature range. 3
These improved properties were explained in two terms. First Eu3+intercalation in 4
(Lu0.5Gd0.5)2O3:Eu3+most probably leads to less distortion than Eu3+in Lu2O3:Eu3+as
5
a better cationic size match occurs. Hence less defects in the material may be 6
susceptible to trap charges during irradiation and delay their subsequent transfer and 7
recombination at Eu3+ions. This therefore reducesTSL intensity and afterglow. 8
Secondly and most of all we demonstrated that (Lu0.5Gd0.5)2O3composition allows
9
a different repartition of Eu3+ ions amongst the C2 and S6 cationic sites of the
10
sesquioxide structure. Eu3+ ions at both sites in Lu2O3:Eu3+ and (Lu0.5Gd0.5)2O3:Eu3+
11
ceramics have been characterized in terms of energy level positions and kinetics of the 12
fluorescence by selectively exciting Eu3+ at the two cationic sites of the sesquioxide 13
structure. The (Lu0.5Gd0.5)2O3:Eu3+ compound was shown to greatly favor
14
intercalation of Eu3+in C2site over S6. Eu3+at C2site presents a fast decay (1 ms and
15
1.4 ms for (Lu0.5Gd0.5)2O3:Eu3+ and Lu2O3:Eu3+), respectively while the decay
16
constant of Eu3+at S6site is almost 4 times longer (3.8 ms and 4.7 ms respectively for
17
(Lu0.5Gd0.5)2O3:Eu3+ and Lu2O3:Eu3+). Thus favoring the substitution by Eu3+at a C2
18
site was found to decrease the effective decay time of the ceramics. Additionally the 19
different repartition of Eu3+at C2and S6sites in the two different ceramics should also
20
have an effect on afterglow as Eu3+ at S6 site may be responsible for afterglow.
21
Further work is now required to determine with more accuracy the light yield and the 22
energy resolution of these promising scintillators. 23
24 25
Acknowledgment
1 2
The authors would like to thank Saint-Gobain Crystals and Detectors for their 3
support and especially Northboro Research and Development Center for providing the 4
high quality ceramics and for the afterglow measurements. 5
6 7 8
References
1
[1] Rossner W, Ostertag M, Jermann F 1999 J Electrochem Soc Proceedings 98 187. [2] Greskovich CD, Cusano D, Hoffman D, Riedner RJ 1992 Am Ceram Soc Bull 71 1120.
[3] Izumi S, Kamata S, Satoh K 1993 IEEE Trans Nucl Sci 40 158.
[4] Ryzhikov V, Grynyov B, Opolonin A, Naydenov S, Lisetska O, Galkin S, Voronkin E 2007 Rad Measur 42 915.
[5] Weber MJ, Monchamp RR 1973 J Appl Phys 44 5495. [6] Nestor OH, Huang CY 1975 IEEE Trans Nucl Sci 22 68. [7] Knoll GF 1999 Radiation Detection and Measurement.
[8] Cooke DW, McClellan KJ, Bennett BL, Roper JM, Whittaker MT, Muenchausen RE, Sze RC 2000 J Appl Phys 88 7360.
[9] Pidol L, Guillot-Noël O, Kahn-Harari A, Viana B, Pelenc D, Gourier D 2006 J. Phys Chem Solids 67 4 643.
[10] Pauwels D, Le Masson N, Viana B, Kahn-Harari A, van Loef EVD, Dorenbos P, van Eijk CWE 2000 IEEE Trans Nucl 47 6 1787.
[11] Pidol L, Kahn-Harari A, Viana B, Ferrand B, Dorenbos P, de Haas JTM, van Eijk CWE, Virey E 2003 J Phys Cond Matter 15 12 2091.
[12] Pidol L, Kahn-Harari A, Viana B, Virey E, Ferrand B, Dorenbos P, de Haas JTM, van Eijk CWE 2004 IEEE Trans Nucl Sci 51 3 1084.
[13] Wang Y, Antonuk L E, Zhao Q, El-Mohri Y, Perna L 2009 Med. Phys. 36 5707. [14] Valais IG, Michail CM, David SL, Liaparinos PF, Fountos GP, Paschalis TV, Kandarakis IS, Panayiotakis GS 2010 IEEE Trans. Nucl. Sci. 57 3.
[15] Viana B, Bessière A, Rétot H, Mattmann E, LaCourse B. 2011 in press, Opt. Mater., doi:10.1016/j.optmat.2010.10.021.
[16] Blasse G, Grabmaier BC 1994 Luminescent Materials. Springer-Verlag Telos.
[17] Lempicki A, Brecher C, Szupryczynski P, Lingertat H, Nagarkar V, Tipnis S, Miller S 2002 Nucl Instrum Meth Phys.Res A 488 579.
[18] Brecher C, Bartram RH, Lempicki A 2004 J Lumin 106 159.
[19] Kappers L, Bartram R, Hamilton D, Brecher C, Lempicki A 2005 Nucl Instrum Meth Phys Res A 537 443.
[20] Trojan-Piegza J, Zych E 2010 J Phys Chem C 114 4215.
[21] Trojan-Piegza J, Niittykoski J, Hölsä J, Zych E 2008 Chem Mater 20 2252. [22] Köstler W, Winnaker A, Rossner W, Grabmaier BC 1995 J Phys. Chem Solids 56 907.
[23] Rossner W, Jermann F, Ahne S, Ostertag M 1997 J Lumin 72-74 708. [24] Rétot H. Phd thesis, 2009, Université Pierre et Marie Curie.
[25] Blahuta S, Viana B, Bessière A, Mattmann E., LaCourse B 2011 Opt. Mater. In press. Doi : 10.1016/j.optmat.2011.02.040
[26] Chen Q, Shi Y, An L, Chen J, Shi J 2006 J Am Ceram Soc 89 2038. [27] Zych E, Hreniak D, Strek W 2002 J Phys Chem B 106 3805.
[28] Cherepy NJ, Gaume R, Podowitz SR 2010 Oral presentation at symposium on radiation measurements and applications (sorma).
[29] Concas G, Spano G, Zych E, Trojan-Piegza J 2005 J Phys: Condens Matter 17 2597.
[30] Stanek CR, McClellan KJ, Uberuaga BP, Sickafus KE, Levy MR, Grimes RW 2007 Phys Rev B 75 134101.
[31] Zych E, Karbowiak M, Domagala K, Hubert S 2002 J Alloys Compd 341 381. [32] Buijs M, Meyerink A, Blasse G 1987 J Lumin 37 9.
[34] Antic-Fidancev E. 2000 J Alloys Compd 300-301 2. [35] Hunt RB, Pappalardo RG 1985 J Lumin 34 133.
[36] Levy MR, Stanek CR, Chroneos A, Grimes RW 2007 Solid State Sci 9 588. 1
Tables
1 2
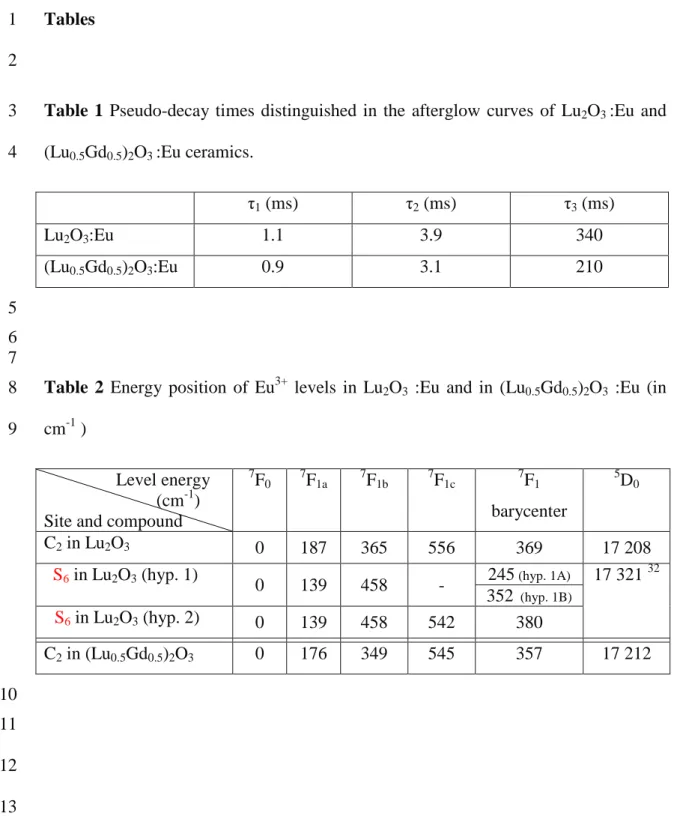
Table 1 Pseudo-decay times distinguished in the afterglow curves of Lu2O3:Eu and
3
(Lu0.5Gd0.5)2O3:Eu ceramics.
4 1(ms) 2(ms) 3(ms) Lu2O3:Eu 1.1 3.9 340 (Lu0.5Gd0.5)2O3:Eu 0.9 3.1 210 5 6 7
Table 2 Energy position of Eu3+ levels in Lu2O3 :Eu and in (Lu0.5Gd0.5)2O3 :Eu (in
8
cm-1 ) 9
Level energy (cm-1) Site and compound
7 F0 7F1a 7F1b 7F1c 7F1 barycenter 5 D0 C2in Lu2O3 0 187 365 556 369 17 208 S6in Lu2O3(hyp. 1) 0 139 458 - 245(hyp. 1A) 17 321 32 352 (hyp. 1B) S6in Lu2O3(hyp. 2) 0 139 458 542 380 C2in (Lu0.5Gd0.5)2O3 0 176 349 545 357 17 212 10 11 12 13
Figure captions
1
Figure 1. Total transmission spectra of Lu2O3: 6% Eu3+and (Lu0.5Gd0.5)2O3: 7% Eu3+
2
ceramics. Main transitions from the fundamental level 7F0 towards the indicated
3
excited levels of Eu3+are given on the figure. 4
5
Figure 2. X-ray excited luminescence spectra of Lu2O3: 6% Eu3+and (Lu0.5Gd0.5)2O3
6
: 7% Eu3+ ceramics relative to commercial GOS : Pr3+. The extraction of light 7
between GOS : Pr3+ and sesquioxides should not be compared as sesquioxides are 8
transparent whereas GOS :Pr3+is only slightly translucent. 9
10
Figure 3. Afterglow curves of Lu2O3:Eu and (Lu0.5Gd0.5)2O3:Eu ceramics.
11 12
Figure 4. Thermally Stimulated Luminescence (TSL) glow curves of Lu2O3:Eu and
13
(Lu0.5Gd0.5)2O3:Eu ceramics after X-ray irradiation at 10 K. Heating rate : 20 K /
14
minute. 15
16
Figure 5. Cristal structure of Lu2O3 showing the symmetry of the two cationic sites C2
17
and S6.
18 19
Figure 6. Laser-excited luminescence spectra of Lu2O3: 6% Eu3+ excited at four
20
different wavelengths between 525 nm and 530 nm with 1 > 2 > 3 > 4 and
21
recorded at 10 K. 22
23
Figure 7. Position of the 7F1 barycenter versus 5D0 level (in red) for Eu3+ in the two
24
sites of Lu2O3 compared to the barycenter law (in black) from 27. In blue are drawn
25
the two ruled out hypothesis for position of Eu3+in S6site.
26 27
Figure 8. Laser-excited luminescence spectra of (Lu0.5Gd0.5)2O3 : 7% Eu3+ excited at
1
three different wavelengths between 525 nm and 530 nm with 1 > 2 > 3 and
2
recorded at 10 K. 3
4
Figure 9. Decay profiles of 5D0 7F1a emission excited at 10K via the 7F0 5D0
5
transition at 581.2 nm in Lu2O3:Eu and 581.3 nm in (Lu0.5Gd0.5)2O3:Eu for Eu3+in C2
6
and at 582.6 nm for Lu2O3:Eu and 582.9 nm in (Lu0.5Gd0.5)2O3:Eu for Eu3+in S6. The
7
emission wavelengths are (i) for Lu2O3:Eu, 582.7 nm and 587.7 nm for Eu3+in S6and
8
C2 sites, respectively(ii) for (Lu0.5Gd0.5)2O3:Eu, 582.9 nm and 588.1 nm for Eu3+in
9
S6and C2sites, respectively.
10 11
Figure 10. Time-resolved luminescence spectra of Lu2O3:Eu (A) and
12
(Lu0.5Gd0.5)2O3:Eu (B) ceramics recorded at 10 K for time intervals indicated on the
13
figure. Ceramics were excited via the7F0 5D1transition at 525 nm- 530 nm.
14 15 16
1 Figures 2 Figure 1 3 4 5 6 Figure 2 7 8 9 10 11 12 13 14 15 16
1 2 Figure 3 3 4 5 6 Figure 4 7 8 9 10 11 12 13 14 15 16 17
1 2 3 Figure 5 4 5 6 7 8 9 10 11 12 13 14 15 16 17 Figure 6 18 19 20 21 22 23 24
O
2-Ln
3+S
6C
2O
2-Ln
3+S
6C
2Figure 7 1 2 3 4 5 6 7 8 9 10 11 12 13 14 15 16 17 18 19 Figure 8 20 21 22 23 24 25 26 27 28 29 30 Hypothesis 1A Hypothesis 1B C2 S6 Hypothesis 1A Hypothesis 1B C2 S6
Figure 9
1
2 3 4
Figure 10 1 2 3 4 5