Pépite | Caractérisation en temps réel, des dommages subis par l’ADN sous un faisceau d’irradiation thérapeutique, par le silicon nano tweezers et son dispositif microfluidique
176
0
0
Texte intégral
(2) Thèse de Grégoire Perret, Lille 1, 2015. Order Number 41965. Year 2015. THESIS Presented to. The University of Lille I – Sciences and Technology To obtain the title of. DOCTEUR DE L’UNIVERSITE Specialty: Micro and Nano Technologies, Acoustics and Telecommunications. REAL-TIME ASSAY OF DNA DAMAGE BY THERAPEUTIC RADIATION BEAMS WITH SILICON NANO TWEEZERS AND MICROFLUIDIC SETUP by. Grégoire PERRET Publicly defended on December 14th, 2015 in front of the jury:. Dr. Xavier GIDROL. BIOMICS-INSERM U1038, CEA, Grenoble. Reviewer. Dr. Liviu NICU. DR CNRS, LAAS-CNRS, Toulouse. Reviewer. Pr. Lionel BUCHAILLOT. DR CNRS, IEMN, Lille. Examiner. Dr. Anthony COLEMAN. DR CNRS, Laboratoire Multimatériaux et interfaces, Université Lyon 1. Examiner. Pr. Hiroyuki FUJITA. DR CNRS, LIMMS/CNRS-IIS, Tokyo. Invited. Pr. Eric LARTIGAU. PU-PH, Universite de Lille-2, Centre Oscar Lambret, Lille. Invited. Dr. Dominique COLLARD. Université de Tokyo / IEMN. Co-Supervisor. Pr. Fabrizio CLERI. IEMN, Universite de Lille-1. Co-Supervisor. © 2015 Tous droits réservés.. lilliad.univ-lille.fr.
(3) Thèse de Grégoire Perret, Lille 1, 2015. © 2015 Tous droits réservés.. lilliad.univ-lille.fr.
(4) Thèse de Grégoire Perret, Lille 1, 2015. Résumé. Dans les premières années de la radiothérapie, les mécanismes d’action et les effets secondaires des radiations ionisantes n’étaient que faiblement compris. La génétique moléculaire a clairement montré les dommages causés par ses radiations sur l’ADN des cellules. Cependant, le rayonnement ne distinguant pas les cellules saines des cellules tumorales, les plus grandes avancées modernes en radiothérapie sont concentrées sur l'amélioration de la précision de la dose délivrée. Avec un intérêt relativement bas pour la compréhension fondamentale des mécanismes de base des dégâts biologiques induits par irradiation. Dans le 1er chapitre de cette thèse, l’état de l’art conduit à considérer le Silicon Nano Tweezers (SNT) comme un excellent candidat pour l’exploration des champs méconnus de la radiothérapie. Le 2nd chapitre présente le SNT et sa capacité à caractériser en temps réel les propriétés biomécaniques de l’ADN. Le 3ème chapitre montre le dispositif entourant le SNT et évalue sa capacité à mesurer les caractéristiques d’un faisceau d’ADN en milieu liquide subissant le rude champ électromagnétique généré par la machine de radiothérapie : le Cyberknife. Le 4ème chapitre explique le protocole spécialement développé pour la caractérisation par le SNT de l’ADN en milieu liquide. Le 5ème chapitre présente les résultats clés, obtenus dans diverses conditions, de caractérisations mécaniques en temps réel de faisceau d’ADN irradiés par le Cyberknife. La dernière partie conclue finalement sur les possibilités et les perspectives offertes par la technologie des Microsystèmes électromécaniques dans l’avancée de la recherche en radiothérapie et en plus largement en médecine.. © 2015 Tous droits réservés.. lilliad.univ-lille.fr.
(5) Thèse de Grégoire Perret, Lille 1, 2015. Abstract. In the early days of radiotherapy, very little was known about the mechanism of action of ionizing radiation and its side effects. The understanding of molecular genetics has made it clear that radiation damages mainly the DNA of cells. However, since radiation does not distinguish between healthy and tumor cells, the largest improvement of the radiotherapy technology in modern days has concentrated on improving the precision of dose-deliver, with a comparatively lower interest in the fundamental understanding of the basic mechanisms of biological radiation damage. In the first chapter of this thesis, the state of the art conducts to consider the Silicon Nano Tweezers (SNT) as an excellent candidate to explore unknown field of the radiotherapy treatment. The second chapter introduces the SNT and explains its ability to conduct real-time biomechanical characterization of a DNA bundle. The third chapter shows the surrounding SNT setup, and evaluates its capability to measure the biomechanical characteristic of a DNA bundle in liquid under the harsh electromagnetic environment generated by a radiotherapy machine: the Cyberknife. The fourth chapter explains the protocol developed for the DNA characterization in liquid by the SNT. The fifth chapter presents some key results of real-time mechanical characterization of DNA bundles under the Cyberknife irradiation in several conditions, followed by a discussion based on the theoretical model of a randomly damaged DNA bundle. The last part finally concludes on the capability and perspective offered by Microelectromechanical technologies to push the research in radiotherapy and in medicine.. © 2015 Tous droits réservés.. lilliad.univ-lille.fr.
(6) Thèse de Grégoire Perret, Lille 1, 2015. Acknowledgements. The research work presented in this thesis has been accomplished with the support from many people: mentors, colleagues, friends and family, to whom I would like to fully acknowledge. Their support, ideas, comments, and energy were essential in allowing me to successfully complete this thesis. Firstly, I would like to express my sincere gratitude to my advisor Professors Dominique Collard and Fabrizio Cleri for the continuous support of my PhD study and related research, for their patience, motivation, and immense knowledge. Their education and their expertise have been essential in this research. Their guidance helped me in all the time of research and writing of this thesis. I was fortunate to learn from different scientific cultures and points of view. Besides my advisors, I would like to thank Dr.Xavier Gidrol and Dr.Liviu Nicu, as part of the reading committee for their time, their comments and scientific inputs. I would like to thank also the members of my oral exam committee, Pr.Lionel Buchaillot, Dr.Anthony Coleman, Pr.Hiroyuki Fujita and Pr.Eric Lartigau, for their interest in the research of my thesis. It was a great honour and a privilege for me to have the chance to present my research work to them. I would like to express all my gratitude to my great colleagues, especially Dr. Nicolas Lafitte, Dr. Mehmet Cagatay Tarhan, Dr. Momoko Kumemura and Dr. Laurent Jalabert, Dr. Yannick Tauran, Kou Hakuson who help me a lot during my research. I am very much thankful to Thomas Lacornerie, I have been greatly aided by his knowledge and skills in the Physics of Radiotherapy. We spend a lot of time to perform experiments in the hospital in the evening after the treatment of patients. I am also grateful for what I have received from every members of the laboratory of Pr. Fujita and LIMMS laboratory. I appreciate the daily life with them, their friendship and their permanent support. I would like to extend my gratitude to the secretaries in IEMN and LIMMS which make everything possible and the life easier for us. I would like to thanks all my close friends for their unconditional love and encouragement. And especially Sequoya Yiaueki for his substantive help to enhance English expression of the thesis. And finally and the most important, I would like to thank my parents Christine and Frédéric Perret, my sisters and brothers. They were always supporting and encouraging me with their best wishes.. © 2015 Tous droits réservés.. lilliad.univ-lille.fr.
(7) Thèse de Grégoire Perret, Lille 1, 2015. Table of contents. Table of Contents General introduction and motivation ___________________________________________ 2 State of the Art in Radiotherapy and DNA damage analysis ________________ 6 1.1. Radiotherapy treatments ___________________________________________________ 7. 1.1.1. Introduction ___________________________________________________________________ 7. 1.1.2. History _______________________________________________________________________ 8. 1.1.3. State of art in radiotherapy _______________________________________________________ 9. 1.1.4. Side effects ___________________________________________________________________ 11. 1.1.5. Conclusion ___________________________________________________________________ 11. 1.2. Ionizing radiation interactions with DNA _____________________________________ 12. 1.2.1. Introduction __________________________________________________________________ 12. 1.2.2. Sources of ionizing radiation _____________________________________________________ 12. 1.2.3. Radiation beams from particle accelerators _________________________________________ 14. 1.2.4. Types of ionizing irradiation ______________________________________________________ 16. 1.2.5. Linear energy transfer __________________________________________________________ 20. 1.2.6. Radiation dose and units ________________________________________________________ 21. 1.2.7. Penetration of photon beams into a phantom or patient _______________________________ 22. 1.3. Biological analysis methods of DNA damage __________________________________ 25. 1.3.1. Introduction __________________________________________________________________ 25. 1.3.2. Radiation damage in DNA _______________________________________________________ 29. 1.3.3. Chromatography ______________________________________________________________ 35. 1.3.4. Strand break length studies ______________________________________________________ 39. 1.3.5. Conclusion: Need for alternative methods of damage detection _________________________ 41. 1.4. Force spectroscopy _______________________________________________________ 43. 1.4.1. Introduction __________________________________________________________________ 43. 1.4.2. Optical tweezers _______________________________________________________________ 43. 1.4.3. Magnetic tweezers _____________________________________________________________ 46. 1.4.4. Atomic force microscopy ________________________________________________________ 47. 1.4.5. Conclusion ___________________________________________________________________ 49. 1.5. Introduction to MEMS technology __________________________________________ 51. Silicon Nano Tweezers _____________________________________________ 54 2.1. © 2015 Tous droits réservés.. Introduction and SNT Principle _____________________________________________ 55. lilliad.univ-lille.fr.
(8) Thèse de Grégoire Perret, Lille 1, 2015. Table of contents. 2.2. The design and microfabrication ____________________________________________ 56. 2.2.1. The Single-Actuators SNT ________________________________________________________ 56. 2.2.2. The Double-Actuators SNT _______________________________________________________ 61. 2.2.3. Overview of the fabrication process _______________________________________________ 62. 2.3. SNT measurements ______________________________________________________ 65. 2.3.1. Single Actuators Silicon Nano Tweezers (S-A SNT) ____________________________________ 66. 2.3.2. Double Actuators Silicon Nano Tweezers (D-A SNT) ___________________________________ 73. 2.4. Conclusion ______________________________________________________________ 79. Set-up __________________________________________________________ 80 3.1. Introduction ____________________________________________________________ 81. 3.2. The radiotherapy machine _________________________________________________ 82. 3.2.1. The Cyberknife ________________________________________________________________ 82. 3.2.2. The phantom _________________________________________________________________ 84. 3.3. The microfluidic cavity ____________________________________________________ 85. 3.3.1. Introduction __________________________________________________________________ 85. 3.3.2. The static microfluidic cavity _____________________________________________________ 85. 3.3.3. The dynamic microfluidic cavity (DMC) _____________________________________________ 86. 3.4. The positioning robot _____________________________________________________ 88. 3.5. The controlled environment chamber _______________________________________ 89. 3.6. The LabVIEW program ____________________________________________________ 91. 3.6.1. The control window ____________________________________________________________ 91. 3.6.2. The data window ______________________________________________________________ 91. 3.7. Evaluation of the setup ___________________________________________________ 93. 3.7.1. Bare SNT _____________________________________________________________________ 93. 3.7.2. SNT and trapped DNA _________________________________________________________ 104. 3.8. Conclusion _____________________________________________________________ 112. Experimental Protocol ____________________________________________ 114 4.1. Introduction ___________________________________________________________ 115. 4.2. DNA trapping __________________________________________________________ 115. 4.3. SNT insertion inside a passive microfluidic cavity _____________________________ 116. © 2015 Tous droits réservés.. 4.3.1. Introduction _________________________________________________________________ 116. 4.3.2. DNA bundle conductance vs. humidity ____________________________________________ 117. lilliad.univ-lille.fr.
(9) Thèse de Grégoire Perret, Lille 1, 2015. Table of contents. 4.3.3. DNA bundle stiffness vs ambient humidity _________________________________________ 118. 4.3.4. 3D humidity imager ___________________________________________________________ 119. 4.3.5. Automatic insertion of DNA in microfluidic cavity ___________________________________ 120. 4.3.6. Conclusion __________________________________________________________________ 121. 4.4. SNT insertion inside dynamic microfluidic cavity ______________________________ 122. 4.4.1. Microchannel filling ___________________________________________________________ 122. 4.4.2. Detection of the meniscus ______________________________________________________ 122. 4.5. Summary of the experimental protocol _____________________________________ 125. 4.6. Conclusion _____________________________________________________________ 126. Results and Discussions ___________________________________________ 128 5.1. Introduction ___________________________________________________________ 129. 5.2. Results ________________________________________________________________ 130. 5.2.1. DNA irradiation in Air __________________________________________________________ 130. 5.2.2. DNA irradiation in DI water _____________________________________________________ 131. 5.2.3. DNA irradiation in HNO3 acid ____________________________________________________ 136. 5.2.4. DNA irradiation in Tris HCl buffer ________________________________________________ 138. 5.2.5. Discussion: The Theoretical Model _______________________________________________ 140. Conclusions and perspectives ________________________________________________ 144. © 2015 Tous droits réservés.. lilliad.univ-lille.fr.
(10) Thèse de Grégoire Perret, Lille 1, 2015. Table of contents. © 2015 Tous droits réservés.. lilliad.univ-lille.fr.
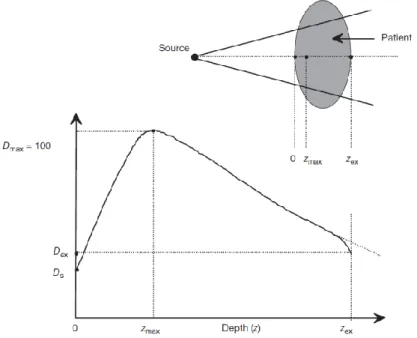
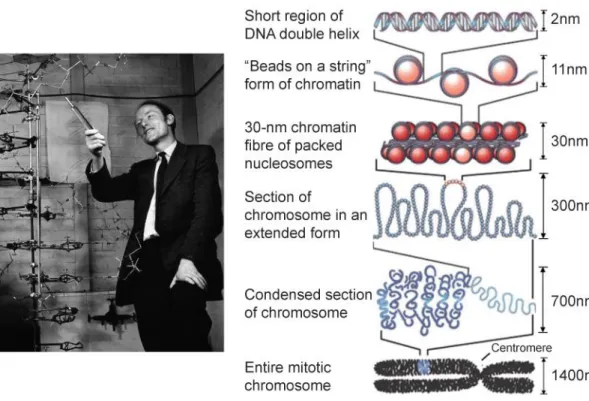
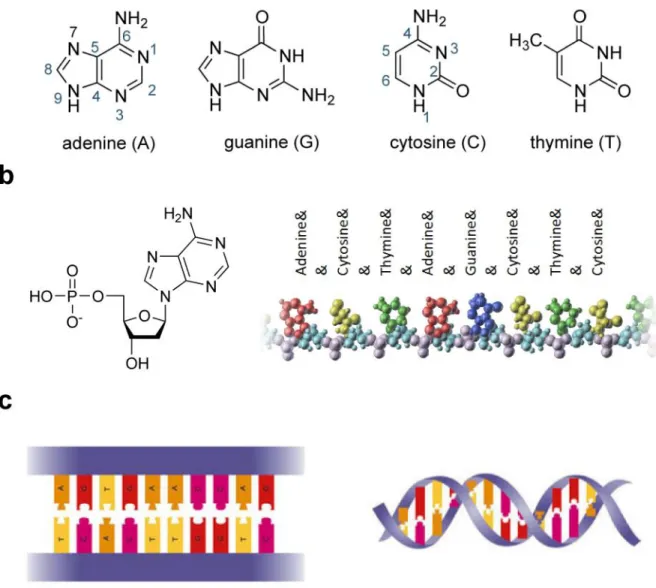
(11) Thèse de Grégoire Perret, Lille 1, 2015. Table of figures. Table of Figures Figure 0.1: Real-time mechanical characterization of a DNA bundle under radiotherapy treatment. .................................................................................................................................... 4 Figure 1.1: Example of a radioactive decay sequence. The principal decay modes are indicated by thick lines, minority modes by dashed lines. Gamma and internal conversion electrons in black, - decay in blue. Right branch: the metastable nuclide Tc99m decays with high efficiency from its level at 143 keV to 141 keV by internal conversion, then a principal gamma ray of 141 keV is emitted, going to the Tc99 ground state. From here, radioactive - decay of 294 keV gives the Ru99 stable nuclide. A minor path includes emission of 143 keV , and - decay to the 90 keV excited state of Ru99. Left branch: with small probability, Tc99m can undergo - decay to an excited state at +322 keV of Ru99; hence, a 322 keV -ray can take to ground state, or an intermediate 294 keV to a lower excited state; from here, a 90 keV or internal conversion electron takes Ru99 to the ground state. .................................................................................... 13 Figure 1.2: a. the spectrum of photon radiation emitted by a monochromatic beam of electrons with energies of 80 to 140 keV. The maximum energy of each bremsstrahlung spectrum ends at the electron energy. Note the characteristic X-ray lines of the Tungsten target at 59 and 67 keV. b. angular curves of isointensity of the emitted photon beam from electrons of 100 and 500 keV on a W target.............................................................................................................. 16 Figure 1.3: Schematic of the electromagnetic spectrum [12]................................................... 17 Figure 1.4: Dominant types of interactions as a function of the atomic number Z of the absorber and the energy of the photon radiation [13] ............................................................................. 18 Figure 1.5: Comparison of the calculated stopping power (dE/dx, in MeV/cm), for various light and heavy charged particles. The shape of the curves (from the Bethe-Bloch formula [14]) is always very similar, only being shifted to higher energies as the mass and charge of the projectile increase. For electrons, the Bethe-Bloch formula is modified by additional terms. 20 Figure 1.6: Dose deposition from a megavoltage photon beam in a patient. Ds is the surface dose at the beam entrance side, Dex is the surface dose at the beam exit side. Dmax is the dose maximum often normalized to 100, resulting in a depth dose curve referred to as the percentage depth dose (PDD) distribution. The region between z = 0 and z = zmax is referred to as the dose buildup region. ......................................................................................................................... 23 Figure 1.7: a. DNA 3D model by Watson and Crick’s in 1953. b. Scale of the DNA structure .................................................................................................................................................. 26. © 2015 Tous droits réservés.. lilliad.univ-lille.fr.
(12) Thèse de Grégoire Perret, Lille 1, 2015. Table of figures. Figure 1.8: Assembly of the DNA structure. a. Molecular structure of the four DNA bases: Adenine (A), Thymine (T), Cytosine (C) and guanine (G). b. nucleotides (left) are formed when a base (in this case, A) binds to a ribose sugar (pentagon), linked to a phosphate group. Since the ribose has lost one Oxygen in the binding, the nucleoside is called a deoxyribo-nucleoside, and becomes a deoxyribo-nucleotide when the phosphate (PO4H) is attached. A polymer holding many bases (example on the right) is formed when a nucleotide phosphate loses the OH group, and can bind to the -OH hanging group of a ribose from another nucleotide; this ribose loses its H, which forms a H2O molecule with the other OH, and the phosphate-sugarphosphate-sugar… backbone of a single-strand DNA is thus formed. c. Since A and T can form each two hydrogen bonds, while G and C can form three, two sequences of single-strand DNA can come together, if their respective sequences are complementary, pairing at every site two bases A-T or G-C on either side of the double backbone (left). Structural energy minimization, together with water and ion interactions in the nucleoplasm, force the paired double-polymer to assume the characteristic twisted double-helix shape (right), which won the Nobel prize to Wilkins, Watson and Crick. ..................................................................................................... 27 Figure 1.9: Types of DNA damage by ionizing radiations. ..................................................... 29 Figure 1.10: Direct versus indirect action [12] ........................................................................ 30 Figure 1.11: Radiolysis of intracellular water (H2O) [23] ....................................................... 31 Figure 1.12: A proposed model for DSB formation helped by oxygen. From the left to the right: formation of an initial radical at a T nucleotide (indicated as 1); adduction of O2 breaks the phosphate backbone (SSB) and incorporates an O2* radical; this can remove a H atom from a T on the opposite strand (lower path), reforming the radical 1 on the other strand; adduction of a second O2 molecule breaks the phosphate also on this strand, thus producing a DSB, from one single free radical + 2 O2 [29] . ................................................................................................. 33 Figure 1.13: The pathways of cellular DNA damage and repair that leads to senescence, apoptosis, or cancer cells .......................................................................................................... 34 Figure 1.14: Principle of the 32P post-labelling [33] ................................................................ 35 Figure 1.15: Preparation of DNA sample for GC/MS analysis................................................ 37 Figure 1.16: Schematic diagram of GC/MS [47] ..................................................................... 37 Figure 1.17: Diagram of tandem mass spectrometry (MS/MS). A sample is injected into the mass spectrometer, ionized and accelerated and then analyzed by mass spectrometry (MS1). Ions from the MS1 spectra are then selectively fragmented and analyzed by mass spectrometry (MS2) to give the spectra for the ion fragments....................................................................... 39. © 2015 Tous droits réservés.. lilliad.univ-lille.fr.
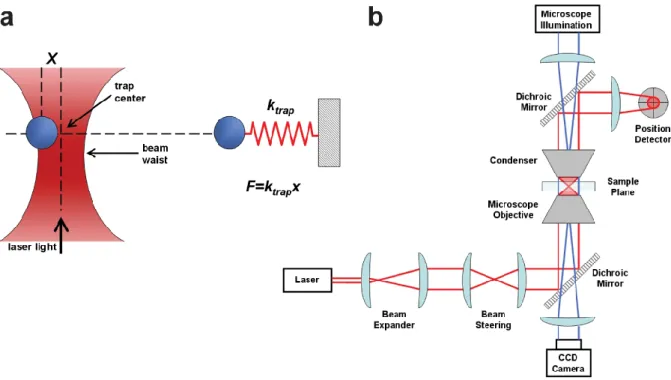
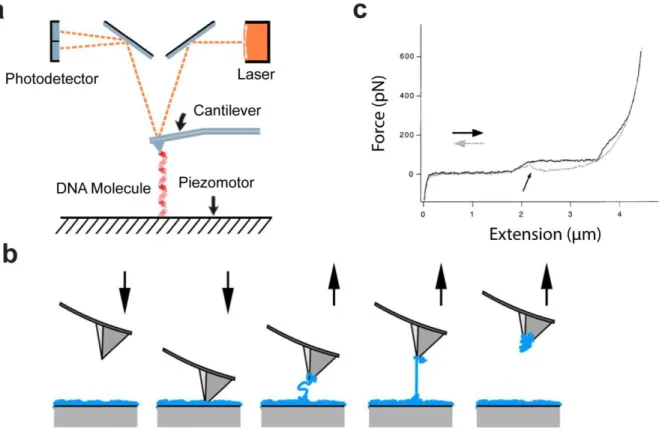
(13) Thèse de Grégoire Perret, Lille 1, 2015. Table of figures. Figure 1.18: Optical tweezers principle for DNA analysis. a. Force calculation. b. Schematic implementation ......................................................................................................................... 44 Figure 1.19: Magnetic tweezers principle for DNA analysis a. Schematic implementation. b. Force calculation [93]............................................................................................................... 46 Figure 1.20: Atomic Force Spectroscopy principle for DNA analysis a. Atomic force microscopy principle for DNA analysis. b. Molecule stretching by AFM tip.[96] c. Melting force of ds-DNA [97] Single-molecule extension is commonly obtained by the z-displacement of the piezo-actuated stage, and forces are generally calculated from the bending of the cantilever with a known spring constant. Molecules of interest are described as springs that generate a restoring force when they are mechanically stretched. Therefore the extension is the distance between the anchoring points, i.e. between the cantilever tip and the glass surface. 48 Figure 1.21: MEMS components ............................................................................................. 52 Figure 2.1: 3-D view of the SNT. The two arms are shown in blue, the actuator of the mobile arm in red, and the displacement sensor in green. A DNA bundle is trapped between the two tips of the SNT. The damped oscillator model of the SNT+DNA is illustrated on the right of the figure. ................................................................................................................................. 55 Figure 2.2: Schematic of the comb drive actuators .................................................................. 57 Figure 2.3: Close-up of the differential capacitive sensor. The right schematic illustrates displacement sensing through C1 and C2 capacitance variations. [9] ..................................... 58 Figure 2.4: Schematic of the mechanical structure of the SNT. Design of the three sets of suspensions, k1 for the actuators polarization, k2 for the mobile arm, and k3 for the central sensor plate. .............................................................................................................................. 59 Figure 2.5: Fabrication process of the sharp Silicon Nano Tweezers using Silicon-On-Insulator technology. The crystallographic orientation is indicated with Miller indices.[9] .................. 60 Figure 2.6: Schematic of the double actuators SNT................................................................. 61 Figure 2.7: Overview of the microfabrication process of sharp tip SNT [132] ....................... 63 Figure 2.8: a. Quarter of wafer after SNT fabrication. b. SNT released from the wafer, mounted, and wire bonded on PCB. c. 2 boxes of SNT prepared for travelling from Japan to France for in-hospital experimentations. ................................................................................................... 65 Figure 2.9: Schematic of the dynamic measurement with Single-Actuators SNT................... 67 Figure 2.10: a. Frequency response of the bare Silicon Nano Tweezers b. Damped oscillator model of the bare SNT ............................................................................................................. 68 Figure 2.11: a. Comparison of the frequency response of the bare SNT and SNT after DNA trapping b. Damped oscillator model of the SNT after DNA trapping .................................... 70. © 2015 Tous droits réservés.. lilliad.univ-lille.fr.
(14) Thèse de Grégoire Perret, Lille 1, 2015. Table of figures. Figure 2.12: Phase-locked loop schematic principle for real-time measurement of the resonance frequency and amplitude of the SNT, with or without trapped DNA[130]. ............................ 72 Figure 2.13: Real-time measurement of the resonance frequency and the amplitude of the single actuators Silicon Nano Tweezers. Measurements are conducted by the same SNT, in air without DNA and in cavity filled by DI water before and after DNA trapping. ................................... 73 Figure 2.14: Measurement principle schematic of the Double-Actuators SNT ....................... 74 Figure 2.15: Simplified oscillator model of a DNA bundle trapped by Double Actuators Silicon Nano Tweezers ......................................................................................................................... 75 Figure 2.16: Frequency response for 3 different DNA bundle stiffnesses on the same Double Actuators Silicon Nano Tweezers. And the frequency response of the bare D-A SNT in black. .................................................................................................................................................. 77 Figure 2.17: Real-time measurement by D-A SNT without any mechanical bridge between sensing and actuating arms. Influence of the actuating arm motion limited to some spikes due to abruptly applied voltage. ...................................................................................................... 78 Figure 2.18: Real-time measurement of the amplitude and resonance frequency of a D-A SNT after DNA trapping and immersion in DI water. Influence of the actuating arm motion on the sensing arm. .............................................................................................................................. 79 Figure 3.1: First Setup for DNA characterization under Cyberknife (2012) ........................... 81 Figure 3.2: Cyberknife radiotherapy system configuration. .................................................... 83 Figure 3.3: Collimator assembly of the LINAC accelerator on the head of the Cyberknife. .. 83 Figure 3.4: a. Design of the phantom (equivalent water density). b. SNT on micromanipulator, the phantom is fitted over the top of SNT. ............................................................................... 84 Figure 3.5: Design of the static microfluidic cavity. A small area (purple) is designed to introduce DNA solution for the DNA trapping. ....................................................................... 86 Figure 3.6: Design of the dynamic microfluidic cavity a. Photograph of the DMC b. Top and side view of the DMC schematic. [135] ................................................................................... 87 Figure 3.7: The dynamic microfluidic setup ([135]) ................................................................ 88 Figure 3.8: a. Picture of the 3D positioning-robot b. Picture of the positioning robot controller .................................................................................................................................................. 89 Figure 3.9: Design of the humidity and temperature controlled chamber ............................... 90 Figure 3.10: Recording of the temperature and relative humidity inside the isolated box of the SNT setup. The temperature is control to be constant at the human body temperature (37.5°C). .................................................................................................................................................. 90 Figure 3.11 Control window of the LabVIEW program for the installation of experiments ... 92. © 2015 Tous droits réservés.. lilliad.univ-lille.fr.
(15) Thèse de Grégoire Perret, Lille 1, 2015. Table of figures. Figure 3.12: Data window of the LabVIEW program ............................................................. 92 Figure 3.13: Variation of humidity, resonance frequency and amplitude of a bare SNT at constant temperature ................................................................................................................ 94 Figure 3.14: Influence of humidity on the mechanical properties of a bare SNT .................... 94 Figure 3.15: Temperature cycle from room temperature to 70°C and its effect on humidity and resonance frequency and amplitude of a bare SNT.................................................................. 95 Figure 3.16: Influence of the temperature on the mechanical properties of a bare SNT in air.96 Figure 3.17: Stability of the resonance frequency and amplitude of a bare SNT with its tips immerged in passive microfluidic cavity filled by DI water .................................................... 97 Figure 3.18: Shape of the meniscus of the dynamic microfluidic cavity a. Experimental detection of the meniscus by the SNT. b. Schematic of the meniscus ..................................... 98 Figure 3.19: a. Stability of the resonance frequency of a bare SNT for different insertion Height. b. Overview of the instability for insertion height lower than 30µm. c. Working region with acceptable stability.[132] ......................................................................................................... 99 Figure 3.20: Stability of the resonance frequency of a bare SNT for different insertion depth.[132] ............................................................................................................................. 100 Figure 3.21: Insertion repeatability inside the dynamic microfluidic cavit.[132] .................. 100 Figure 3.22: Long time stability of bare SNT inside the dynamic microfluidic cavity filled with DI water.[132] ........................................................................................................................ 101 Figure 3.23: Effect of the liquid change (PBS/DI water) on the resonance frequency of a bare SNT inserted inside a dynamic microfluidic cavity. [132] .................................................... 102 Figure 3.24: Control experiments to quantify the effect of ionizing irradiation on the resonance frequency of a bare SNT in several conditions. The irradiation beam (40mm aperture) is aligned with the tips of the SNT. a. The tips of the SNT are in Air b. The tips of the SNT are in DI water. ...................................................................................................................................... 103 Figure 3.25: Control experiments to evaluate the effect of ionizing irradiation on the resonance frequency of a bare SNT in air. The collimator aperture of the Cyberknife is equal to 5mm, and the irradiation beam is focused on different parts of the SNT. The graph plot the “Resonance frequency of the SNT” vs “Time” when the irradiation beam is focused on the tips of the SNT. Similar results are obtained with a focus on the sensor and the actuator of the SNT. ........... 104 Figure 3.26: DNA insertion inside passive microfluidic cavity filled by DI water. a. FR and A during DNA trapping, and after the trapping in air and in DI water. b. Zoom on the graph a to illustrate the stability of the DNA mechanical properties in DI water. .................................. 106. © 2015 Tous droits réservés.. lilliad.univ-lille.fr.
(16) Thèse de Grégoire Perret, Lille 1, 2015. Table of figures. Figure 3.27: FR and A measurements comparison in three cases: Bare SNT in air, bare SNT in DI water and SNT in DI water after DNA trapping. .............................................................. 107 Figure 3.28: Picture of trapped DNA in air, acid and Tris HCl buffer.[132] ......................... 108 Figure 3.29: pH effect on DNA mechanical properties. Reversible effect of the acid by Tris.HCl. [132] ....................................................................................................................................... 108 Figure 3.30: pH effect on the stiffness and viscous losses of a DNA bundles. [132] ............ 109 Figure 3.31 Effect of a cycle of second arm actuation (Vact2) on the sensing arm measurements, with SNT tips inside liquid. a. Before DNA trapping inside DI water b. After DNA trapping inside Tris.HCl buffer. ........................................................................................................... 110 Figure 3.32 Effect of the DNA elongation on DNA bundle stiffness (D-A SNT immersed inside Tris.HCl buffer). ..................................................................................................................... 111 Figure 3.33: Stability and noise of FR and A before and after DNA elongation. ................... 112 Figure 3.34: Complete setup in Centre Oscar Lambret hospital ............................................ 113 Figure 4.1: a. Schematic of the DNA trapping protocol. b. Picture of DNA trapped between sharp tips of the SNT and dielectrophoresis parameters. ....................................................... 116 Figure 4.2: Humidity imager Set-up. a. Microfluidic cavity on the top of the positioning-robot front of the SNT after DNA trapping. Scanning accessibility in red b. Schematic of the middle of the opening of a passive microfluidic cavity. .................................................................... 117 Figure 4.3: Comparison between experimental data found in the literature and the theoretical model of conductance. The other experimental data are extracted from the articles published by Ha et al. [138] and Kleine-Ostmann et al. [139]. An arbitrary unit is used because the slope of the curves is subject of interest. For the comparison, 𝐍𝐰 is also plotted: It clearly shows that the increase of ε (permittivity) with rh, rather than that of adsorbed water (Nw), is the dominating parameter that explains the increase of σ. [10] ................................................... 118 Figure 4.4: a.“log(DNA bundle conductance) and DNA bundle stiffness” vs “Distance of the DNA bundle to the meniscus. b.“Relative humidity” vs “Distance to the meniscus” ........... 119 Figure 4.5: “DNA bundle stiffness” vs. “relative humidity”. ............................................... 119 Figure 4.6 : 3D image of humidity around the opening of a microfluidic cavity .................. 120 Figure 4.7 : Automatic detection of the middle of a microfluidic cavity. .............................. 121 Figure 4.8: Pictures of the microchannel filling by DI water................................................. 122 Figure 4.9: Pictures of the dynamic microfluidic cavity before and during the SNT positioning. Themicrochannel filled by DI water is highlight in blue for a better understanding. ............ 123 Figure 4.10: Tweezers insertion protocol is performed in three steps. a. Channel top-level detection (1,2) and tweezers is positioned close to the channel vicinity (3). b. Detection of the. © 2015 Tous droits réservés.. lilliad.univ-lille.fr.
(17) Thèse de Grégoire Perret, Lille 1, 2015. Table of figures. precise channel location (4,5) and positioning (6). c. Detection of the air-liquid meniscus (7) and safe positionning is saved before DNA trapping (8). d. Assays is performed inside channel at the desired immersion depth.[140] ..................................................................................... 124 Figure 4.11: Resume of the experimental protocol ................................................................ 125 Figure 5.1: Variation of the resonance frequency of the SNT after DNA trapping under irradiation in Air. An irradiation in equivalent conditions but without DNA is performed to provide a reference. ................................................................................................................ 130 Figure 5.2: Comparison of the irradiation effect on the resonance frequency of 2 different DNA bundles in DI water trapped with the same SNT ................................................................... 132 Figure 5.3: DNA bundle stiffness variation under a set of 4 irradiations in DI water: Experiment 1. ............................................................................................................................................. 134 Figure 5.4: Comparison of the DNA bundle stiffness shift under a set of 4 irradiations in DI water. An equivalent number of DNA molecule which composed the bundle is proposed on the right axis ................................................................................................................................. 135 Figure 5.5: DNA bundle stiffness variation under a set of 4 irradiations in DI water: Experiment 2. ............................................................................................................................................. 136 Figure 5.6: DNA irradiation in HNO3 a. Set of Three irradiation. b. Zoom on this irradiation, just to show the different irradiations effect on the stiffness. ................................................ 137 Figure 5.7: DNA irradiation inside Tris HCl buffer. No visible effect on the resonance frequency of the SNT. ............................................................................................................ 139 Figure 5.8: DNA irradiation inside Tris HCl a. DNA elongation (1µm) b. DNA elongation (8.6µm) ................................................................................................................................... 140 Figure 5.9: Comparison of the experiment Figure 5.3with the theoretical model. a. The DNA bundle is composed by M DNA molecule in parallel modeled with a series of visco-elastic dash pots. The confinement brings also a coupling between the molecules that is modeled by viscoelastic components in blue. The DNA breaks are simulated by breaks in the visco-elastic chain of a molecule (black). However, thanks to the lateral couplings, a broken molecule can still support stress. b. Comparison of the DNA bundle stiffness degradation during irradiation between the experiment in Figure 5.3 and the simulation based on the model (a). .............. 143. © 2015 Tous droits réservés.. lilliad.univ-lille.fr.
(18) Thèse de Grégoire Perret, Lille 1, 2015. General introduction and motivation. © 2015 Tous droits réservés.. 2. lilliad.univ-lille.fr.
(19) Thèse de Grégoire Perret, Lille 1, 2015. In the early days of radiotherapy, very little was known about the mechanism of action of ionizing radiation and its side effects, leading to sometimes disastrous effects. The understanding of molecular genetics has made it clear that radiation damages mainly the DNA of cells, mostly causing oxidative damage [1]. However, since nuclear radiations do not distinguish between healthy and tumor cells, the largest improvement of the radiotherapy technology in modern days has concentrated on improving the precision of dose-delivery in space and time, with a comparatively reduced interest in the fundamental understanding of the basic mechanisms of biological radiation damage. Since the refinement of space-time protocols is reaching, or will soon reach, its practical limits, even including sophisticated features such as the real-time following of patient respiration and involuntary movements, the need for a deeper understanding of the direct, molecular-scale correlations between radiation dose and biological damage, becomes urgent. Such an endeavor will open the way to a better efficiency of treatment and a customized, patient-specific radiation treatment. Gas chromatography with ion-selective mass spectrometry [2], high-performance liquid chromatography (HPLC) [3], as well as gel micro electrophoresis (‘Comet’) [4], are among the main experimental tools adopted up to now to study RDD of irradiated DNA at the molecular level. All such methods, however, are based on chemical treatments carried out on DNA after irradiation. Typically, DNA samples are irradiated by a known dose, stored for some time, and subsequently hydrolyzed and derivatized. The resulting solution contains the individual DNA bases, both damaged and undamaged, to be analyzed by one of the above methods. The link between radiation damage and DNA molecular structure, in this case, is very indirect (chemical signatures correlated to the damage are observed) and subject to the variable conditions of subtle shifts in the oxidation paths (differential recombination [5]). Alternative strategies can be found, for example by looking at electrical or mechanical properties of the DNA. Notably, the direct mechanical characterization of DNA is possible. This is traditionally performed by expensive biophysical instruments such as the Atomic Force Microscope [6], Optical Tweezers [7] or Magnetic Tweezers [8]. These instruments are extremely accurate and can achieve single-molecule level detection; nevertheless, they are expensive, bulky and cannot operate in confined areas and harsh environment. Moreover, the radiation damage is a statistical process; therefore the measurement must involve a meaningfully large sample, instead of just one molecule at the time. It is our central hypothesis that to fulfill the needs of mass screening with molecular resolution, DNA manipulation by. © 2015 Tous droits réservés.. 3. lilliad.univ-lille.fr.
(20) Thèse de Grégoire Perret, Lille 1, 2015. means of a tiny, stable, low-cost, easily fabricated device, the technology of Micro Electro Mechanical Systems (MEMS) is an appropriate approach. The aim of this thesis is to evaluate the capability of MEMS-based Silicon Nano tweezers to perform a real-time characterization of DNA damage under a radiotherapy treatment. In short, we will employ a sophisticated nanoscale electromechanical device, the ElectroMechanical Silicon Nanotweezer (SNT) [9], to directly measure the rate of breaking of DNA molecules, placed under a controlled radiation beam. DNA bundles of known sequence, with length in the µm range, will be trapped and held straight in parallel strands between the tips of the SNT device. Such nanoscale vibrating tips can measure with extreme accuracy the elastic modulus and viscosity of the DNA bundle, [10] immersed in physiological water in a sealed microfluidic chamber. During the irradiation, under well-known and fully characterized conditions by means of different machines typical of clinical radiotherapy, the individual DNA strands will break, thus progressively reducing the bundle. Correspondingly, the SNT device will measure the dynamical variation of the mechanical response of the bundle, with a timeconstant characteristic of the type of damage. Experimental results will be eventually compared with a theoretical model of a randomly damaged DNA bundle [11].. Figure 0.1: Real-time mechanical characterization of a DNA bundle under radiotherapy treatment.. © 2015 Tous droits réservés.. 4. lilliad.univ-lille.fr.
(21) Thèse de Grégoire Perret, Lille 1, 2015. This thesis is divided in five chapters. The first chapter synthetically presents the state of the art in radiation damage of DNA, which conducted to consider the Silicon Nano Tweezers as the best candidate to explore the unknown field of the radiotherapy treatment. The second chapter introduces the Silicon Nano Tweezers, and explains its ability to conduct real-time biomechanical characterization of a DNA bundle. The third chapter details the key devices of the surrounding SNT setup, and evaluates its capability to measure the biomechanical characteristic of a DNA bundle in liquid under the harsh electromagnetic environment generated by one of the most advanced radiotherapy machines: the Cyberknife. The fourth chapter explains the original protocol developed for the DNA characterization in liquid by the SNT. Finally, the fifth chapter presents some key results of real-time mechanical characterization of DNA bundles under the ionizing -ray beam of the Cyberknife in several conditions, followed by a discussion based on the theoretical model of a randomly damaged DNA bundle. The last part finally concludes on the capabilities and perspectives offered by Micro-electromechanical technologies, to push the research in radiotherapy and in medicine.. The work described in the following pages was carried out jointly in the laboratories of Laboratory for Integrated Micro-Mechatronics (LIMMS, CNRS UMI 2520), based at the Institute for Industrial Sciences of the University of Tokyo (Komaba), where the candidate spent about 1 full year, to develop the basic technology of the SNT; in the Centre de Lutte Contre le Cancer “Oscar Lambret” of Lille, where all the irradiation sessions took place; and in the Institut d’Electronique, Microelectronique and Nanotechnologie of Lille (IEMN, CNRS UMR 8520), where data analysis and theoretical developments were mostly performed.. © 2015 Tous droits réservés.. 5. lilliad.univ-lille.fr.
(22) Thèse de Grégoire Perret, Lille 1, 2015. State of the Art in Radiotherapy and DNA damage analysis. © 2015 Tous droits réservés.. 6. lilliad.univ-lille.fr.
(23) Thèse de Grégoire Perret, Lille 1, 2015. 1.1. Radiotherapy treatments. 1.1.1. Introduction. Every source used in radiotherapy emits a radiation of particles (electrons, protons, ...) or electromagnetic waves (photons). While propagating in matter, the radiation deposits energy along its path. This deposit is not homogeneous but may show peaks at more or less deep sites in the irradiated volume. When radiation passes through a healthy or tumor tissue, this energy chiefly damages the genetic material (DNA) of the cells, as well as other cell structures (membranes, organelles). Several types of DNA lesions may occur, the worst ones being the so-called double-strand break (DSB) of the DNA double helix. Since the cell repair mechanisms for this defect are much slower and faulty than for any other type of defect, this type of injury leads to errors in the copying of chromosomes, eventually prevents cells from dividing, and leads to cell death. The study of radiation effects at the cellular level is the field of radiobiology. Radiotherapy remains one of the most effective elements in the fight against cancer and is perfectly integrated in existing multidisciplinary therapeutic strategies. For 70% of patients with cancer, radiation therapy is one of the treatments used. Although a local-only treatment can sometimes be sufficient, the radiotherapy treatment is most often associated with surgery and/or chemotherapy. So, as of today radiotherapy is usually required for one or more of the following reasons: . As a stand-alone treatment to cure cancer.. . To shrink a cancer before surgery.. . To reduce the risk of a cancer coming back after surgery.. . To complement chemotherapy.. . To control symptoms and improve quality of life if a cancer is too advanced to cure.. © 2015 Tous droits réservés.. 7. lilliad.univ-lille.fr.
(24) Thèse de Grégoire Perret, Lille 1, 2015. 1.1.2. History. 1.1.2.1 Birth of radiotherapy The end of 19th century was marked by the discovery of new physical phenomena that would have revolutionized the medicine in the next century. In 1895, Wilhelm Conrad Roentgen projected the electrons accelerated by an electric field on a tungsten target in a vacuum tube. A radiation was emitted. Roentgen gave it the name of ‘X-ray’ because of its unknown nature. Radiology was born and radiology services were to be installed in hospitals already in 1897. In 1896, Henri Becquerel reported for the first time a phenomenon later called ‘natural radioactivity’ by Marie Curie and Pierre Curie, who discovered in 1898 the properties of Radium and Polonium. In 1903, they shared the Nobel Prize for this major discovery. Quickly, the medical treatments by X-ray and Radium-radiotherapy knew their early developments. Already by 1900, the Radium radiations were tested to treat many diseases resistant to known therapies. (Not too surprisingly, by about 1910 radioactivity was also considered as a kind of panacea for any medical disease, by many charlatans and quack doctors.) Early in the 20th century, Marie Curie was convinced that X-rays and radiation of radioactive substances could cure cancer. But to prove it, there was need for researchers, hospitals and money. With Dr. Claudius Regaud, they managed to gain the support of the University of Paris, the Institut Pasteur and many donators, to create a foundation for this purpose. This initiative originated the Institut Curie, which can be considered the birthplace of radiotherapy in the world. Since then, much progress has been made to optimize the effectiveness of radiation therapy while minimizing its side effects. 1.1.2.2 From Cobalt to particle accelerator Very powerful sources of Cobalt-60 could be manufactured by the end of WWII. The “Cobalt revolution” started in 1955, when commercial Cobalt-therapy machines were developed. The sources of Cobalt-60 produce more effective and more penetrating high-energy radiation than radium or X-rays. The spatial definition of the emerging beam is more accurate. With "Cobalt bombs", the maximum dose is not delivered to the surface but some 5 mm below: penetration is much better and the field margins are better defined. Irradiation to the normal tissue is limited. However, Cobalt-therapy machines had the disadvantage that the beam energy is fixed to relatively low values of 1.17-1.33 MeV; moreover, the natural radioactive decay of the isotope 60. Co makes it necessary to replace the source, about every four years, with attending problems. of nuclear waste disposal. In the late 60s, a new step was reached with the introduction of linear particle accelerators (electrons, protons, etc.). These high-energy radiation generators are more efficient and flexible. © 2015 Tous droits réservés.. 8. lilliad.univ-lille.fr.
(25) Thèse de Grégoire Perret, Lille 1, 2015. than radioisotopes. The radiation beams obtained are extremely fine, which makes it possible to orient and focus them with great accuracy. The risk of material activation and radioactive waste disposal is much reduced. The most common such machines are electron accelerators. When used directly in external irradiation, the electron beam is absorbed in the first centimeters of tissue, before being completely stopped, depending on its energy. These limits can be precisely chosen by the user. However, electron accelerators allow also generating further irradiation by passing first thorough a heavy target (Tungsten, Copper, Gold…), which in turn emits X or γ rays, whose energy is deposited more deeply in the tissues. By combining photon beams from different directions, the dose can be maximized at any desired depth down to about 15cm, while sparing most superficial tissues. The contours of these beams can be defined with greater precision, and enable compliance with healthy organs surrounding the tumor. 1.1.3. State of art in radiotherapy. Today, radiation therapy is often associated with surgery or chemotherapy so as to obtain optimum results. It can be performed prior to surgery, to reduce tumor size, or after, to remove residual tumor cells, thus reducing the risks of recurrence. It can be administered externally or internally. Radiation therapists have many techniques from which they may select the best for each tumor. The linear accelerator is generally preferred to all other in case of deep cancer; Cobalt-therapy machines (Gamma-knife) are still used in some cases, for the treatment of breast cancer and for specific locations in ear-nose-throat (ENT) cancers, but they are increasingly being replaced by small accelerators, more adaptable and efficient. 1.1.3.1 Medical imaging Imaging by such tools as the X-ray tomographic scanner (CT Scan), and magnetic resonance (MRI), have greatly improved the treatment of tumors. The CTScan, in particular, plays a key role in tumor diagnosis. It has become an indispensable examination tool of the pre-therapeutic assessment, since it allows to accurately determining the volume, expansion and relations of the tumor with the surrounding healthy tissue. On each of the graphical sections obtained from the scanner, the radiation oncologist delineates tumor and healthy organs. Nowadays, this crucial step remains largely manual because of the limitations of automatic recognition programs. Radiotherapists establish the 3-dimensional volume of the tumor and surrounding organs. From this reconstruction, a "virtual patient", they determine for each case the irradiation volume at the millimeter scale, seeking the best compromise between efficiency and potential toxicity. Margins are then added to this volume. © 2015 Tous droits réservés.. 9. lilliad.univ-lille.fr.
(26) Thèse de Grégoire Perret, Lille 1, 2015. to take into account cancer cells that are not visible on the image, and the movements of the tumor volume due to breathing and a potential different positioning of the patient during successive sessions. Radiation therapists are thus forced to increase the volume of irradiation, thereby exposing a higher proportion of healthy tissue to irradiation. 1.1.3.2 Sophisticated particles accelerators Radiotherapy machines have undergone many changes over the years. Today multiple separate radiation beams produced by the same machine are commonly used. The head of the particle accelerator rotates around the patient, stopping in the position pre-established for delivering in each case a part of the irradiation (see the Cyberknife). The cumulative action of these beams produces a homogeneous dose even in a volume with a complex shape. The concurrent use of a plurality of beams can increase the effectiveness of radiation therapy to the tumor, while limiting the effects in healthy tissues. Taken separately, the micro-beams do not have sufficient energy to cause tissue damage but their combined action allows the maximum damage to the cells. Therefore, the energy and direction of the beams are determined to localize their concurrent action on the tumor. At this stage, computer simulation is essential to allow the physician to quickly specify certain parameters. On modern linear accelerators a collimator, a variable aperture that can deliver radiation for a variable time, delimits each beam. Modern “multi-leaf” collimators can be composed of 80 to 120 metal leaves, each independently set in motion by a micro-motor, itself controlled by a computer. The quality of the positioning is checked with X-ray films of high sensitivity, as well as by "imaging beam" systems. By releasing the radiotherapist from the constraints of building heavy lead masks for each different treatment, these collimators enabled the development of the “conformal” irradiation. Conformal radiotherapy in 3D is an important step in the evolution of radiotherapy since it allows a better adaptation of the beam to the tumor volume and limiting the exposure of healthy organs. The irradiation volume being better defined, the dose can be increase, and thereby increasing the efficacy of radiotherapy. 1.1.3.3 Enhanced dosimetry The dose is the amount of energy deposited by the radiation in a given volume of tissue. It is expressed in Gray (1 Gy=1 J/kg), and its accurate measurement is the field of the dosimetry. The success of a radiation therapy depends on the accuracy with which the radiation dose is delivered to the tumor: a dose 5-10% lower than the optimum dosage may produce an incomplete removal of the tumor cells, and possibly a recurrence. By contrast, a too large dose,. © 2015 Tous droits réservés.. 10. lilliad.univ-lille.fr.
(27) Thèse de Grégoire Perret, Lille 1, 2015. only 5-10% above prescribed, can lead to severe complications. The dose must also be perfectly homogeneous within each single beam: variations should not exceed ±3%. The radiotherapist plans the total dose, fractionation (number of sessions) and spreading (total treatment time), whose delivery to the patient is then assured by a medical physicist. Several factors are involved in dose planning. The dose depends on the age of the patient, his health status, the location and nature of the tumor. Not all tumors respond to radiations in the same way; they may be more or less radiosensitive. The average dose per session is generally between 1.8 Gy and 2.5 Gy. The technique of splitting the radiation dose over several weekly sessions and spread them over several weeks (generally 6 to 8 weeks) allows healthy tissue to restore. The calculation of the dose distribution in 3D in the tumor and the body requires sophisticated computer programs, a long and demanding process. 1.1.4. Side effects. Side effects occurring during treatment are mainly due to the irradiation of healthy tissue. They depend on individual sensitivity of patients and the irradiated area. They appear in a delayed manner, usually from the 3rd or 4th week treatment, and can persist up to a month after the last one. The most common are skin reactions similar to sunburn, fatigue, nausea. Other specific effects of the irradiated part of the body may occur: vomiting and lack of appetite in case of abdominal radiation, hair loss in case of irradiation in the brain, for dry mouth and throat cancers language. All of these effects are transient and disappear gradually. But, in the longer term (several years), other effects such as tissue fibrosis, telangiectasia (purple spots) may appear, and in some cases, a secondary cancer may develop. One of the major challenges is to limit these phenomena. The main strategy up to now is to better define the tumor area, to better target the radiation level in the region, and to choose the most appropriate dose.. 1.1.5. Conclusion. Radiotherapy has experienced in recent years much progress: The advent of 3D conformal radiotherapy, targeted, preserving at maximum the body and with fewer side effects. The modulated intensity is now possible to propose a treatment truly "sculpted" to the shape of the tumor and also the respiratory-gated radiotherapy developed recently. The irradiation volume is better defined and surrounding healthy tissue is better preserved.. © 2015 Tous droits réservés.. 11. lilliad.univ-lille.fr.
(28) Thèse de Grégoire Perret, Lille 1, 2015. With further research in physics, radiobiology and imaging, radiation therapy may in the future be optimized and personalized for each patient. Genomics is widely expected to participate in the growth of this radiation "custom" adapted to the tumor, but also to the radiation sensitivity of patients. This step is also closely associated with the parallel development of DNA chips, which will allow establishing the genetic profile of tumors. However, a necessary preliminary step should include a test assessing the individual response to radiation. Only then it will be possible to speak of "customized treatment". In this thesis, the Silicon Nano Tweezers is introduced as a new method for the direct characterization of the DNA response to radiation. Coupled with a microfluidic system, the DNA may be immerged in any kind of medium, to mimic the patient cell, or to test the role of drugs such as radiosensitizers.. 1.2. Ionizing radiation interactions with DNA. 1.2.1. Introduction. As described in the previous Section 1.1, a radiotherapy treatment is based on the irradiation of a tumor with ionizing radiations. This section gives a synthetic summary of the radiation interactions with matter, and more specifically with DNA. 1.2.2. Sources of ionizing radiation. The radioactive decay of an unstable nuclide, either natural or artificially produced, is a process that is initiated by the emission of an α or a β particle, and produces a variety of secondary consequences, specifically the emission of -rays, as well as that of further α and β. This chain of subsequent emission of secondary radiations occurs because the unstable nuclide turns into a daughter nucleus that that may be in an excited state; de-excitation takes the daughter nucleus to lower energy states, down to its ground state, and the corresponding energy is emitted in form of rays, as well as further radioactive (α and β) decays, which in turn give origin to another daughter nucleus and so on, until a stable ground state is reached (see example in Figure 1.1). The de-excitation of excited nuclear levels by emission of electromagnetic energy in the form of -rays parallels that observed in atomic electrons, whereby the shift to lower atomic levels produces instead visible light quanta.. © 2015 Tous droits réservés.. 12. lilliad.univ-lille.fr.
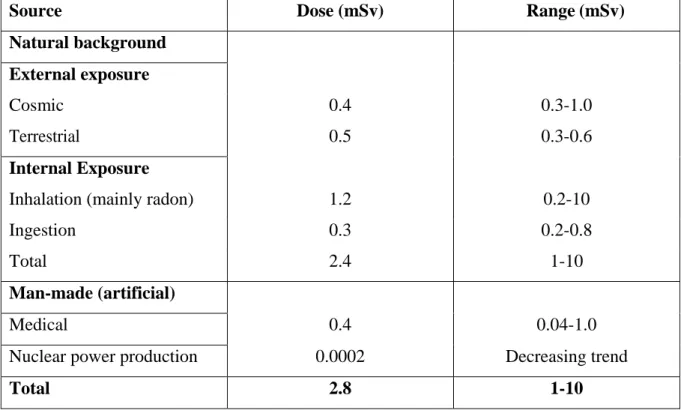
(29) Thèse de Grégoire Perret, Lille 1, 2015. Figure 1.1: Example of a radioactive decay sequence. The principal decay modes are indicated by thick lines; minority modes by dashed lines. Gamma and internal conversion electrons in black, - decay in blue. Right branch: the metastable nuclide 99mTc decays with high efficiency from its level at 143 keV to 141 keV by internal conversion, then a principal gamma ray of 141 keV is emitted, going to the 99Tc ground state. From here, radioactive - decay of 294 keV gives the 99Ru stable nuclide. A minor path includes emission of 143 keV , and - decay to the 90 keV excited state of 99Ru. Left branch: with small probability, Tc99m can undergo - decay to an excited state at +322 keV of 99Ru; hence, a 322 keV -ray can take to ground state, or an intermediate 294 keV to a lower excited state; from here, a 90 keV or internal conversion electron takes 99Ru to the ground state.. Natural radiation from radioactive nuclides, cosmic rays and solar radiation, is a permanent feature of the natural environment. Therefore living organisms are constantly being exposed to such radiation. Human activity, such as medical practices, radioisotopes in health care, as well as commercial and industrial practices, such as the production of electricity in nuclear reactors and other nuclear techniques, as well as military applications as exemplified by weapons testing, represent important secondary sources of exposure to radiation. Despite the human activity, natural sources are the prevalent cause of irradiation; including cosmic rays and radionuclides present in the Earth’s crust, in the food, water and air we ingest, as well as in the human body itself, accounts for 90% of human exposure to radiation. This separation of radiation into human and man-made sources (Table 1.1) highlights the constant exposure faced by man to radiation. This may be compared to the dose delivered in a medical framework and specifically during radiotherapy treatment.. © 2015 Tous droits réservés.. 13. lilliad.univ-lille.fr.
(30) Thèse de Grégoire Perret, Lille 1, 2015. Table 1.1 Average annual affective dose of ionizing radiation to individuals (in 2000) Source. Dose (mSv). Range (mSv). Natural background External exposure Cosmic. 0.4. 0.3-1.0. Terrestrial. 0.5. 0.3-0.6. Inhalation (mainly radon). 1.2. 0.2-10. Ingestion. 0.3. 0.2-0.8. Total. 2.4. 1-10. 0.4. 0.04-1.0. 0.0002. Decreasing trend. 2.8. 1-10. Internal Exposure. Man-made (artificial) Medical Nuclear power production Total. 1.2.3. Radiation beams from particle accelerators. Since the early days of radiotherapy, the technology of artificial sources was aimed towards ever-higher photon and electron beam energies and intensities. During the first 50 years of radiotherapy the technological progress was relatively slow and mainly based on X-ray tubes, (electrostatic) van de Graaf generators, and magnetic-field betatrons. The development in the ‘50s of linear electron accelerators (medical LINACs), already introduced in the 1930s’ aside of the first circular accelerators, moved to increasingly sophisticated machines and became the most widely used radiation source in modern radiotherapy. With its compact and efficient design, the LINAC offers excellent versatility for use in radiotherapy and provides either electrons, or megavoltage X-ray therapy, with a wide range of energies. In addition to LINACS, electron and X ray radiotherapy is also carried out with other types of accelerator, such as betatrons and microtrons. More exotic particle beams, such as protons, neutrons, heavy ions, and negative mesons, all produced by special accelerators, are also sometimes used for radiotherapy. Clinical X-ray beams typically range in energy between 10 kV and 50 MV, and are produced when electrons with kinetic energies between 10 keV and 50 MeV are suddenly decelerated by. © 2015 Tous droits réservés.. 14. lilliad.univ-lille.fr.
(31) Thèse de Grégoire Perret, Lille 1, 2015. hitting special metallic targets. Most of the electron kinetic energy is transformed in the target into heat, but a small fraction of the energy is emitted in the form of X-ray photons, characteristic X-rays from the target metal, and bremsstrahlung X-rays (from the German word meaning ‘radiation from deceleration’). These latter are the most important component, and result from Coulomb interactions between the incident electron and the nuclei of the target material: the incident electron is suddenly decelerated, and loses part of its kinetic energy by irradiating an amount P of electromagnetic power, a situation well approximated by the physics of relativistic dipole emission: Equation 1.1 𝑒 2 𝑎2 𝛾 6 𝑃= 6𝜋𝜖0 𝑐 2 with e=1.6x10⁻¹⁹ C the electron charge, a the deceleration equal to v/t for a typical collision time t ~10-14 s, and =(1-v2/c2)-1/2 the relativistic mass factor (the particle mass according to the theory of relativity increases as m for a velocity v). This basic principle is applied both in the older X-ray tubes, in which the fast electron beam was produced by a hot filament and a series of accelerating grids (pretty much like in a thermionic valve or a cathode ray tube of old TVs), as well as in modern linear electron accelerators, in which the electron beam is created by injecting an electron current in a complex combination of alternating electric fields and electromagnetic resonant cavities. No matter how the primary electron beam is generated, after hitting on a heavy-Z target (Tungsten, Copper, Gold, etc) it is subsequently converted into an intense beam of bremsstrahlung photons, with an energy spectral distribution of the type shown in Figure 1.2.a. The photon spectrum is continuous, extending from some Emin fixed by the plasma frequency of the target metal, to the maximum electron energy Emax, with a maximum of intensity peaked roughly at about Emax/25 (keV). If the maximum electron energy allows it, also characteristic X-ray lines can appear superposed to the continuous spectrum, resulting from the direct collisions of projectile electrons with atomic electrons. The angular distribution of the emitted photon beam is rather isotropic at the lowest electron beam energy, and becomes increasingly forward peaked as the initial electron energy is increased. As shown in Figure 1.2.b, already for Emax=500 keV, the photon beam is strongly forward peaked. At the typical beam energies of a medical CLINAC, Emax=5-20 MeV, the photon beam is sharply directed in the forward direction with a minimal lateral dispersion.. © 2015 Tous droits réservés.. 15. lilliad.univ-lille.fr.
(32) Thèse de Grégoire Perret, Lille 1, 2015. Figure 1.2: a. the spectrum of photon radiation emitted by a monochromatic beam of electrons with energies of 80 to 140 keV. The maximum energy of each bremsstrahlung spectrum ends at the electron energy. Note the characteristic X-ray lines of the Tungsten target at 59 and 67 keV. b. angular curves of isointensity of the emitted photon beam from electrons of 100 and 500 keV on a W target.. 1.2.4. Types of ionizing radiations. In order of increasing frequency and decreasing wavelength, the electromagnetic spectrum spans radio waves, microwaves, visible light, ultraviolet light, X-rays and -rays (Figure 1.3). According to the quantum theory of radiation, the energy E of the electromagnetic wave is connected to its frequency ν and wavelength λ by Planck’s equation: Equation 1.2 𝐸 = ℎ𝜈 =. ℎ𝑐 𝜆. where h=6.62x10⁻³⁴ J s, is Planck’s constant. The wave velocity is c = λν, equal to the speed of light in vacuum c=3x10⁸ m/s. The idea that radiation is quantized, despite having a continuous spectrum of allowed energies, defines the concept of photon, the equivalent of an ideal monochromatic wavepacket. Quantum theory predicts that photons of any wavelength also demonstrate particle-like behavior, and carry a wavevector k=p(2/h) associated to the relativistic momentum p of a massless particle. However it is only at the highest frequencies, and smaller wavelengths, when the radiation energy is comparable to the energy levels of atoms and molecules, that such particle-like properties become readily observable. The absorption of electromagnetic photons in matter depends on the energy of the photons and on the absorbing material atomic number Z.. © 2015 Tous droits réservés.. 16. lilliad.univ-lille.fr.
(33) Thèse de Grégoire Perret, Lille 1, 2015. Figure 1.3: Schematic of the electromagnetic spectrum [12]. Low-energy electromagnetic radiation can at most excite vibrations and rotations of molecules (infrared frequencies). Low-energy, or non-ionizing, wavelengths are commonly understood to have minimal effects on biological and chemical structures, and are therefore considered harmless, outside the effect caused by heating, in biological tissue. Most of the technological objects we use in everyday life, including cellphones, microwaves, and radio transmitters make use of the lower energy-wavelengths of the electromagnetic spectrum. This being said, it is important to note that continuing research varies at the exact line of demarcation between ionizing and non-ionizing radiation, considering that certain molecules require very little energy to be ionized and can therefore wavelengths such as UV can sometimes create affects similar to X and -rays. At the highest end of the spectrum, X and -ray photons possess sufficient energy to cause atoms through which they pass to eject an electron from its orbit. This capacity to break apart electrons from the orbit of atoms is the process of ionization. Typical binding energies of orbital electrons are in the range of tens of eV (1 eV=1.6x10⁻¹⁹ J). Therefore, a photon energy of at least the same order or higher is necessary, corresponding to frequencies ν=E/h > 1015 s-1 and wavelengths λ=c/ν < 10-7 m, or 1000 Ångstroms (visible light). Photons of even higher energies, such as X-rays (E ~ 0.1-100 keV, λ ~ 1-100 Å, ν ~ 1016-1018 s-1) and -rays (E > 100 keV, λ < 1 Å, ν > 1019 s-1) can produce many such events of ionization, giving off some fraction of their energy at each ionization event. As a rough estimate, a 1 MeV -ray in water can produce about 30,000 ion pairs over a path length of about 10 cm.. © 2015 Tous droits réservés.. 17. lilliad.univ-lille.fr.
(34) Thèse de Grégoire Perret, Lille 1, 2015. When an atom is ionized, the loss of one of its electrons leaves behind a charged atom, the ensemble being understood as an ion pair (a negative electron and a positively charged ion). Ions traveling in the material can interact with other species, and if not recombined with negative charge, can produce highly reactive free radicals. For example, one ionized water molecule H2O+ can interact with a normal water molecule, and give H2O+ + H2O H3O+ + OH*. The hydronium ion (H3O+) would be normally present in water at neutral pH, because of dissociation equilibrium. The OH*, however, is not normally found in water, and is called a free radical. This is a special molecule that is not ionic (it has zero charge), however it has one unpaired electron, indicated by the ‘*’. This unpaired electron represents a danger for other chemical species, in that the free radical seeks to attach to any other electron receptor species, typically acids. And, remember, DNA is ‘deoxyribonucleic acid’. Attachment of a free radical to DNA is indeed at the origin of the most severe damages. Direct ionization is among the many effects electromagnetic radiation can have when passing through matter. In the range of energies typically used for radiotherapy and imaging applications (from a few keV to some tens of MeV), photons passing through matter transfer their energy to target atoms and molecules through the following three main processes: photoelectric absorption, Compton scattering, and pair production, as shown in Figure 1.4.. Figure 1.4: Dominant types of interactions as a function of the atomic number Z of the absorber and the energy of the photon radiation [13]. © 2015 Tous droits réservés.. 18. lilliad.univ-lille.fr.
Figure
![Figure 1.4: Dominant types of interactions as a function of the atomic number Z of the absorber and the energy of the photon radiation [13]](https://thumb-eu.123doks.com/thumbv2/123doknet/3741119.112526/34.893.200.699.715.1028/figure-dominant-interactions-function-atomic-number-absorber-radiation.webp)
+7
![Figure 1.14: Principle of the 32 P post-labelling [33]](https://thumb-eu.123doks.com/thumbv2/123doknet/3741119.112526/51.893.239.657.613.983/figure-principle-p-post-labelling.webp)
![Figure 1.16: Schematic diagram of GC/MS [47]](https://thumb-eu.123doks.com/thumbv2/123doknet/3741119.112526/53.893.114.783.510.808/figure-schematic-diagram-of-gc-ms.webp)
Documents relatifs