ISMRE2018/XXXX- ALGERIA
Design and implementation of Arduino based
system for temperature and current monitoring with
data logging
stMOHREM Abdelkrim
ndCHETATE Boukhemis,
rdGUIA Houssem Eddine
Research Laboratory on the Electrification of Industrial Enterprises University M’Hamed Bougara Boumerdes Algeria.
mohrem.abdelkrim@gmail.com Abstract— Measurement and monitoring of temperature
and electrical current is an important and vital task in different industrial electrical equipment. This paper presents an Arduino-based real time temperature and electrical current of three-phase monitoring system with logger. For temperature measurement LM35 sensor is used, for electrical current three ACS712 current sensor modules are used. An SD memory card is used for local data logging to store the measured values with time and date stamp by using of DS1307 real time clock module. An alphanumeric LCD module is used for online monitoring of time, date and the measured values. The proposed system is first simulated using Proteus ISIS and then implemented using the real components. The result shows that the entire system works and can be used for teaching or statistical purpose by the help of logger, research laboratories and in industrial applications as well. The cost of the hardware encourages the use and may be the commercialization of the proposed system.
Keywords— Arduino, current sensor, temperature sensor LM35, DS1307, data logger.
I. INTRODUCTION
As everyone knows that electrical equipment is widely used in industry, factories, and research laboratories, such as: electrical motors, motor-drives, switching-mode power supply and many types of breakers. It is well known that the electrical current flowing through this equipment can effect on their temperature, to this point temperature becomes critical parameter. It needs continuous real-time measurement round the clock as its deviation from the safe margin can be even harmful. For study or analysis purposes there is a need of device that measures the electrical current, the temperature and then records the measured values. At this end three instruments can be used: thermometer, ammeter and data logger for recording the measured values.
In other hand, the design and developing of an instrument of measure becomes easier for the engineers because of the availability of different hardware in the market such as sensors, digital signal processors, microprocessors and microcontrollers. Today, Arduino board becomes very famous and widely used by the engineers and hobbyists because of the simplicity of handling by software, low cost and, the availability of different peripherals that can be interfaced with such board.
This paper deals with design methodology of Arduino based temperature and electrical current measurement system having LM35 and current sensors, DS1307 real time clock module, LCD module and SD card with module for data logging purposes. Explaining hardware designs of the
proposed system and, the implementations of software in a structured way.
II. DESCRIPTION OF THE PROPOSED SYSTEM
A. Overview of the proposed systm
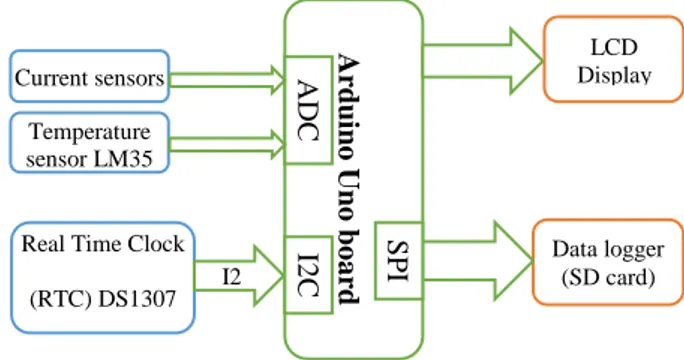
The entire system was designed to sense the current of an electrical equipment using ACS712 hall effect current sensors, and LM35 temperature sensor. The sensed values are analog then sent to the ADC channels of Arduino and converted to digital values, at the same time Arduino receives data from a real time clock (RTC) DS1307 through I2C communication protocol, these data contain the current date and time. All the data generated by ACS712, LM35 and DS1307 is considered as inputs, a firmware developed and implemented on Arduino to handle these data, performing the necessary processing and calculations. As outputs of the proposed system an LCD module is used to display the date, time and the measured electrical current of each phase and the temperature value in Celsius, for data logging, an SD card with reader module is interfaced with Arduino through ISP communication protocol. Generally the block diagram of the whole system is presented in Fig. , when the system turned on, automatically measures continuously the current, the temperature and displays them in the LCD with the time and date and, generates file containing a list of measured value. This file could be open using MS Excel for offline exploitation purposes.
In the following section the used module of the system is explained in details: Arduino, LM35, ACS712, DS1307, SD card and LCD module.
Fig. Block diagram of the proposed system.
B. Arduino
Arduino is Atmega328P microcontroller based Board with 8 bit. It contains 1KB of EEPROM memory and 2KB of static RAM memory. It has a 16 MHz quartz crystal oscillator. There are 14 digital input/output pins present in
Ard u in o Uno bo a rd ADC Display LCD
Real Time Clock (RTC) DS1307 Current sensors Data logger (SD card) I2 C Temperature sensor LM35 I2 C SPI
Arduino Uno board. Among these 14 pins there are PWM pins as well as 6 analog input pins . Power supplying of Arduino Uno can be performed by USB cable connection or by using an external power supply, the recommended supplying voltage ranges between V to 12V . Arduino Uno board as shown in Fig. 2 is considered as model of reference for all next future developing Arduino boards.
Fig. Arduino Uno board.
C. Temperature sensor module
There are different temperature sensors available in the market; the LM35 IC is used in the proposed system. LM35 has higher precision and wider range of linear working and, it does not require any external calibration or compensation . The output voltage of LM35 is linearly proportional to the temperature in Celsius . This sensor can be an optimum choice for an economical project and, effective for temperature measurement. The pin layout of LM35 is shown in Fig . The equivalent millivolt output is connected to analog to digital converter (ADC) pin of Arduino board. The ADC is programmed to convert the input analog voltage to a corresponding digital value.
Fig. LM35 temperature sensor.
D. Electrical current sensor
In this system three Hall-Effect current sensors (ACS712) are used to sense the current flowing through the electrical equipment. The Hall Effect sensor consists of a magnet, live wire used to connect the appliance is passed through the magnet. When an electrical equipment is powered on, due to the current flowing in the wire, there is a magnetic induction due to which a small voltage is generated at the other end of the sensor .This kind of sensor consists of three pins. The output of the sensor is obtained in Vout pin
. ACS712 current sensors are offered with full scale values of 5A, 20A and 30A. The scale factor is 185 mV per Amp, 100 mV per Amp, 66 mV per Amp for 5A, 20A and 30A successively. In this system 20A rated module is used as shown in Fig. 4.
Fig. Hall-Effect current sensor module ASC712.
E. Real time clock module
To keep trucking of accurate current time a DS1307 serial real-time-clock module is used as shown in Fig. 5. This operation can be performed by Arduino but, using a separate module relives the processing unit for time critical tasks and, because of its low power consumption. The DS1307 is full binary coded decimal (BCD) clock/calendar. The address and data are serially transferred through an I2C communication protocol . It provides seconds, minutes, hours, day, date, month and year information. The end of the month date is automatically adjusted for months with fewer than 31 days, including corrections for leap year. The clock operates in either 24-hour or 12-hour format with AM/PM indicator. The DS1307 has a built-in power-sense circuit that detects power failures and automatically switches to back-up supply .
Fig. Real time clock module based on DS1307.
F. SD card reader module
In order to store and log data generated by the proposed system, an SD card is used in this system. Internal storage of Arduino can be also used but, it has limited storage space. However, because an Arduino does not have a location to mount an SD card, SPI pins are used to interface the SD card module as shown in Fig. This module is used to record Day, month, year, hour, minute, second, temperature and current of each phase in an SD card.
Fig. SD card reader module.
G. LCD module
The system uses LCD module as shown in Fig. 6, for local real-time displaying. The module has onboard display controller, which relieves the main microcontroller from manually generating character display. The display unit is composed of dot matrix, it can display 20 alphanumeric characters per line and there are 4 such lines. The LCD is configured in 4-bit mode with read-write control. This configuration requires less number of input/output pins of Arduino, typically six pins only [
III. PROPOSED ALGORITHM
The algorithm of the proposed system is programmed with Integrated Development Environment (IDE) platform (Fig. 7) which is open source software used with Arduino boards. Generally the program code is termed Arduino sketch. Functionalities are placed in the library files and when needed, it must be used in the program, the name of its file header should be included in the program with the preprocessor directive include.
Fig. 7. Arduino IDE screenshot.
Fig. . Flowchart program of the proposed system
Fig. shows a flow chart used for the proposed system, it starts to initialize the different modules ( LCD, DS1307, and SD card) then, testing the SD card if exists or not, reading digital values from the ADC channels, reading the real time module then converting the digital values to readable values on the LCD unit. For data logging, create a Coma Separated Values file (log.csv) then send the displayed values to the said file every preprogrammed period of time. It has been noted that float variables are used for temperature and electrical current, this mode is useful for displaying real numbers. The saved data can be further used by MS excel for data analysis.
A. program for temperature sensor
For a controller with ADC of 10 bit resolution, the value can be represented from 0 to 1023. In order to compute the output of temperature sensor, a calibration must be done. The temperature calibration is obtained by the equation (1),
( ) Here:
T_sensor is the value obtained from the temperature
sensor LM35.
5 is the supply voltage of Arduino board and used for ADC voltage reference.
1000 is used to convert the unit from Volt to millivolt. Now each 10 mV is directly proportional to 1 Celsius.
B. program for current sensor
The current values are obtained from A0, A1 and A2 channels of Arduino in digital form, these values is ranging between 0 to 1023 corresponding 0V to 5V, in order to convert the digital from to real values, calibration must be set as in the equation ( .
read voltage is the value obtained from the ACS712
current sensor.
rating is the necessary calculation needed to convert
voltage to a real current value.
IV. RESULTS AND DISCUSSION
After preparing all the necessary parts, a simulation of the whole system is performed using Proteus ISIS 8.1, which is good software that offers a variety range of microcontrollers, electrical, electronic and other connecting components, Fig. 8 shows Proteus ISIS simulation scheme of the proposed system. It must be noted that the proposed system can measure both of DC and AC currents due to the feature provided by the ACS712 sensor and the algorithm used in firmware.
Different tests have been performed to verify the functionality of the proposed system by mean of the features provided with Proteus ISIS software. Temperature variation, current variation, type of loads, DC current and AC currents. Also the logging functionality has been verified by reading the SD card and observing the contents of saved CSV file. Table I. shows the input of LM32 and its output in millivolt and the measured value by Arduino board. It is clear that the measured temperature values are exactly as the real values,
this because of 10-bit resolution of Arduino analog-to-digital- converter (ADC). Since the minimum voltage between two levels that can be sensed by Arduino ADC is 4.88 mV. Hence, the output of the LM35 is DC analog value, providing 10mV per 1° Celsius; this is enough for such measurement.
Fig. 8. Proteus ISIS simulation scheme of the proposed system. TABLE I. TEMPERATURE TEST, OBTAINED QUANTITIES
FROM LM AND DISPLAYED VALUES ON LCD Real temperature value (Celsius) Output voltage of LM35 sensor (mV) Measured temperature value (Celsius)
TABLE II. CURRENT TEST, OBTAINED QUANTITIES FROM ACS AND DISPLAYED VALUES ON LCD
Measured current by Ammeter Output voltage of ACS712 without offset (mV) Measured current by the system Error abs %
Table II. shows elictrical current tests with diferent values measured by Ammeter and the output voltage provided by the sensor ACS712 measured in mV and the displayed values on LCD. It is clear that the error of measurement is less than 0.4 percent. The error of measurement is coming
by two factors or sources, the first one is ADC resoulution as mentioned before, the minimum values is 4.88mV and, ACS712 output is 100mV per 1Ampere this means that the minimum current that can be measured by the system is the minimum voltage between two ADC levels 4.88mV multiplied by the sensor ratio 0.01 that is 0.0488 Ampere. The second source of the error is output voltage of ACS712 which can deviate a little bit from its function.
Fig. Log.CSV file content in case of logging data per 1 second when opened by MS-Exel.
Whent the system is powered on,and when an SD card is mounted, it automatically generates the log.csv file, it can be opened using MS-Excel as the screenshot represented in Fig. 9. In this file the data are logged every 1 second. It is clear that this can be used for tracking or studying the behaviour of an elictrical equipment, also it can be used for further analysis or statistical purposes.
Fig. Curve of temperature vs the time using log file.
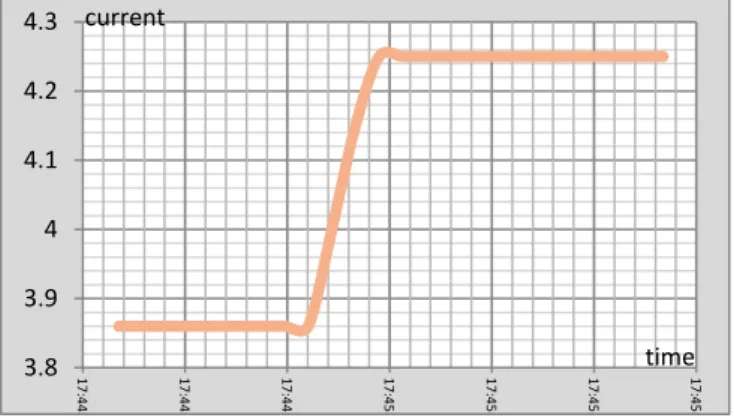
Using the data provided by this file, we can be simply draw any curve of temperature or electrical current of any phase vs a precised period of time . The Fig. 10. Shows the curve of temperature variaton vs time using the MS-Excel features. In Fig. 11. also representation of curve of electrical current variation
0 10 20 30 40 50 60 17:44:48 17:44:53 17:44:57 17:45:01 17:45:06 17:45:10 17:45:14 time temperature
of phase 1, this can be useful for quick look taking of behaviour of electrical system or equipment.
Fig. . Curve of electrical current phase 1 vs time using log file.
A prototype of the proposed system has been realised as shown in Fig. 11.
Fig. Prototype of the proposed system. TABLE III. COMPONENTS AND DETAIL PRICES OF THE PROPOSED
SYSTEM.
Component Quantity Unit price ($) Price ($) Arduino Uno DS1307 module LM35 module ACS712 module SD Card module Dupont connectors
Table III shows the elements prices and the total price of the prototype of the proposed system. The whole system price is doesn’t exceed $ which is very cheap comparing to its provided features.
V. CONCLUSION
In this paper we designed and implemented an Arduino-based embedded system for the measurement of three phase electrical current and temperature with data logging feature. Different modules have been used for sensing, time keeping, data displaying and data recording. The whole system is first simulated using Proteus ISIS software and then realized. The obtained results have been compared with standard results and proved its suitability for real time applications. The developed system can be implemented for teaching purposes, research laboratories and in industrial applications as well. The total cost of this developed system is around $ which makes it affordable and it can be commercialized.
REFERENCES
Souvik C, Sagnik C, Rajarshi G. Arduino Based Real-Time Wireless Temperature Measurement System with GSM Based Annunciation. In: International Conference on Communication and Signal Processing, April 6- , pp. – .
Anif J, Louis S, Agus S, et al. Design Real Time Battery Monitoring System Using LabVIEW Interface For Arduino. In: International Conference on Rural Information & Communication Technology and Electric-Vehicle Technology, November 26- .
Khizir M, Md. Shamsul A, Rakesh G. Design of Digital Thermometer Based on PIC16F77A Single Chip Microcontroller. In: International Conference on Consumer Electronics, Communications and Networks, November - , pp. – .
Prathiba J, Sadulla S. Wireless Solution for Polyhouse Cultivation Using Embedded System. In: International Conference on Renewable Energy and Sustainable Energy, December - , pp. – . Nitin S, Korrapati E, John S. Xively Based Sensing and Monitoring
System for IoT. In: International Conference on Computer Communication and Informatics, January -
Kader M, AlMansur A, Moinuddin M et al. Bengali character based digital clock using 8X8 dot matrix display. In: International Conference on Electrical Engineering and Information & Communication Technology, May -
Ibrahim A, Tariq I. Design and Implementation of a Low Cost Web Server Using ESP32 for Real-Time Photovoltaic System Monitoring. In: IEEE Electrical Power and Energy Conference, October - .
Nhivekar G.S, Mudholker R. Data Logger And Remote Monitoring System For Multiple Parameter Measurement Applications. e -Journal of Science & Technology. 55– .
Nhivekar G.S, Mudholker R. Data Logger And Remote Monitoring System For Multiple Parameter Measurement Applications. e -Journal of Science & Technology. 55– .
Total price 3.8 3.9 4 4.1 4.2 4.3 1 7 :4 4 :4 8 1 7 :4 4 :5 3 1 7 :4 4 :5 7 1 7 :4 5 :0 1 1 7 :4 5 :0 6 1 7 :4 5 :1 0 1 7 :4 5 :1 4 time current