HAL Id: inserm-00405723
https://www.hal.inserm.fr/inserm-00405723
Submitted on 21 Jul 2009HAL is a multi-disciplinary open access archive for the deposit and dissemination of sci-entific research documents, whether they are pub-lished or not. The documents may come from teaching and research institutions in France or abroad, or from public or private research centers.
L’archive ouverte pluridisciplinaire HAL, est destinée au dépôt et à la diffusion de documents scientifiques de niveau recherche, publiés ou non, émanant des établissements d’enseignement et de recherche français ou étrangers, des laboratoires publics ou privés.
natural killer receptors in chronic hepatitis B and C.
Paula Bonorino, Muhammad Ramzan, Xavier Camous, Tania
Dufeu-Duchesne, Marie-Ange Thélu, Nathalie Sturm, Aurélie Dariz,
Christiane Guillermet, Martine Pernollet, Jean-Pierre Zarski, et al.
To cite this version:
Paula Bonorino, Muhammad Ramzan, Xavier Camous, Tania Dufeu-Duchesne, Marie-Ange Thélu, et al.. Fine characterization of intrahepatic NK cells expressing natural killer receptors in chronic hepatitis B and C.: NK cells in chronic hepatitis C and hepatitis B. Journal of Hepatology, Elsevier, 2009, 51 (3), pp.458-67. �10.1016/j.jhep.2009.05.030�. �inserm-00405723�
Fine Characterization of Intra-hepatic NK cells Expressing
Natural Killer Receptors in Chronic Hepatitis B and C
Paula Bonorino
1,2*, Muhammad Ramzan
1,2*,
Xavier Camous
1,2, Tania
Dufeu-Duchesne
1,2, Marie-Ange Thélu
1,2, Nathalie Sturm
1,2, Aurélie Dariz
1,2, Christiane
Guillermet
1,2, Martine Pernollet
1,2, Jean-Pierre Zarski
1,2, Patrice N. Marche
1,2, Vincent
Leroy
1,2and Evelyne Jouvin-Marche
1,2.
Addresses:
1
Institut National de la Santé et de la Recherche Médicale (INSERM), Unité 823,
Grenoble, France.
2
Université Joseph Fourier-Grenoble I, Faculté de Médecine, Institut Albert Bonniot,
UMR-U823, Grenoble, France
* PB and MR have contributed equally to this work
Corresponding author: PN MARCHE
Centre de recherche INSERM/UJF U823-Equipe IAPC Institut Albert Bonniot
BP170-38042, Grenoble Cedex 09, France.
Patrice.Marche@ujf-grenoble.fr
Tel: +33 476 54 94 95. Fax: +33 476 54 94 54
Abstract
Background/Aims. The fate of intrahepatic NK cell subsets in the course of HCV and HBV
infections is not clearly understood.
Methods. Blood and intrahepatic CD56
+NK cell subsets (expressing NKG2A, CD158a,h or
CD158b,j receptors) from HCV or HBV patients were quantified by flow cytometry and
localized by immunohistochemistry in liver biopsies.
Results A significant reduction in NK cell frequency and a quantitative imbalance between
CD56
brightand CD56
dimsubsets were observed in chronic HCV patients as compared to HBV
patients, underlining that the inflammatory environment is not the only cause of these
phenomena. The proportions of intra-hepatic NK cells expressing either NKG2A, and/or
CD158a,h, CD158b,j differed significantly between HCV and HBV patients. A higher
frequency of perforin among intra-hepatic CD56
+CD3
-cells was observed in HCV compared
to HBV patients. Double immunohistochemical staining showed that CD56
+CD3
-cells were
localized within necrotic areas. Immune monitoring of circulating CD56 subsets revealed that
CD3
-CD56
brightNKG2A
+and CD3
-CD56
dimNKG2A
+cells were positively correlated with the
necro-inflammatory score and inversely correlated with viral load, respectively, in HCV
patients.
Conclusions. HCV and HBV affect NK cell subsets according to the status of the diseases,
especially CD3
-CD56
dimNKG2A
+and CD3
-CD56
brightNKG2A
+cells, may be of interest for
disease monitoring.
Introduction:
Hepatitis C virus (HCV) and hepatitis B virus (HBV) are preferentially hepatotropic, not directly cytopathic, capable of provoking acute and chronic necro-inflammatory liver injury and are the most common causes of liver disease worldwide [1]
The various strategies that many viruses have evolved to evade natural killer (NK) cell effector functions illustrate the central role for these cells in early host defense against viral infections [2, 3]. It is known that both HCV and HBV, impair human and murine NK cell activity [4, 5]. HCV may inhibit the activation of Interferon Regulatory Factor (IRF) [6] and can interfere with PKR kinase function [7] which can activate NK cells. In the case of HBV, both IRF and PKR appear to mediate signals that modulate viral replication in IRF(-/-) or PKR(-/-)
transgenic mice [8] . In contrast to other viruses, HCV and HBV induce sustained HLA class I expression on infected cells [9, 10]. The inhibitory effect of NK cells on HCV replication in cultured human hepatocytes [11] suggests that NK cells might be able to contribute to the control of these infections. In the early phase of HBV infection, the host's response to HBV mediates the activation of NK cells which produce IFN-α and are able to lyse infected cells by TRAIL-mediated death of hepatocytes [12].
Despite multiple studies on the functional potential of NK cells in persistent HCV and HBV infections [13-15], evidence of a role for NK cell defects in these chronic infections remains open for debate. It is established that NK cell frequencies in HCV-infected patients are lower than those observed in the un-infected population [14-16]. According to the surface expression level of CD56, NK cells can be divided into two subsets with important functional distinctions. The vast majority of NK cells displays a moderate level of CD56 (CD56dim) with a marked cytotoxicity
potential, while, a small proportion harbors a high CD56 expression level (CD56bright) having a
greater capacity to secrete cytokines [17, 18]. Recently, it was reported that the frequency of peripheral blood cytolytic CD56dim NK cells is
decreased in HCV infected patients [15]. Less is known about expression of HLA class I specific NK receptors (NKRs). NKRs are subdivided into two major families. The first family is composed of killer immunoglobulin-like receptors (KIR),
such as CD158 molecules and LIR1/ILT2 (leukocyte Ig-like receptor 1/Ig-like transcript 2) which recognize classical HLA-A, -B and -C class I molecules. The second family includes C type lectin-like molecules, such as, NKG2A that associate with CD94 to form inhibitory heterodimer that recognize non-classical HLA-E molecules. .
Here, we have performed flow cytometry analyses and detailed histological studies on liver biopsies to quantify and localize the CD56+ cells in the different histological
areas. Furthermore we investigated the perforin contents of different NK cells subset as markers of their cytotoxicity. Then, we searched for relationship between NK cells subset distribution and the clinical parameters.
Materials and Methods
Patients.
Chronic hepatitis C (n=28) and B patients (n=19) seen in the Grenoble University Hospital between 2005 and 2007, were included in this study. Their main characteristics were analyzed as previously described [19] and are summarised in Table 1. For immunohistochemical studies, HCV (n=6) and HBV patients (n=6) patients were classed as have low necro-inflammatory grading (Metavir-A1, 3 patients) and high necro-inflammatory grading (Metavir-A3, 3 patients) by the French Metavir Scoring System. Blood samples from healthy volunteers (n=18) were obtained from the regional Etablissement Français du Sang (La Tronche, France).
Isolation of intra-hepatic cells.
Liver biopsies obtained by using 1.5 mm diameter disposable biopsy needle were processed for histopathological examination and immunological analysis. Cells were prepared as described previously [20, 21].
Monoclonal antibodies, Immunostaining and Flow Cytometry.
The monoclonal antibodies used were anti-CD3 PC7 (UCHT1), anti-CD56 PE (NCAM16.2), and anti-Perforin FITC-conjugated (δG9), from Becton-Dickinson Biosciences (Pont de Claix, France). Anti-CD158a,h+-PE (EB6), anti-CD158b1,b2,j-PE (GL183), anti-NKG2A(CD159A)-PE (Z199) were obtained from Beckman Coulter France (Villepinte, France). Immunostaining and flow
cytometric analysis were done as described previously [19, 22].
Table1. Demographic, biochemical and clinical characteristics of chronic HCV and HBV infected patients studied by flow cytometry.
Immunohistochemical Staining.
Single and double CD56/CD3 immunohistochemical staining was performed on an automatic immunostainer (Benchmark XT, Ventana, Tucson, AZ, USA) [19, 22]. Briefly, slides were incubated with a primary anti-CD56 antibody (Clone 1B6 Novacastra, Newcastel, United Kingdom), followed by an immunodetection with DAB (diaminobenzidine) I-view Kit (Ventana Medical Systems, Tucson, Arizona, USA). CD56+ cells were counted in 40
randomly selected fields per slide with the help of LUCIA software (Laboratory Universal Computer Image Analysis, version 5.0, Laboratory Imaging, Prague, Czech) at high magnification (X400) [20]. Several parameters were scored separately including total lymphocytes, CD56+ cells, and association of
CD56+ cells with piece meal necrosis or lobular
necrosis as well as their localization in the fibrotic tissues and in the nodular parenchyma. The numbers of cells were expressed as Unit defined as 40 fields (400X) equivalent of an area of 2.74 mm2.
For double immunostaining, antigen retrieval was performed with CC1 basic buffer pre-treatment for 60 minutes, followed by incubation with the primary anti-CD56 antibody and detected with Ultra-View Diaminobenzidine multimer kit. For CD3 detection, a second CC1
pre-treatment was applied on the same slides followed by incubation with the primary antibody (polyclonal rabbit CD3, 1/100, Dako A0452) incubation with a secondary antibody (biotinylated goat anti-rabbit IgG, 1/750, Jackson Immunoresearch 111-065-003) was detected with Ultra-View Alkalin Phosphatase red multimer kit and counterstaining (Conterstain 2) for 5 minutes.
The non-parametric Wilcoxon, Spearman and Mann-Whitney U-tests were performed for comparisons between the groups of patients and controls as previously described [19].
Results
Decreased frequency of blood and intra-hepatic
NK cells in HCVpatients.
The flow cytometric gating strategy used to identify the different subsets of NK cells is depicted in Fig.1. Phenotypic analysis of PBMCs from HCV patients demonstrated that the proportion of CD3-CD56+ NK cells relative
to lymphocyte populations was significantly decreased as compared to healthy donors (8.6 % vs 13.3 %, p<0.05) (Fig.2A). Examination of the CD3-CD56dim and CD3-CD56bright cells
distribution revealed that the frequency of CD3
-CD56bright cells was significantly increased (10.0
% vs 6.0%, p<0.05) (Fig.2B) while the frequency of CD3-CD56dim cells was
significantly reduced (90.0 % vs 94.0 %, p<0.05) (Fig.2C) in HCV patients as compared to healthy donors. These results are similar to those described by other investigators [14-16]. No such frequency differences were observed between HBV patients and healthy for either CD3-CD56+ NK cells (12.3% vs 13.3%), CD3
-CD56bright cells (6.0% vs 6.0%), or CD3-CD56dim
cells (94.0% vs 94.0%).
In HCV patients, the proportion of total intra-hepatic CD3-CD56+ NK cells appeared dramatically lower than that of their blood counterparts (5.1 % vs 8.6%, p<0.005) (Fig.2A). Again, this feature was not found in HBV patients where the proportion of intra-hepatic CD3-CD56+ NK cells was similar to that of their blood counterparts (15.2% vs 12.3%, NS) and thus significantly higher than that observed in the liver from HCV patients (15.2% vs 5.1%,
p<0.005). The low number of intra-hepatic CD3
-CD56+ cells precluded accurate analysis of the
HCV+ patients HBV+ patients (n=28) (n=19)
Demography
Male, n(%) 17 (61%) 10 (53%)
Age (y)* 50 (26-64) 38 (17-63)
Plasma Viral Load (logIU/mL) 6.2± 0.4 4.5±1.9
Serum ALT (UI/mL) 73.8 ±53.1 42.7± 27.8
Liver Histology**
Metavir Activity Score, n(%) n=27*** n=11***
0 0 1 (9%)
1 14 (50%) 6 (55%)
2 9 (32%) 4 (36%)
3 4 (14%) 0
unknown 1 8
Metavir Fibrosis Score, n(%) n=28 n=11***
0 2 (7%) 3 (27%) 1 12 (43%) 6 (55%) 2 6 (21%) 2 (18%) 3 3 (11%) 0 4 5 (18%) 0 unknown 0 8 * Median (Range) ** Number of cases / total (%)
*** Note that for technical reasons (N° of cells avalaible), the entire set of experiments described could not be performed for every single patient ALT: Alanine AminoTransferase
proportion of CD3-CD56bright vs CD3-CD56dim cells in HCV patients. 26.29 26.03 22.40 NKR C) CD158a,h D) CD158b,j E) NKG2A CD56dimCD56bright A) B) CD56 CD3 NK CD56 BP biop perf/NKG2a/3/56.004 FL1-H Coun t 100 101 102 103 104 0 8 15 23 30 BP biop perf/NKG2a/3/56.004 FL1-H Coun t 100 101 102 103 104 0 8 15 23 30 BP biop perf/NKG2a/3/56.004 FL1-H Count 100 101 102 103 104 0 8 15 23 30 Perforin CD56+CD3 -NKG2A+ CD56+CD3+ CD56+CD3 -F) G) H) 67.43 83.77 10.76 26.29 26.03 22.40 NKR C) CD158a,h D) CD158b,j E) NKG2A 26.29 26.03 22.40 NKR C) CD158a,h D) CD158b,j E) NKG2A CD56dimCD56bright A) B) CD56 CD3 NK CD56 CD56dimCD56bright CD56dimCD56bright A) B) CD56 CD3 NK CD56 BP biop perf/NKG2a/3/56.004 FL1-H Coun t 100 101 102 103 104 0 8 15 23 30 BP biop perf/NKG2a/3/56.004 FL1-H Coun t 100 101 102 103 104 0 8 15 23 30 BP biop perf/NKG2a/3/56.004 FL1-H Coun t 100 101 102 103 104 0 8 15 23 30 BP biop perf/NKG2a/3/56.004 FL1-H Coun t 100 101 102 103 104 0 8 15 23 30 BP biop perf/NKG2a/3/56.004 FL1-H Coun t 100 101 102 103 104 0 8 15 23 30 BP biop perf/NKG2a/3/56.004 FL1-H Coun t 100 101 102 103 104 0 8 15 23 30 BP biop perf/NKG2a/3/56.004 FL1-H Count 100 101 102 103 104 0 8 15 23 30 BP biop perf/NKG2a/3/56.004 FL1-H Count 100 101 102 103 104 0 8 15 23 30 BP biop perf/NKG2a/3/56.004 FL1-H Count 100 101 102 103 104 0 8 15 23 30 Perforin CD56+CD3 -NKG2A+ CD56+CD3+ CD56+CD3 -F) G) H) 67.43 83.77 10.76 Perforin CD56+CD3 -NKG2A+ CD56+CD3+ CD56+CD3 -F) G) H) 67.43 83.77 10.76
Figure 1. Expression of Natural Killer Receptors (NKRs) by NK cells
Representative four-color flow cytometry analysis for peripheral blood lymphocytes is shown for a patient chronically infected by the Hepatitis C virus. A) Dot plot representation of CD3 and CD56 double staining used to estimate the frequency of NK cells (boxed CD3-CD56+); B) Histogram of the CD56+ cells defining the CD56dim and CD56bright NK cells (CD3-CD56+);
C) CD158a,h; D) CD158b,j and E) NKG2A expressions respectively. Histogram of perforin cells in CD3-CD56+ (F), CD3-CD56+NKG2A+
(G) and CD3+CD56+ cells (H).
Nevertheless, this analysis when conducted for HBV patients revealed that the proportion of intra-hepatic CD3-CD56bright cells was
significantly higher (6.0% vs 19.5%, p<0.005) than those observed in the peripheral blood while the proportion of intra-hepatic CD3
-CD56dim cells was significantly lower (94.0% vs
80.5%, p<0.005) than in the peripheral blood (Fig.2B,C). Healthy (n=18) HCV (n=28) HBV (n=19) HBV (n=6) HCV (n=11) PBMC LIVER 13.3% 8.6% 12.3% 6.6% 15.2% p<0.05 p<0.05 p<0.005 Healthy (n=18) HCV (n=28) HBV (n=6) HBV (n=19) PBMC LIVER 94.0% 90.0% 94.0% 80.5% p<0.05 p=0.05 Healthy (n=18) HCV (n=28) HBV (n=6) HBV (n=19) PBMC LIVER 6.0% 19.5% 6.0% 10.0% p<0.05 p<0.05
CD3
-CD5
6
+Cells
CD3
-CD56
di mCells
CD3
-CD56
br igh tC
ells
A)
B)
C)
Healthy (n=18) HCV (n=28) HBV (n=19) HBV (n=6) HCV (n=11) Healthy (n=18) HCV (n=28) HBV (n=19) HBV (n=6) HCV (n=11) PBMC LIVER 13.3% 8.6% 12.3% 6.6% 15.2% p<0.05 p<0.05 p<0.005 Healthy (n=18) HCV (n=28) HBV (n=6) HBV (n=19) PBMC LIVER 94.0% 90.0% 94.0% 80.5% p<0.05 p=0.05 Healthy (n=18) HCV (n=28) HBV (n=6) HBV (n=19) PBMC LIVER Healthy (n=18) HCV (n=28) HBV (n=6) HBV (n=19) PBMC LIVER Healthy (n=18) HCV (n=28) HBV (n=6) HBV (n=19) Healthy (n=18) HCV (n=28) HBV (n=6) HBV (n=19) PBMC LIVER 94.0% 90.0% 94.0% 80.5% p<0.05 p=0.05 Healthy (n=18) HCV (n=28) HBV (n=6) HBV (n=19) PBMC LIVER 6.0% 19.5% 6.0% 10.0% p<0.05 p<0.05 Healthy (n=18) HCV (n=28) HBV (n=6) HBV (n=19) PBMC LIVER Healthy (n=18) HCV (n=28) HBV (n=6) HBV (n=19) Healthy (n=18) HCV (n=28) HBV (n=6) HBV (n=19) PBMC LIVER 6.0% 19.5% 6.0% 10.0% p<0.05 p<0.05CD3
-CD5
6
+Cells
CD3
-CD56
di mCells
CD3
-CD56
br igh tC
ells
A)
B)
C)
Figure 2. Frequency of blood and intra-hepatic NK cells in Chronic HCV or HBV patients
The frequency of (A) NK cells (CD3-CD56+) (B)
CD56dim within CD3-CD56+ cells (C) CD56bright
within CD3-CD56+ cells was evaluated by flow
cytometry in the blood and/or in liver of healthy, HCV+ and HBV+ patients. Data are represented
as boxplots showing medians (horizontal lines), upper and lower quartiles (boxes) and extreme values (whiskers).
Intrahepatic localization of CD56+ cells in HCV and HBV patients.
In order to precisely quantify and localise CD56+ cells in different intra-hepatic
areas (nodular parenchymatous areas and necro-inflammatory lesions) immunohistochemistry was performed. We selected 6 chronic HCV patients with A1 (n=3) and A3 (n=3) Metavir scores and 6 chronic histologically-matched HBV patients. The presence of CD56+ cells was detected essentially in piecemeal and lobular necrosis (Fig.3 A, B, C, D). CD56+ cell density were significantly lower in the liver of HCV patients compared to HBV patients (69 vs134 -
p<0.05) (Fig.3E). Strikingly, the density of
CD56- cells was significantly higher in HCV
patients compared to HBV patients (on average 2122 vs 583 cells/U, p<0.005). Thus, the percentage of CD56+ cells among the total
infiltrating immune cells was significantly lower in HCV patients compared to HBV patients (3.6% vs 18.4%, p<0.005).
Considering the localization of CD56+
cells in the different histological areas, we observed that i) CD56+ cells density was
significantly lower in parenchymatous areas in HCV patients compared to HBV patients (28 vs 114, p<0.005) (Fig.3F); and ii) CD56+ cell
density was low inside the necro-inflammatory lesions (piecemeal necrosis and lobular necrosis) in both HCV and HBV patients. However, inside the necro-inflammatory lesions, CD56+ cells
were significantly higher in HCV patients as compared to HBV patients (9 vs 2, p<0.005) (Fig.3G).
In some cases, double immunostaining of CD56 and CD3 cells was investigated in order to distinguish between classical NK cells (CD3
-CD56+) and cells expressing CD3 and CD56
molecules. We observed numerous CD3+
lymphocytes (red, Fig.3H,I) and few CD56+
cells (brown, Fig.3H,I) present in the fibrous areas and in necro-inflammatory lesions. Orange CD56/CD3 double-stained cells were scarce and observed in the fibrous septa only (Fig.3H).
Relationship between blood and intra-hepatic
CD3-CD56+ NK cells in necro-inflammatory
lesions
In both HCV and HBV infection, intra-hepatic CD56+cells density remained constant whatever the necro-inflammatory grading (Fig.3). In contrast, the CD56- cell density increased from A1 to A3 Metavir score, in both HCV and HBV patients (Table 2). Thus, the proportion of CD56+ cells among total
lymphocytes decreased from A1 to A3 Metavir in both HCV and HBV groups. The CD56+ cell
density inside the necro-inflammatory lesions was higher in Metavir-A1 than in Metavir-A3 patients in HCV groups but such difference was not found in HBV groups. With increasing necro-inflammatory activity, CD56+ cells tended
to localize preferentially outside of necro-inflammatory lesions in HCV patients. In both groups, peripheral CD3-CD56+ NK cells did not
correlate with any bioclinical parameters including necro-inflammatory grade, ALT serum levels and viral load.
Analysis of HLA class I specific receptors expression by NK cells.
Among blood NK cells, expression of CD158a/h, CD158b/j and NKG2A did not differ between HCV patients and healthy donors. However, we detected a significant decrease of NKG2A+ expression in HBVpatients as compare
to HCV patients (54.5% vs 24.7%, p<0.001) and healthy donors (55.4% vs 24.7 %, p<0.001) (Fig.4A).
F PN F P PN A F P B LN PN C PN D LN H I
Intra-hepatic NK cells in HCV patients
Simple immunostaining CD56 Double immunostaining CD56/CD3
CD56 cells CD56 cells in Parenchyma Numbe r of NK c ells / Units 0 50 100 150 200 HCV (n=6) HBV (n=6) p<0.05 E 0 50 100 150 200 HCV (n=6) HBV (n=6) p<0.005 F 0 5 10 15 20 HCV (n=6) HBV (n=6) p<0.005 CD56 cells in Necrosis G PN LN
*
F PN F P PN A F P B LN PN C PN D LN H IIntra-hepatic NK cells in HCV patients
Simple immunostaining CD56 Double immunostaining CD56/CD3
F PN F P PN A F P B LN PN F PN F P PN A F PN F P PN A A F P B LN PN F P B LN LN PN C PN D LN C PN C PN PN D LN D D LN LN H H II
Intra-hepatic NK cells in HCV patients Intra-hepatic NK cells in HCV patients
Simple immunostaining CD56 Double immunostaining CD56/CD3
CD56 cells CD56 cells in Parenchyma Numbe r of NK c ells / Units 0 50 100 150 200 HCV (n=6) HBV (n=6) p<0.05 E Numbe r of NK c ells / Units 0 50 100 150 200 HCV (n=6) HBV (n=6) p<0.05 E 0 50 100 150 200 HCV (n=6) HBV (n=6) p<0.05 p<0.05 E 0 50 100 150 200 HCV (n=6) HBV (n=6) p<0.005 F 0 50 100 150 200 HCV (n=6) HBV (n=6) p<0.005 p<0.005 F 0 5 10 15 20 HCV (n=6) HBV (n=6) p<0.005 p<0.005 CD56 cells in Necrosis G PN LN
*
Figure 3. Immunohistochemical detection and quantification of intra-hepatic CD56+ cells in hepatitis C or hepatitis B patients. (A) CD56+ cells are present in the Fibrotic area (indicated by F and black arrows) of hepatitis C patients without localization in the Piecemeal Necrosis (PN) (Original magnification X100). (B) CD56+ cells are present in the Fibrotic area and Parenchyma (indicated by P
and black arrows) of hepatitis C patients with the localization in Piecemeal Necrosis (Original magnification X100). (C) Localization of CD56+ cells in the Piecemeal Necrosis (Original
magnification X400) of hepatitis C patients. (D) Localization of CD56+ cells in the Lobular Necrosis
(LN) (Original magnification X400). (E) Total CD56+ cells in both groups of patients. (F) CD56+ cells
in Parenchyma in both groups of patients. (G) CD56+ cells in necrosis (Piecemeal and Lobular
necrosis) in both groups of patients. In (E), (F) and (G), all the values represent a density of CD56+
cells/unit area = 2.74mm2 and the horizontal bar represents median values. (H) CD3+ lymphocytes
(red) and CD56+ lymphocytes (brown) are taking part in Parcellar Necrosis, with two CD56 cells in
contact with an apoptotic body (asterisk, objective x40). (I) CD3+ lymphocytes (red) and CD56+
Table 2. Expression of CD56+ cells by immunohistochemistry among cirrhosis C patients and cirrhosis B patients with low inflammatory grading (Metavir-A1, 3 patients) and high necro-inflammatory grading (Metavir-A3, 3 patients) according to the French Metavir Scoring System. In HCV patients, the frequencies of both
CD158a,h+ and CD158b,j+ NK cells were
significantly higher among blood lymphocytes relative to the liver infiltrating lymphocytes (mean values: 19.2% vs 7.6% - p<0.001, 30.0% vs 15.0% p<0.001, respectively) (Fig.4B,C), whereas NKG2A+ NK cell frequency was
comparable in liver and blood NK cells (58.0% vs 54.5%, NS) (Fig.4A). In contrast, in the liver of HBV patients, the frequency of CD158a,h+,
CD158b,j+ and NKG2A NK cells appeared
similar to those observed in the blood (mean values: 26.3% vs 27.5% - NS, 30.9% vs 28.6% -
NS, 24.7% vs 26.1% - NS, respectively)
(Fig.4B,C).
In HCV patients, the frequency of intra-hepatic CD158a,h+ and CD158b,j+ NK cells
appeared significantly lower than those observed in HBV patients (7.6% vs 27.5%, p<0.001 and 15.0% vs 28.6% - p<0.005 respectively). Inversely, the frequency of intra-hepatic NKG2A+ NK cells was significantly higher in
HCV than in HBV patients (58% vs 26.1% -
p<0.005). Taken together, our findings revealed
striking modifications in the tissue distribution of these NK cell subsets in patients with persistent HCV or HBV infection, in particular: i) reduced proportions of CD158a,h+ and CD158b,j+ liver infiltrating NK lymphocytes among HCV patients, at different stages of the viral infections, even in patients with low Metavir Activity score (data not shown) and, ii) alterations in intra-hepatic NKG2A+ NK cells in
HBV patients (Fig.4A).
Analysis of perforin expression among
intra-hepatic CD3-CD56+ NK cells.
To provide further insights in the potential cytotoxicity of NK cells, we studied the cellular contents of perforin in intra-hepatic CD56+ cells
of 5 HCV patients and 2 HBV patients. In HCV patients, 67.43 ± 6.09% of CD3-CD56+ cells
were perforin positive (Fig.1F), suggesting that a large amount of CD56+ cells showed a cytotoxic
potential. As in HCV patients, NKG2A+ cells
represented the major subset of CD3-CD56+ NK
cells, we investigated their perforin content. 83.77 ± 45.36% of these cells were perforin positive (Fig.1G) indicating that the subset of NK cells expressing NKG2A marker had the cytolytic potential in HCV infected patients. Interestingly, the same analysis conducted on HBV patients revealed that only 35.48 ± 22.17% of CD3-CD56+cells were perforin positive. The
low frequency of CD3-CD56+NKG2A+ in HBV
patients impedes accurate quantification perforin-expressing cells. In parallel, in HCV patients, the analysis of intra-hepatic cells selected for the expression CD3+CD56+ and perforin revealed that the proportion of perforin positive cells was low (less than 10 %). These results were in agreement with our previous report indicating that the proportion of perforin positive cells among blood CD3+CD56+ T cells was reduced in HCV patients (Fig.1H) [19].
Metavir A1 Metavir A3 Metavir A1 Metavir A3
n=3 n=3 n=3 n=3
CD56+Cells 68 69 134 134
CD56-Cells Lymphocytes 1501 2744 531 635
CD56+Cells/Lymphocytes (%) 4.6 2.6 20.3 16.4
CD56+Cells in Parenchyma 36 19 129 99
CD56+Cells outside Necrosis 55 63 132 131
CD56+Cells inside Necrosis 12 6 2 3
All the parameters were expressed as / Unit - 1Unit = 40 fields (400X) = 2.74mm2
Cirrhosis C Cirrhosis B
Metavir A1 Metavir A3 Metavir A1 Metavir A3
n=3 n=3 n=3 n=3
CD56+Cells 68 69 134 134
CD56-Cells Lymphocytes 1501 2744 531 635
CD56+Cells/Lymphocytes (%) 4.6 2.6 20.3 16.4
CD56+Cells in Parenchyma 36 19 129 99
CD56+Cells outside Necrosis 55 63 132 131
CD56+Cells inside Necrosis 12 6 2 3
All the parameters were expressed as / Unit - 1Unit = 40 fields (400X) = 2.74mm2
Healthy (n=17) HCV (n=26) HBV (n=19) HBV (n=6) HCV (n=12) PBMC LIVER 55.4% 54.5% 24.7% 58.0% 26.1% p<0.001 p<0.001 p<0.005 Healthy (n=18) HCV (n=28) HBV (n=19) HBV (n=6) HCV (n=14) PBMC LIVER 25.3% 19.2% 26.3% 7.6% 27.5% p<0.05 p<0.001 p<0.001 Healthy (n=18) HCV (n=28) HBV (n=19) HBV (n=6) HCV (n=13) PBMC LIVER 29.8% 30.0% 30.9% 15.0% 28.6% p<0.001 p<0.005 CD 3 -CD 56N K G 2 A Cell s CD3 -CD56CD158a,h Cell s CD 3 -CD 56 C D 15 8b ,j C ells
A)
B)
C)
Healthy (n=17) HCV (n=26) HBV (n=19) HBV (n=6) HCV (n=12) PBMC LIVER Healthy (n=17) HCV (n=26) HBV (n=19) HBV (n=6) HCV (n=12) PBMC LIVER PBMC LIVER 55.4% 54.5% 24.7% 58.0% 26.1% p<0.001 p<0.001 p<0.001 p<0.005p<0.005 Healthy (n=18) HCV (n=28) HBV (n=19) HBV (n=6) HCV (n=14) PBMC LIVER Healthy (n=18) HCV (n=28) HBV (n=19) HBV (n=6) HCV (n=14) PBMC LIVER PBMC LIVER 25.3% 19.2% 26.3% 7.6% 27.5% p<0.05 p<0.05 p<0.001 p<0.001 p<0.001 p<0.001 Healthy (n=18) HCV (n=28) HBV (n=19) HBV (n=6) HCV (n=13) PBMC LIVER Healthy (n=18) HCV (n=28) HBV (n=19) HBV (n=6) HCV (n=13) PBMC LIVER PBMC LIVER 29.8% 30.0% 30.9% 15.0% 28.6% p<0.001 p<0.001 p<0.005 p<0.005 CD 3 -CD 56N K G 2 A Cell s CD3 -CD56CD158a,h Cell s CD 3 -CD 56 C D 15 8b ,j C ellsA)
B)
C)
Figure 4. Frequency of NKR+ cells within the total NK population (CD3- CD56+) The frequency of (A) NKG2A+ , (B) CD158a,h+ and
(C) CD158b,j+ cells within the total NK cells
population (CD3-CD56+) was analyzed in blood
lymphocytes for healthy control, HCV+ and
HBV+ patients and in intra-hepatic lymphocytes
for HCV+ and HBV+ patients by the flow
cytometry.
Analysis of the frequencies of CD3-CD56+ NK
cells subsets with clinical parameters in HCV and HBV patients.
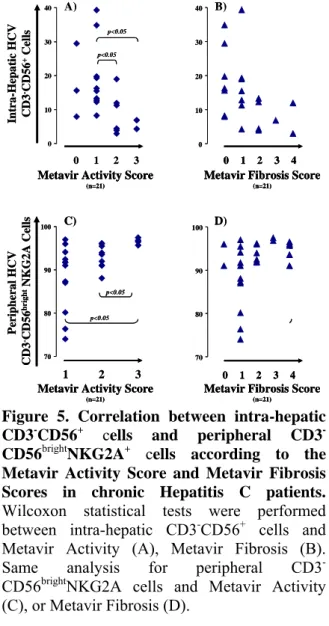
First, we analyzed the correlation between intra-hepatic and peripheral CD3
-CD56+ cells according to activity or fibrosis in
HCV or HBV infected patients. In HCV patients, negative correlations were observed between intra-hepatic CD3-CD56+ cells and Metavir
Activity (r= -0.579, p=0.006) or Metavir Fibrosis (r= -0.547, p=0.010). More specifically, the frequencies of intra-hepatic CD3-CD56+ cells decreased with increased Metavir activity (Fig.5A) (A1/A3-z=-2.386-p=0.016 or A2/A3-z=-2.148-p=0.030) and Metavir fibrosis scores (Fig.5B) (F0/F2, z=-1.890, p=0.073) . Such correlations were not observed in peripheral cells in HCV patients and in peripheral or intra-hepatic cells in HBV patients.
0 10 20 30 40 Intra-He pa ti c H CV CD3 -CD 56 +Cell s A) 1 2 3
Metavir Activity Score
(n=21)
Metavir Fibrosis Score
(n=21) 0 0 1 2 3 4 p<0.05 p<0.05 p=0.07 70 80 90 100 1 2 3 D) C) Peri pheral H CV CD3 -CD 56 bri g ht NKG2 A Ce lls 1 2 3 0 4 p<0.05 p<0.05 p=0.05 p=0.05
Metavir Activity Score
(n=21)
Metavir Fibrosis Score
(n=21) 70 80 90 100 0 10 20 30 40 B) 0 10 20 30 40 Intra-He pa ti c H CV CD3 -CD 56 +Cell s A) 1 2 3
Metavir Activity Score
(n=21)
Metavir Fibrosis Score
(n=21)
Metavir Activity Score
(n=21)
Metavir Fibrosis Score
(n=21) 0 00 11 22 33 44 p<0.05 p<0.05 p<0.05 p<0.05 p=0.07p=0.07 70 80 90 100 1 2 3 D) C) Peri pheral H CV CD3 -CD 56 bri g ht NKG2 A Ce lls 1 2 3 0 1 2 3 4 0 4 p<0.05 p<0.05 p<0.05 p<0.05 p=0.05p=0.05 p=0.05 p=0.05
Metavir Activity Score
(n=21)
Metavir Fibrosis Score
(n=21)
Metavir Activity Score
(n=21)
Metavir Fibrosis Score
(n=21) 70 80 90 100 0 10 20 30 40 B)
Figure 5. Correlation between intra-hepatic CD3-CD56+ cells and peripheral CD3 -CD56brightNKG2A+ cells according to the Metavir Activity Score and Metavir Fibrosis Scores in chronic Hepatitis C patients. Wilcoxon statistical tests were performed between intra-hepatic CD3-CD56+ cells and
Metavir Activity (A), Metavir Fibrosis (B). Same analysis for peripheral CD3
-CD56brightNKG2A cells and Metavir Activity
(C), or Metavir Fibrosis (D).
Second, we found that the percentage of CD3-CD56bright NK cells with NKG2A
expression was positively associated with the severity of both necroinflammation (r =0.545,
p<0.01) and fibrosis (r =0.454, p<0.05) in HCV
-CD56bright NKG2A+ cells increased also with the
severity of disease in these patients. Indeed, positive correlations were observed between these peripheral cells and Activity (A1/A3-z=2.550;p=0.008 and A2/A3-z=2.472; p=0.011) (Fig.5C) and also with fibrosis (F1/F3-z=1.927; p=0.052 and F1/F4-z=1.974; p=0.051) (Fig.5D). It is important to note that the correlations mentioned above between the subsets of NK cells and severity of disease, were not found in the case of HBV patients. Concerning HCV patients, we observed a negative association (r = -0.540, p<0.01) between the frequency of CD3 -CD56+ NKG2A+ cells and the serum viral load
(Fig.6A). This comparable negative correlation was also detectable in these patients when the analysis was restricted to the blood CD3
-CD56dim subset (r = - 0.441, p<0.05 (Fig.6B). In
HBV infected patients, we did not observe any correlation between viral load and peripheral NK cell subsets. However, in the six HBV infected patients in whom viral load and intrahepatic flow cytometric data were available, a negative correlation between CD3-CD56+ or CD3
-CD56dimNKG2A+ and viral load (r=-0.900- p<0.05) was found.
5.30 5.80 6.30 6.80 7.30
Viral load(log UI/mL)
0.0 20.0 40.0 60.0 80.0 100.0 Pe ri ph eral CD 3 -CD56 +NK G 2 A Ce ll s A) p<0.01 0.0 20.0 40.0 60.0 80.0 100.0 Pe ri ph eral CD 3 -CD56 dim N K G 2 A Ce ll s B) p<0.05 5.30 5.80 6.30 6.80 7.30
Viral load(log UI/mL)
5.30 5.80 6.30 6.80 7.30 5.30 5.80 6.30 6.80 7.30
Viral load(log UI/mL)
0.0 20.0 40.0 60.0 80.0 100.0 Pe ri ph eral CD 3 -CD56 +NK G 2 A Ce ll s A) p<0.01 0.0 20.0 40.0 60.0 80.0 100.0 Pe ri ph eral CD 3 -CD56 +NK G 2 A Ce ll s A) p<0.01 0.0 20.0 40.0 60.0 80.0 100.0 Pe ri ph eral CD 3 -CD56 dim N K G 2 A Ce ll s B) p<0.05 0.0 20.0 40.0 60.0 80.0 100.0 Pe ri ph eral CD 3 -CD56 dim N K G 2 A Ce ll s B) p<0.05
Figure 6. Correlation between CD3
-CD56+NKG2A+ cells and viral load from PBMCs of HCV+ Patients. Spearman statistical tests were performed between viral load and CD3-CD56+NKG2A+ cells (A) or CD3
-CD56dimNKG2A+ cells (B).
Discussion
Ours data confirm a significant reduction in NK cell frequency and a quantitative imbalance of the CD56bright and CD56dim subsets
within the total NK cell population in HCV and HBV infected patients [14, 16]. In HCV infections, under proinflammatory conditions, it has also been reported that CD3-CD56dim NK cells are more susceptible to apoptosis compared to CD3-CD56bright NK cells, under inflammatory conditions and that this can contribute to altered maintenance of CD3-CD56dim NK cells in infectious diseases [23]. In healthy individuals, there are clearly more apoptotic, activated CD56dim cells among blood NK cells compared
to their CD3-CD56bright counterparts thereby
suggesting that a differential susceptibility to cell death is a natural feature of these two subsets [13]. Here, neither decreases of CD56+
cell numbers nor differences in CD3
-CD56bright/CD3-CD56dim ratios were observed in
HBV patients, thereby suggesting that the proinflammatory environment is not sufficient to explain the altered CD3-CD56dim/CD3-CD56bright
ratio in the HCV group. The clear differences in NK cell frequencies and the expression of differential CD3-CD56dim/CD3-CD56bright ratio in
both viral infections strongly supports that HCV itself may able to alter significantly the activation, proliferation of NK cells [4, 5, 24].
The examination of perforin contents in CD3-CD56+ cells in both pathologies show a
striking difference: CD56+ cells in HCV patients
are enriched in perforin whereas in HBV patients a low number of CD3-CD56+ perforin+ cells are
observed. Thus, in HCV patients the frequencies of CD3-CD56+ cells are lower than in HBV
patients, but these CD3-CD56+ cells contain
more cytolytic proteins which able to lyse the infected cells. One can hypothesize that HCV may be able to negatively regulate proliferation and differentiation of CD56+ cells but not their
toxicity.
NK cell activation may be impaired and/or prevented by cell surface inhibitory receptors expressed by NK cells [27]. We did not observe any significant change in the frequencies of both CD158a,h+ and CD158b,j+ cells in the blood of HCV and HBV patients as depicted by others in the patients with chronic HCV and hepatocellular carcinoma [16, 28]. Instead, we report a strong alteration in the frequencies of CD3-CD56+NK cells expressing
CD158a,h+ or CD158b,j+ in the liver of HCV
these subsets of NK cells in the liver has not been clearly determined, although they represent a significant proportion of intra-hepatic NK cells in healthy donors [28] As the CD3
-CD56+CD158a,h+ and CD158b,j+ are more
expressed in CD3-CD56dim than in CD3
-CD56bright [16, 17] the decrease of these subsets in the liver of HCV patients, again underlines that HCV may interfere with the activation/differentiation of intra-hepatic CD3 -CD56dim cells subset which is generally more cytotoxic. In type 2 transmembrane proteins, no significant change in the frequencies of liver infiltrating NKG2A+ cells were detected in HCV
patients, while, they are significantly reduced in the blood and liver compartments of HBV patients. Taken together, our results suggest that both viruses differentially interfere with NK cell homeostasis. This point requires further analysis in particular by investigating additional receptors for each family to determine if the viruses have a tropism for one or another of these receptors.
Statistical analysis indicates that the peripheral CD3-CD56brightNKG2A+ cells are
positively correlated with necro-inflammatory activity score in HCV patients but not HBV patients. It has been reported that NKG2A expression correlates with CD94 and that high levels of CD94 expression (a well established feature of CD3-CD56bright NK cells) is associated
with an enhanced resistance of NK lymphocytes to cell death [29]. One can argue that under constant HCV-mediated inhibition combined to cell-cell interaction(s) and/or local cytokine production a level of selective persistence/retention of specific intra-hepatic NK cell subsets lose the ability to undergo differentiation beyond the CD3-CD56bright stage
but acquire higher cytotoxic activity.
This hypothesis is supported by our data showing that the frequency of intra-hepatic CD3
-CD56+Perforin+ cells in HCV patients is higher
than the equivalent counterpart in HBV patients. In summary, our analysis indicates that a high necro-inflammatory activity score is associated to a high frequency of CD3-CD56brightNKG2A+ cells in the peripheral blood of HCV patients. We thus propose that the quantitative assessment of the CD3-CD56brightNKG2A+ NK cell
subpopulation has potential for incorporation to current grading schemes of persistent HCV infection.
Interestingly, we found a negative correlation between CD3-CD56+NKG2A+ cells
and viral load in HCV and HBV patients. To pin point this correlation, we observed that the viral load was correlated negatively with CD3 -CD56dimNKG2A+ cells subset. Taking in account that i) CD56+NKG2A+ cells represent half of the CD56+NK cells and, ii) as we discussed above that HCV tends to control negatively the frequency of CD56+NK cells during the chronic infection, it is not surprising that in patients with a high level of virus (HCV), the frequency of CD3-CD56+NKG2A+ cells is low. In the 6 HBV
patients, we observed high decrease of CD56+NKG2A+ cells and a negative correlation
between viral load and intra-hepatic CD3-CD56+
cells or CD3-CD56dimNKG2A+ cells. Taken
together, these data suggest that both viruses have tropism to NKG2A expressing CD3
-CD56dim cells subset.
Finally, our analyses identify two subsets of NK cells with potential as new markers for disease grading in HCV infection. First, the frequency of circulating CD3
-CD56brightNKG2A+ cells is correlated with high
score of necro-inflammatory activity and second, the frequency of circulating CD3
-CD56dimNKG2A+ cells which is negatively
correlated with viral load in both infections. In addition, differential CD3-CD56bright/CD3
-CD56dim ratios and frequency of CD3-CD56+
subsets in the liver of HCV and HBV patients highlighted that both viruses may use some different strategy to target immune system. 7. Acknowledgements
We are grateful to the patients who enrolled in this study for their cooperation. This work was supported by grants from INSERM , from the Agence Nationale pour la Recherche sur le Sida (ANRS) and from Pole de compétitivité LyonBiopole. P.B. was supported by ANRS; M.R. from Higher Education Commission of Pakistan and X.C. by Région-Rhône Alpes “Cluster 10”. The authors thank Dr Mary Callanan for reading this manuscript.
References
[1] Guidotti LG, Chisari FV.
Immunobiology and pathogenesis of viral hepatitis. Annu Rev Pathol 2006;1:23-61. [2]Lanier LL. NK cell recognition. Annu Rev Immunol 2005;23:225-274.
[3] Orange JS, Fassett MS, Koopman LA, Boyson JE, Strominger JL. Viral evasion of natural killer cells. Nat Immunol 2002;3:1006-1012.
[4] Crotta S, Stilla A, Wack A, D'Andrea A, Nuti S, D'Oro U, et al. Inhibition of natural killer cells through engagement of CD81 by the major hepatitis C virus envelope protein. J Exp Med 2002;195:35-41.
[5] Tseng CT, Klimpel GR. Binding of the hepatitis C virus envelope protein E2 to CD81 inhibits natural killer cell functions. J Exp Med 2002;195:43-49.
[6] Foy E, Li K, Wang C, Sumpter R, Jr., Ikeda M, Lemon SM, et al. Regulation of interferon regulatory factor-3 by the hepatitis C virus serine protease. Science 2003;300:1145-1148.
[7] Taylor DR, Shi ST, Romano PR, Barber GN, Lai MM. Inhibition of the interferon-inducible protein kinase PKR by HCV E2 protein. Science 1999;285:107-110.
[8] Guidotti LG, Morris A, Mendez H, Koch R, Silverman RH, Williams BR, et al. Interferon-regulated pathways that control hepatitis B virus replication in transgenic mice. J Virol
2002;76:2617-2621.
[9] Herzer K, Falk CS, Encke J, Eichhorst ST, Ulsenheimer A, Seliger B, et al.
Upregulation of major histocompatibility
complex class I on liver cells by hepatitis C virus core protein via p53 and TAP1 impairs natural killer cell cytotoxicity. J Virol 2003;77:8299-8309.
[10] Zhou DX, Taraboulos A, Ou JH, Yen TS. Activation of class I major
histocompatibility complex gene expression by hepatitis B virus. J Virol 1990;64:4025-4028. [11] Li Y, Zhang T, Ho C, Orange JS, Douglas SD, Ho WZ. Natural killer cells inhibit hepatitis C virus expression. J Leukoc Biol 2004;76:1171-1179.
[12] Dunn C, Brunetto M, Reynolds G, Christophides T, Kennedy PT, Lampertico P, et al. Cytokines induced during chronic hepatitis B virus infection promote a pathway for NK
cell-mediated liver damage. J Exp Med 2007;204:667-680.
[13] Lin AW, Gonzalez SA, Cunningham-Rundles S, Dorante G, Marshall S, Tignor A, et al. CD56(+dim) and CD56(+bright) cell activation and apoptosis in hepatitis C virus infection. Clin Exp Immunol 2004;137:408-416. [14] Meier UC, Owen RE, Taylor E, Worth A, Naoumov N, Willberg C, et al. Shared alterations in NK cell frequency, phenotype, and function in chronic human immunodeficiency virus and hepatitis C virus infections. J Virol 2005;79:12365-12374.
[15] Morishima C, Paschal DM, Wang CC, Yoshihara CS, Wood BL, Yeo AE, et al. Decreased NK cell frequency in chronic hepatitis C does not affect ex vivo cytolytic killing. Hepatology 2006;43:573-580.
[16] Golden-Mason L, Madrigal-Estebas L, McGrath E, Conroy MJ, Ryan EJ, Hegarty JE, et al. Altered natural killer cell subset distributions in resolved and persistent hepatitis C virus infection following single source exposure. Gut 2008;57:1121-1128.
[17] Cooper MA, Fehniger TA, Turner SC, Chen KS, Ghaheri BA, Ghayur T, et al. Human natural killer cells: a unique innate
immunoregulatory role for the CD56(bright) subset. Blood 2001;97:3146-3151.
[18] Jacobs R, Hintzen G, Kemper A, Beul K, Kempf S, Behrens G, et al. CD56bright cells differ in their KIR repertoire and cytotoxic features from CD56dim NK cells. Eur J Immunol 2001;31:3121-3127.
[19] Bonorino P, Leroy V, Dufeu-Duchesne T, Tongiani-Dashan S, Sturm N, Pernollet M, et al. Features and distribution of CD8 T cells with human leukocyte antigen class I-specific
receptor expression in chronic hepatitis C. Hepatology 2007;46:1375-1386.
[20] Leroy V, Vigan I, Mosnier JF, Dufeu-Duchesne T, Pernollet M, Zarski JP, et al. Phenotypic and functional characterization of intrahepatic T lymphocytes during chronic hepatitis C. Hepatology 2003;38:829-841. [21] Vigan I, Jouvin-Marche E, Leroy V, Pernollet M, Tongiani-Dashan S, Borel E, et al. T lymphocytes infiltrating the liver during chronic hepatitis C infection express a broad range of T-cell receptor beta chain diversity. J Hepatol 2003;38:651-659.
[22] Pernollet M, Jouvin-Marche E, Leroy V, Vigan I, Zarski JP, Marche PN. Simultaneous evaluation of lymphocyte subpopulations in the
liver and in peripheral blood mononuclear cells of HCV-infected patients: relationship with histological lesions. Clin Exp Immunol 2002;130:518-525.
[23] Schierloh P, Yokobori N, Aleman M, Musella RM, Beigier-Bompadre M, Saab MA, et al. Increased susceptibility to apoptosis of CD56dimCD16+ NK cells induces the enrichment of IFN-gamma-producing CD56bright cells in tuberculous pleurisy. J Immunol 2005;175:6852-6860.
[24] Pileri P, Uematsu Y, Campagnoli S, Galli G, Falugi F, Petracca R, et al. Binding of hepatitis C virus to CD81. Science
1998;282:938-941.
[25] Melhem A, Muhanna N, Bishara A, Alvarez CE, Ilan Y, Bishara T, et al. Anti-fibrotic activity of NK cells in experimental liver injury through killing of activated HSC. J Hepatol 2006;45:60-71.
[26] Radaeva S, Sun R, Jaruga B, Nguyen VT, Tian Z, Gao B. Natural killer cells
ameliorate liver fibrosis by killing activated stellate cells in NKG2D-dependent and tumor necrosis factor-related apoptosis-inducing ligand-dependent manners. Gastroenterology 2006;130:435-452.
[27] Long EO, Burshtyn DN, Clark WP, Peruzzi M, Rajagopalan S, Rojo S, et al. Killer cell inhibitory receptors: diversity, specificity, and function. Immunol Rev 1997;155:135-144. [28] Yuen MF, Norris S. Expression of inhibitory receptors in natural killer (CD3(-)CD56(+)) cells and CD3(+)CD56(+) cells in the peripheral blood lymphocytes and tumor
infiltrating lymphocytes in patients with primary hepatocellular carcinoma. Clin Immunol
2001;101:264-269.
[29] Gunturi A, Berg RE, Forman J. Preferential survival of CD8 T and NK cells expressing high levels of CD94. J Immunol 2003;170:1737-1745.