HAL Id: hal-02049089
https://hal.archives-ouvertes.fr/hal-02049089
Submitted on 24 Oct 2019
HAL is a multi-disciplinary open access
archive for the deposit and dissemination of sci-entific research documents, whether they are pub-lished or not. The documents may come from teaching and research institutions in France or abroad, or from public or private research centers.
L’archive ouverte pluridisciplinaire HAL, est destinée au dépôt et à la diffusion de documents scientifiques de niveau recherche, publiés ou non, émanant des établissements d’enseignement et de recherche français ou étrangers, des laboratoires publics ou privés.
Effects of Flooding on Crushable Sand
Carlos Ovalle, Christophe Dano, Pierre-Yves Hicher, Mónica Cisternas
To cite this version:
Carlos Ovalle, Christophe Dano, Pierre-Yves Hicher, Mónica Cisternas. Effects of Flooding on Crush-able Sand. 10th International Workshop on Bifurcation and Degradation in Geomaterials in the New Millenium, May 2014, Hong-Kong, China. pp.91-98, �10.1007/978-3-319-13506-9_14�. �hal-02049089�
Effects of Flooding on Crushable Sand
Carlos Ovalle, Christophe Dano, Pierre-Yves Hicher and Mónica Cisternas
Abstract We carried out compression tests on crushable sand to study the
effect of creep and relaxation after flooding. We show that there is a consistent framework linking the breakage ratio with the compressibility, which could be useful to develop constitutive models.
1 Introduction
The design of safe and environmentally friendly rockfill dams requires ensuring mechanical and hydraulic stability. These structures are mainly built with a mix of coarse rock aggregates, which may be degraded by stress and hydraulic conditions during lifetime, causing particle crushing and therefore increasing the compressibility. It is well known that the mechanical behavior of crushable granular materials is a function of the properties of the granular packing and its water content, as well as mechanical and geometrical characteristics of indi-vidual grains (Lee and Coop 1995; Lade et al. 1996; Oldecop and Alonso 2003; Ovalle et al. 2013a, b; Ovalle et al. 2014). In fact, the source of grain crushing comes from the mechanical properties of grains and its loading conditions at inter-granular contacts. A close look to the microscopic scale (internal flaws) gives a physical explanation of this phenomenon, as described by classical brittle fracture mechanics (Irwin 1957) through the concept of fracture toughness KIC (for Mode
I), which depends on the relative humidity (Oldecop and Alonso 2007).
C. Ovalle ( )
Department of Structural and Geotechnical Engineering, Pontificia Universidad Católica de Chile, Santiago, Chile e-mail: [email protected]
C. Dano · P.-Y. Hicher · M. Cisternas
LUNAM University, Ecole Centrale de Nantes, CNRS UM, 6183 Nantes, France e-mail: [email protected]
Many advances have been made in the understanding of the phenomenon of grain crushing. However, the role of the breakage ratio as a governing parameter for the effect of the water content on crushable soils is not clear. Therefore, in this paper we present an extensive experimental program of the effects of flooding in crushable sand. The main objective is to discuss the influence of stress path, water content and time, on the link between the mechanical behavior and the increment of the breakage ratio.
2 Experimental Work
We used angular sand obtained from the grinding of a quartzite shale rock from Trois Vallées quarry, in the north of France. Samples were prepared with uniform initial grain size distribution (GSD) sieved between 2 and 2.5 mm. To avoid crush-ing durcrush-ing preparation, loose samples of dry material were prepared in cylindrical moulds by pluviation at low height. As explained later, some samples were flooded with demineralized water after a phase of compression. For flooding, water was slowly added to dry samples through a pipe connected to its base, so as to main-tain a constant water level slightly over the upper level of the sample. After each test, samples were dried and accurately sieved between 2.5 and 0.08 mm.
2.1 Triaxial and Isotropic Compression Tests
Loose samples of dry material were prepared at an average void ratio of 0.937 ± 0.035 (Tests 1–8) in a cylindrical mould of 110 mm high and 70 mm in diameter. Strain controlled CID triaxial compression test at confining pressures (σ
3) of 0.4 and 0.8 MPa were performed. Volume changes of the sample were
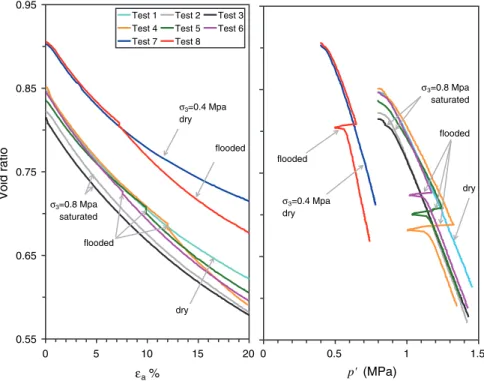
measured through the confinement water volume control system, which allows testing dry material. Some dry tests were flooded after the isotropic consolida-tion phase and others after a triaxial compression pushed up around 7–12 % of axial strain (εa) (see Tests 4, 5, 6 and 8 in Fig. 1). However, the methodology does
not allow for the verification of the degree of saturation through Skempton’s B parameter. First, the vertical strain increment was stopped and then flooding was carried out by imposing a water flow through the sample from the bottom to its top face. Then, a period of deviatoric stress (q = σ
1− σ
3
) relaxation of one hour was applied (i.e., at both constant εa and σ 3). The final εa for all triaxial tests
was 20 %. Figure 1 shows the stress-strain response in terms of the main stress (p =
σ
1+2σ
3 /3) and the void ratio. Regardless the point of flooding, the
mate-rial is more compressible after flooding. Moreover, all flooded samples at a given σ
3 joined approximately the same volumetric response and almost the same
Similarly, dry and flooded drained isotropic compression tests (with stress con-trol) at σ
3 of 0.4 and 0.8 MPa were carried out using the same sample preparation
methodology and with an average void ratio was 0.980 ± 0.088.
2.2 Oedometric Tests
Loose samples of dry material were prepared at an average void ratio of 1.018 ± 0.05 in a cylindrical oedometric device of 19 mm high and 70 mm of diameter (Tests 14–25). Stress controlled oedometric compression tests were performed using effective vertical stress levels (σ
v) from 0.15 to 2.10 MPa. 1 h
of strain stabilization was allowed for each stress step. Tests were run for three sample conditions: dry, saturated and flooded. In this case, a saturated mate-rial stands for a sample which was initially flooded, i.e., before the initial loading stage of σ
v = 0.15 MPa, even if there is no verification of Skempton’s B
param-eter. Figure 2a presents the oedometric compression curves, where it can be seen that a good repeatability was obtained. Hence, two main compression curves can be identified, one for dry conditions and the other for saturated and flooded conditions. For example, tests 23, 24 and 25 were flooded at σ
v of 0.40, 0.85 and 1.5 MPa, 0.55 0.65 0.75 0.85 0.95 0 5 10 15 20 εa % Void ratio
Test 1 Test 2 Test 3 Test 4 Test 5 Test 6 Test 7 Test 8 σ3=0.8 Mpa saturated flooded σ3=0.4 Mpa dry flooded dry 0 0.5 1 1.5 p' (MPa) σ3=0.8 Mpa saturated flooded σ3=0.4 Mpa dry flooded dry
respectively. It can be seen that those tests followed the dry compression curve and after flooding, they joined the behavior of the saturated material. Next, after flood-ing and 1 h of creep in Test 25, σ
v was increased up to 2.10 MPa and the
compres-sion curve followed the saturated material response. It has also been observed that after flooding in Test 25, the material reaches almost the same GSD that the satu-rated sample (Test 22), with more grain crushing compared to the dry case (Test 18).
2.3 Creep in Oedometric Tests
In order to study the creep behavior of the material, a second series of oedometric tests was carried out. Using the same aforementioned methodology, several loose samples at a void ratio of 1.019 ± 0.046 were prepared (Test 26–48, see Fig. 2b). This time, load was kept during 24 h of creep at each stress level. As well as for 1 h of creep in oedometric compression, we observed that regardless the point of flooding, the oedometric compression curve is unique for saturated and flooded samples. Fig. 2 Compression curves
for oedometric tests ( a) Tests 14–25 (b) Tests 26–48 0.6 0.7 0.8 0.9 1.0 1.1 0.0 0.5 1.0 1.5 2.0 Void ratio σv' (MPa) 14 15 16 17 18 19 20 21 22 23 24 25 0.6 0.7 0.8 0.9 1.0 1.1 0.0 0.5 1.0 1.5 2.0 Void ratio σv' (MPa) 26 27 28 29 30 31 32 33 34 35 36 37 38 39 40 41 43 44 45 46 47 48 (a) (b)
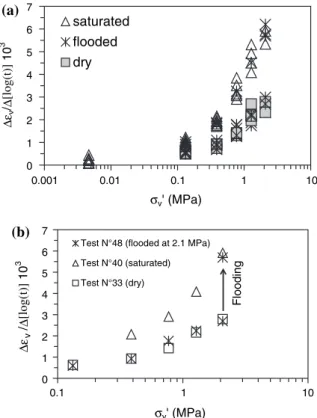
Figure 3a presents the time dependent compressibility index defined as ∆εv/
∆[log(t)] (for t in minutes and measured from 1 min to 24 h). It is clear that dry samples have a lower index and flooded ones joined the index of saturated samples after flooding. This last statement can be clearly appreciated in Fig. 3b for three representative tests at σ
vmax = 2.1 MPa.
2.4 Effect of Water in the Fracture Toughness of Rock
Samples
In order to study the effect of water at the source of the particle crushing phe-nomenon (i.e., at the individual grain scale), we have carried out crushing tests on core rock samples. We used the cracked chevron notched Brazilian disc (CCNBD) method to obtain KIC, as suggested by Fowell (1995). This method gives
consist-ent fracture toughness values and allows testing rock anisotropy since the crack orientations can be easily arranged. The notch cut along the core diameter causes crack propagation to start at the tip of the notch and to proceed radially outwards in a stable fashion until the point where the fracture toughness is obtained.
Fig. 3 Creep compressibility
0 1 2 3 4 5 6 7 0.1 0.001 0.01 1 10 σv' (MPa) ∆εv /∆ [log(t)] 10 3 saturated flooded dry 0 1 2 3 4 5 6 7 0.1 1 10 σv' (MPa) ∆εv /∆ [log( t)] 10 3
Test N°48 (flooded at 2.1 MPa) Test N°40 (saturated) Test N°33 (dry)
Flooding
(a)
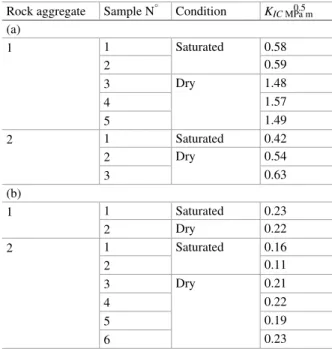
We machined rock cores of D = 52 mm in diameter, following both parallel and orthogonal orientations with respect to the rock anisotropies composed by the sheeted structure of the shale rock. We have conducted tests on air-dried samples, as well as samples submerged under water during 24 h before testing. Core samples were num-bered according to two coarse rock aggregates from they were machined. Due to the heterogeneity of the shale rock and in order to clearly identify the effect of water in KIC, in this paper we only compare cores coming from the same aggregate. Table 1
summarize the experimental results, which are in the same order of magnitude of typi-cal values for shale rocks reported in the literature of around KIC = 0.5–1.0 MPa m0.5
(Ashby and Jones 2006). For orthogonal orientated cores coming from aggregate N°1 we obtained an average reduction of approximately 60 % from dry to saturated speci-mens. Similarly, the reduction for orthogonal orientated cores from aggregate N°2 was about 20–30 %. On the other hand, in parallel orientated samples KIC drops
signifi-cantly compared to the previous case, due to the induced chevron notch on the weakest plane of the rock. Moreover, the difference between dry and saturated specimens is less important compared to orthogonal orientated cores.
3 Conclusions
The experimental data presented in this paper show that saturated and flooded crushable sand samples are more compressible than dry samples, mainly due to the increment of grain crushing in the presence of water. This phenomenon could Table 1 KIC of CCNBD
specimens with (a) orthogonal and (b) parallel core orientation
Rock aggregate Sample N° Condition KIC MPa m0.5
(a) 1 1 Saturated 0.58 2 0.59 3 Dry 1.48 4 1.57 5 1.49 2 1 Saturated 0.42 2 Dry 0.54 3 0.63 (b) 1 1 Saturated 0.23 2 Dry 0.22 2 1 Saturated 0.16 2 0.11 3 Dry 0.21 4 0.22 5 0.19 6 0.23
be explained due to corrosive attacks of water at the micro-cracks scale inside the particles. As shown experimentally, this phenomenon implies a reduction of parti-cle strength, and accordingly of KIC, in saturated rock aggregates compared to dry
ones.
Our results also show that, for given initial conditions (GSD and density) and compression state (stress path and p
max), the compression curve in the void ratio—p plane of flooded and saturated samples is virtually the same, regardless
the loading-flooding sequence. It is well known that, at a given stress state, the more polydisperse the GSD is, the higher the packing density will be (Biarez and Hicher 1997). Therefore, the uniqueness of the compression curve of saturated and flooded sand tests can be explained because they have reached the same GSD, which has been possible due to grain crushing.
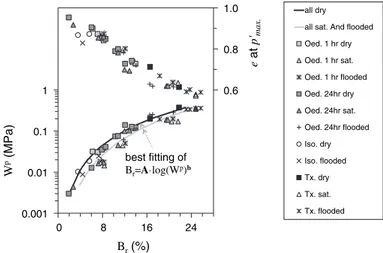
Figure 4 presents the breakage ratio (Br) after each test (using the definition of
Einav 2007) as a function of the plastic work (Wp) for all tests presented in this
paper (Tests 1–48). It is clear that dry materials (squares symbols) require more Wp in order to reach a given Br, compared to saturated and flooded cases, which
can be considered as equivalent. Consequently, for a material with a given initial density and initial GSD, the amount of particle breakage depends only on the plas-tic work and the water content.
Figure 4 also shows that the relation between Br and the lowest void ratio
attained for all tests presented here is essentially unique and it does not depend on the initial density, the loading condition (stress path, creep or relaxation) nor the test condition (dry, saturated or flooded). However, it should depend on intrinsic parameters as particle shape and initial GSD. This finding is relevant for constitu-tive modelling, since the prediction of the final GSD could be possible based on calibration tests in only one stress path. Moreover, constitutive models based on a variable critical void ratio as a function of grain crushing, as the pioneering work
0.6 0.8 1.0 0.001 0.01 0.1 1 0 8 16 24 e at p'max. W p(MPa) Br(%) all dry all sat. And flooded Oed. 1 hr dry Oed. 1 hr sat. Oed. 1 hr flooded Oed. 24hr dry Oed. 24hr sat. Oed. 24hr flooded Iso. dry Iso. flooded Tx. dry Tx. sat. Tx. flooded best fitting of Br=A·log(Wp)b
Fig. 4 Void ratio at maximum p and plastic work as a function of B
of Daouadji et al. (2001), could be enhanced in order to model the effect of water on grain crushing.
Moreover, the uniqueness of the mechanical response for flooded and saturated samples is also observed in the creep behaviour. The creep compressibility index increases with the mean stress, and for a given stress its magnitude is higher for saturated sand samples compared to dry ones. After flooding, this index increases to the same value obtained in saturated samples, analogous to the results on both the compression curve and the breakage ratio. As reported in the literature, this could be explained due to the increment of crack propagation velocity inside the grains in the presence of water (Oldecop and Alonso 2007).
References
Ashby M, Jones D (2006) Engineering materials 1, 3rd edn. Elsevier, Oxford
Biarez J, Hicher PY (1997) Influence de la granulométrie et de son évolution par ruptures de grains sur le comportement mécanique de matériaux granulaires. Revue Française de Génie Civil 1(4):607–631
Daouadji A, Hicher PY, Rahma A (2001) An elastoplastic model for granular materials taking into account grain breakage. Eur J Mech A-Solid 20:113–137
Einav I (2007) Breakage mechanics—part I: theory. J Mech Phys Solids 55(6):1274–1297 Fowell R (1995) Suggested method for determining Mode I fracture toughness using cracked
chevron notched brazilian disc (CCNBD) specimens. Int J Rock Mech Min Sci Geomech Abstr 32(I):57–64
Irwin G (1957) Analysis of stresses and strains near the end of a crack traversing a plate. J Appl Mech 24:361–364
Lade P, Yamamuro J, Bopp P (1996) Significance of particle crushing in granular materialS. J
Geotech Eng 122(4):309–316
Lee I, Coop M (1995) The intrinsic behaviour of a decomposed granite soil. Géotechnique 45(1):117–130
Oldecop L, Alonso E (2003) Suction effects on rockfill compressibility. Géotechnique 53(2):289–292
Oldecop L, Alonso E (2007) Theoretical investigation of the time dependent behavior of rockfill. Géotechnique 57(3):289–301
Ovalle C, Dano C, Hicher PY (2013a) Experimental data highlighting the role of surface fracture energy in quasi-static confined comminution. Int J Fract 182(1):123–130
Ovalle C, Dano C, Hicher P-Y, Cisternas M (2014) An experimental framework for evaluating the mechanical behavior of dry and wet crushable granular materials based on the particle breakage ratio. Can Geotech J. doi:10.1139/cgj-2014-0079
Ovalle C, Frossard E, Dano C, Hu W, Maiolino S, Hicher PY (2013b) The effect of size on the strength of coarse rock aggregates and large rockfill samples through experimental data. Acta Mech 225:2199–2216. doi:10.1007/s00707-014-1127-z

![[PDF] Cours JAVA : le type string et arraylist | Cours java](data:image/gif;base64,R0lGODlhAQABAIAAAP///wAAACH5BAEAAAAALAAAAAABAAEAAAICRAEAOw==)