HAL Id: hal-01548684
https://hal.archives-ouvertes.fr/hal-01548684
Submitted on 26 May 2020
HAL is a multi-disciplinary open access
archive for the deposit and dissemination of sci-entific research documents, whether they are pub-lished or not. The documents may come from teaching and research institutions in France or abroad, or from public or private research centers.
L’archive ouverte pluridisciplinaire HAL, est destinée au dépôt et à la diffusion de documents scientifiques de niveau recherche, publiés ou non, émanant des établissements d’enseignement et de recherche français ou étrangers, des laboratoires publics ou privés.
Distinct controls of leaf widening and elongation by light
and evaporative demand in maize
Sébastien Lacube, Christian Fournier, Carine Palaffre, Emilie J. Millet,
Francois Tardieu, Boris Parent
To cite this version:
Sébastien Lacube, Christian Fournier, Carine Palaffre, Emilie J. Millet, Francois Tardieu, et al.. Distinct controls of leaf widening and elongation by light and evaporative demand in maize. Plant, Cell and Environment, Wiley, 2017, 40 (9), pp.2017-2028. �10.1111/pce.13005�. �hal-01548684�
Version postprint
This article has been accepted for publication and undergone full peer review but has not been through the copyediting, typesetting, pagination and proofreading process which may lead to differences between this version and the Version of Record. Please cite this article as doi: 10.1111/pce.13005
Distinct controls of leaf widening and elongation by light and evaporative demand in
maize
Sebastien Lacube1, Christian Fournier1, Carine Palaffre2, Emilie J. Millet1, François Tardieu1 & Boris Parent1
1
INRA, UMR759 LEPSE, F-34060 Montpellier, France
2
INRA, UE 0394, SMH Maïs, Centre de recherche de Bordeaux Aquitaine, 40390 Saint-Martin-De-Hinx, France
Author for correspondence:
Boris Parent, Tel. : +33 499 61 31 83, Fax: +33 467 612 116, Email: boris.parent@inra.fr
Running head
Controls of leaf elongation and widening
Summary statement
Whilst an appreciable part of the variance of leaf area in the field is explained by leaf width, only few papers analysed separately the effects of environmental conditions on leaf widening and elongation.Here we show that light and evaporative demand have distinct controls on leaf elongation and widening, with very low genetic correlations. The resulting equations allowed better predictions of leaf length, width and final leaf area in contrasted environments over Europe.
Version postprint
Abstract
Leaf expansion depends on both carbon and water availabilities. In cereals, most of experimental effort has focused on leaf elongation, with essentially hydraulic effects. We have tested if evaporative demand and light could have distinct effects on leaf elongation and widening, and if short term effects could translate into final leaf dimensions. For that, we have monitored leaf widening and elongation in a field experiment with temporary shading, and in a platform experiment with 15-min temporal resolution and contrasting evaporative demands. Leaf widening showed a strong (positive) sensitivity to whole-plant intercepted light and no response to evaporative demand. Leaf elongation was (negatively) sensitive to evaporative demand, without effect of intercepted light per se. We have successfully tested resulting equations to predict leaf length and width in an external dataset of 15 field and 6 platform experiments. These effects also applied to a panel of 251 maize hybrids. Leaf length and width presented quantitative trait loci (QTLs) whose allelic effects largely differed between both dimensions but were consistent in the field and the platform, with high QTLxEnvironment interaction. It is therefore worthwhile to identify the genetic and environmental controls of leaf width and leaf length for prediction of plant leaf area.
Key words
Version postprint
Introduction
Leaf area affects the amount of light intercepted by plants, but also their transpiration. In case of drought or heat constraints, reducing leaf area reduces photosynthesis but allows plants to save water for later stages of the crop cycle without risking the over-heating that often accompanies stomatal closure (Guilioni et al., 2008). The understanding of genetic and environmental controls of leaf expansion is therefore central for assessing the trade-off between transpiration and carbon assimilation. For example, a comparison of crop models has shown that the quality of yield prediction by crop models is to a large extent linked to the quality of the modelling of plant leaf area (Martre et al., 2015).
Light and water affect leaf expansion in both monocotyledonous and dicotyledonous species. In the latter, in which leaves expand in two dimensions, light and water affect leaf expansion with markedly different periods of sensitivity within a leaf (Granier & Tardieu, 1999a, b). Young expanding leaves are affected by light through carbon starvation, whilst older expanding leaves are more affected by water via hydraulic limitations (Pantin, Simonneau & Muller, 2012, Pantin et al., 2011). In monocotyledonous leaves, which essentially grow in one dimension, leaf elongation responds to soil water deficit, evaporative demand and temperature in maize, wheat and rice (Ben Haj Salah & Tardieu, 1997, Mahdid et al., 2011, Parent et al., 2010). Light has no direct effect on leaf length (Ben Haj Salah & Tardieu, 1996, Bos, Tijani-Eniola & Struik, 2000), whereas it affects leaf width (Bos, Tijani-Eniola & Struik, 2000, Sonohat & Bonhomme, 1998). However, the effect of light on leaf growth of monocotyledons via changes in leaf width has been the object of few studies. For example, entering “leaf elongation" and "leaf widening” in The Web of Science®
(https://webofknowledge.com/) results in 3203 and 63 hits, respectively.
The hypothesis of separate controls for leaf elongation and widening of monocotyledons leaves is supported by several observations. First, final leaf width and length are largely uncorrelated in bi-parental populations (Wei et al., 2016, Yang C. et al., 2016) resulting in few overlapping QTLs in maize (Tian et al., 2011) and wheat (Yang DL. et al., 2016). Second, leaf elongation and widening occur at different places in the leaf meristematic zone (Maurice, Gastal & Durand, 1997, Muller et
al., 2007). Third, environmental variables that control length and width may differ. Differential
effects on leaf length and leaf width have been observed in response to plant density in maize (Sonohat & Bonhomme, 1998). Furthermore, leaf width variations have been shown to closely match the decrease in light interception per plant with plant density (Fournier, Andrieu & Sohbi, 2001), whereas leaf length may respond positively or negatively to increased density depending on
Version postprint
leaf rank (Song et al., 2016, Sonohat & Bonhomme, 1998). This suggests independent effects of light and water limitations.
The above paragraphs suggest a need for the reassessment of the respective roles of carbon and water supplies on leaf expansion in monocotyledons, by distinguishing their respective effects on leaf elongation and widening. This may have a large impact on (i) the modelling of environmental effects, because the response of leaf expansion would not be the consequence of a unique sensitivity to environmental conditions but the combination of the sensitivities of leaf widening and elongation; (ii) in the simulation of the genetic variability of plant leaf area, because leaf length and width may have distinct genetic controls and their sensitivities to light or water may largely differ independently in panels of genotypes.
In this study, we have first identified, via a specific experiment, the phenological phases during which leaf widening and elongation occur. We have then analysed the dynamic responses of leaf widening and elongation to light and evaporative demand in two experiments. We have finally tested to what extent the equations derived from dynamic analyses allow simulation of leaf length and width in 15 field experiments in Europe and 6 experiments in controlled environment. A genetic analysis performed in 251 maize hybrids in the field and in controlled environment is also presented to support the hypothesis of separate genetic controls for leaf length and width in response to light and evaporative demand.
Version postprint
Material and methods
Calculation of Intercepted radiation in the platform and in the field
In all field experiments, the amount of light intercepted by canopies was simulated by using the crop model APSIM-maize (Hammer et al., 2010) previously parameterised for the genotype B73 (Harrison
et al., 2014). Briefly, this model uses the Beer-Lambert approach, calculating intercepted light from
the leaf area index and an extinction coefficient. We used for that daily meteorological data, sowing date and sowing density, maintaining optimal water and nitrogen conditions during simulations. The amount of light intercepted by individual plants was then calculated by using plant density.
In platform experiments, the amount of light intercepted by each plant was estimated as in Cabrera-Bosquet et al. (2016). Briefly, 3D plant architectures (point cloud with resolution = 0.512 cm3) were obtained from binarized RBG images with a space carving algorithm (Kutulakos & Seitz, 2000). These 3D plants were used to reconstruct the 3D maize canopy in the platform during the whole experiment. Intercepted light was calculated by using the RATP model (Sinoquet et al., 2001).
Timing of leaf elongation and widening
An experiment was performed in Mauguio (France, near Montpellier, SI Table S1) with the hybrid Déa at a density of 10 plants m-² irrigated twice a week. Incident radiation was measured every 15 minutes (LI-190SB, Li-Cor, Lincoln, USA), together with air humidity and temperature (HMP35A Vaisala Oy, Helsinki, Finlande; SI Table S1 and SI Table S3). Leaf appearance rate was measured in a set of 10 plants by scoring phenological stages every second day over the whole experiment. Destructive plant measurements were carried out on 10 plants every second day. Sampled plants were chosen to represent the median of phenological stage over the whole field. For each plant, width and length of each leaf were measured after plant dissection, thereby allowing measurement of leaves enclosed in the whorl. This was performed with a ruler when leaves were more than 4-mm long, and with image analysis connected to a binocular lens (Bioscan-Optimas V 4.10, Edmonds, WA) otherwise.
Daily mean values of leaf length and maximum width were used to estimate the increase in width and length over time. To compare chronological patterns of leaf width and length on the same scale, data were first normalized by the maximum width or length. A curve was then fitted on time courses with a local regression model (‘loess’ function in R, – span = 0.6). Thermal time was calculated as in the APSIM model (Hammer et al., 2010).
Version postprint
Dynamic response of leaf elongation rate to environmental conditions
Three plants of the hybrid Déa were grown under well-watered conditions in a soil 40/60% (v/v) of clay and organic compost (SI. Table S3), in the greenhouse of the phenotyping platform PhenoDyn (Montpellier, France - https://www6.montpellier.inra.fr/lepse/M3P - SI.Table S2). The photoperiod was 14 hours day and 10 hours night with additional light used between 7h to 20h when light was below 450 W.m-². Air temperature oscillated naturally during the day but was kept above 15°C at night and below 28°C during the day (mean value of 20.4 °C), and VPD reached 3.5 kPa in some afternoons (mean value of 0.54 kPa). Air humidity, air temperature (HMP35A Vaisala Oy, Helsinki, Finland) and leaf temperature (thermocouples) were measured every 15 minutes. Leaf elongation rate (LER) was measured every 15 min with rotating displacement transducers (RDTs 60-1045 Full Smart Position Sensor; Spectrol Electronics, Ltd, Wiltshire, England) as in Sadok et al. (2007). Plants were maintained at a soil water potential higher than -0.05 MPa via automatic irrigation. LER of leaf 6 was measured from leaf 6 appearance for 4 days (during stable maximum leaf elongation rate) with contrasted leaf-to-air vapour pressure deficit (VPDla) defined as the difference between
saturation at leaf temperature (estimated as in Millet et al., 2016) and actual vapour pressure in the air. LER was expressed per unit of thermal time at each 15 minute time step, with thermal time calculated as in the APSIM model (Hammer et al. 2010). The response of LER of leaf 6 to VPDla was
estimated by using LER and VPDla data at the time step of 15 min for the 3 plants from 14h to 17h,
i.e. during daily peaks of vapour pressure deficit. Because the relationship was tight (see results), this resulted in an equation relating LER to VPDla.
(Eq. 1)
With ai (mm °Cd -1) the potential leaf elongation rate for the considered leaf rank i in well-watered
conditions and low evaporative demand, and b (mm °Cd -1 kPa-1) the sensitivity of LER to evaporative demand (leaf-to-air vapour pressure deficit VPDla), considered common for all leaf ranks. This
equation was fitted on leaf 6 results, thereby allowing estimation of a6 and b. The potential LER for
each leaf (ai) was inferred from a6 for each leaf rank i by using relationship of Chenu et al. (2008). At
each time t between beginning and end of leaf elongation, the lamina length of leaf rank i (Li) was
simulated as the cumulated leaf elongation rate at each time step:
(Eq. 2)
Version postprint
Dynamic responses of leaf length and width to light
An experiment was performed in Grignon (France, near Paris, SI Table S1) with the hybrid Déa at a density of 10 plants m-². The field (deep clay loam) was fully irrigated for the whole experiment. Minimum, maximum temperatures, incident light and VPD were recorded every day. Temperature varied naturally from 0.0°C to 25.2°C with mean value of 8.8°C and VPD reached 2.6 kPa (mean value, 0.5 kPa).Three plots of 10 plants were marked at emergence for identification of phenological stages (leaf tip and ligule appearances) every second day on ten plants per plot before the onset of experimental treatments.
One plot stayed under normal light conditions during the whole experiment (“Light”, daily mean value of 16.6 MJ m-2). The second plot was shaded from leaf-6 emergence to the end of the experiment with a horticultural net transmitting 20% of light for all wavelengths in the visible spectrum, placed at 30 cm above plant tops (“Shaded”). The same shading nets were used for the last treatment, alternating light and shade conditions (“Alternated”) by placing and removing the nets : shade from leaf 6 to leaf 10 emergence, normal light conditions from leaf 10 to leaf 14 emergence, and shade conditions afterwards. Final individual leaf area and shape were measured for all leaves of all plants at the end of stem growth by image analysis (Sinoquet, Moulia & Bonhomme, 1991).
A position-time model was established to relate each longitudinal position on the leaf to the time when the considered leaf element left the leaf growing zone because it was pushed by younger elements (Ben Haj Salah & Tardieu, 1995, Silk, 1992). Thegrowing zone is located in the first 8 cm beyond the leaf insertion point in maize (Tardieu et al., 2000). Leaf elongation rate was simulated by using Eq. 1, for which leaf length was predicted every hour from the beginning to the end of linear leaf elongation (Eq. 2). The beginning of leaf linear elongation was calculated as the time when the leaf reached 8 cm, estimated for each leaf as in Chenu et al. (2008). A relationship could therefore be established, for each time step, between leaf length and time after beginning of leaf linear elongation. Each longitudinal position along the leaf could therefore be attributed a time after the corresponding leaf element left the leaf growing zone (see Ben Haj Salah & Tardieu, 1995). We could therefore predict at which time the width at any leaf position was produced and identify the environmental conditions at that time, and finally relate these conditions to the width at the corresponding position. This has been performed for leaves 6 to 9 in the three treatments.
At each time after beginning of linear leaf elongation, a ratio was defined for comparing leaf widths produced in the alternated treatment to those in the shade and light treatments.
Version postprint
Width ratio = (Walternated – Wshade) / (Wlight – Wshade) (Eq.3)
This ratio is equal to 0 when leaf width of plants in the alternated treatment matches that of shaded plants and 1 when it matches that of plants under full-light.
Because we observed a dynamic relationship between leaf widening and whole-plant intercepted light during the period of widening, this resulted in the equation:
(Eq. 4)
With Wmini the x-intercept (minimum leaf width under low light) or the considered leaf i, and k the
sensitivity to intercepted radiation, considered common for all leaves.
External dataset in the platform and the field
Fifteen field experiments were carried out in a West-East transect across Europe and one site in Chile in 2011 to 2013 (DROPS network – Millet et al., 2016, SI.Table S1, SI.Table S3) with the maize hybrid B73 x UH007 (named 'B73' afterwards). Soil water status was measured every second day and maintained higher than -0.1 MPa by irrigation (SI. Table S3). Nitrogen and pesticides application were performed following local practices. Air temperature and humidity, wind speed and incident light were recorded every hour in each experiment. Raw measurements were first converted to common units and compared to local meteorological data to assess the dataset (Millet et al. 2016). Vapour pressure deficit was calculated hourly using temperature and humidity, corrected by radiation in low light conditions as in Chenu et al. (2008). Environmental conditions are summarised for each experiment in SI.Table S3. The network of field experiments showed a large variety of scenarios of temperature, vapour pressure deficit and incident light through the growing season as presented in Millet et al. (2016) (detail in SI Table. S3). In each of the 15 experiments, the final length (from ligule to leaf tip) and final width (maximum over the leaf) of leaves 8 to 11 were measured in 10 plants per experiment.
Six experiments were carried out in the phenotyping platform PhenoArch (Montpellier, France, Cabrera-Bosquet et al., 2016; https://www6.montpellier.inra.fr/lepse/M3P) from 2011 to 2016, during different seasons of the year (SI. Table S2). Three seeds per pot of the hybrid B73 were sown at 0.025m depth, and thinned to one plant per pot at three-leaf stage. Plants were grown in 9L PVC pots in a substrate composed of a mixture of clay and organic compost (30/70 volume). Soil water content was maintained at retention capacity in each pot by daily watering (soil water potential of -0.05MPa). Briefly, the PhenoArch platform is equipped with automated weighting and watering stations, imaging stations and environmental sensors. For each plant, 13 RGB images (2056×2454
Version postprint
pixels) were taken every night (one from top and 12 side images with a 30° horizontal rotation). Temperature and VPDla were recorded every 15 min in 8 sites of the greenhouse (SI. Table S3).
Incident light was estimated at each individual plant position as in Cabrera-Bosquet et al. (2016) from incident light outside the greenhouse and local extinction coefficients. Daily mean temperature in the greenhouse was 18 ± 2 °C (night) and 25 ± 3°C (day), with small differences between experiments. Incident light varied between experiments, with maximum values (7.7 MJ.m-².day-1) was measured in Spring 2016 and lowest in Autumn 2011 (2.8 MJ.m-² day-1).
The B73 hybrid was grown in all experiments (from 2 to 3 replicates, SI. Table S2), together with other 251 hybrids (Millet et al. 2016) (SI.Table S2). In each experiment, leaf width was measured on hybrid B73 by image analysis on ligulated leaves from rank 7 to 12 for 2 to 5 plants per experiment (SI. Method S1). It was compared to planimeter measurements (LI-3100C Area Meter) in plants of the experiment Spr16 (R² = 0.93, not shown).
The dynamic relationships determined previously (Eq.1 and Eq.4) were tested in this external dataset. We have first tested over the whole dataset the relationships between final dimensions and environmental variables, considering a unique sensitivity to environmental conditions for all leaves. Environmental variables were calculated as the conditions sensed by plants during the growth of each individual leaf. The effect of leaf rank was calculated as the intercept of the relationship for each leaf. The test of the model itself consisted in simulating final leaf dimensions with the equations determined in dynamic experiments (Eq. 1 and Eq. 4) and comparing with observed values.
Genetic analyses
Experiments were performed in the field and in the platform with a panel of 251 maize hybrids (DROPS panel – Millet et al. 2016) obtained by crossing 251 dent lines with a common flint parent (UH007). The panel structure is further described in Millet et al. (2016). In the field (Saint-Martin de Hinx (France, SI.Table S1), plants were sown on 12th May at a density of 8.5 plants m-2 with 10 plants of each genotype sown in a row and soil water status maintained at high values by irrigation. Environmental conditions and crop management were collected as above and are summarised in SI.Table S3. The leaf length and width of leaves 7 to 10 were measured within 3 days before flowering for three plants per hybrid. Leaf width and length were also measured in the platform experiment on the 251 genotypes (Exp. Spr16) for leaves 7 and 8.
Genotypic means were calculated for each hybrid using a mixed model based on spatial design:
Version postprint
where is the vector of phenotypic observations in a given experiment, is the vector of fixed genotypic effect, and and are vectors of random column and row effects, which are used to capture linear trends that might exist across rows and columns. The residual error was assumed to follow a zero mean multivariate normal distribution, with covariance determined by autoregressive processes of order one in the row and column direction. Calculations were performed with ASReml-R (Butler et al., 2009). Narrow-sense heritability was estimated with a model assuming additive SNP effects using the R-package Heritability (Kruijer et al., 2015).
Lines were genotyped using a 50K Infinium HD Illumina array (Ganal et al., 2011), and a 600K Axiom Affymetrix array (Unterseer et al., 2014). The genetic analysis was performed with the single-environment method (GWAS, Genome Wide Association Study) presented in Millet et al. (2016) with FaST-LMM v2.07 (Lippert et al., 2011) on individual traits for each experiment using the single locus mixed model:
(Eq. 6)
where is the vector of phenotypic values, the overall mean, is the vector of SNP scores, is the additive effect, and and represent random polygenic and residual effects. The variance-covariance matrix of was determined by a genetic relatedness (or kinship) matrix, derived from all SNPs except those on the chromosome containing the SNP being tested as described in Millet et al. (2016) following the method of Rincent et al. (2014). The SNP effects were estimated by generalized least squares, and their significance (H0: = 0) tested with an F-statistic. Candidate SNPs
distant less than 0.1 cМ were considered as belonging to a common QTL, described via the most significant SNP in the QTL and the interval between all SNPs belonging to the QTL. Co-localisations between QTLs were checked by comparing QTLs intervals and checking for overlap (defined by all SNPs contained in the QTL). Physical positions of significant SNPs were projected on the consensus genetic map for Dent genetic material (Giraud et al., 2014).
Version postprint
Results
Different time courses for leaf elongation and widening.
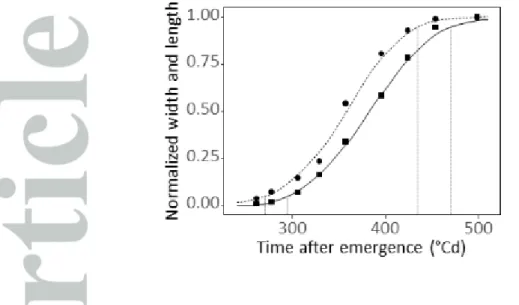
The time courses of elongation and widening were analysed in a field experiment in which leaves 8 to 11 of ten plants were sampled every second day from leaf initiation to end of elongation, after dissection of the plant whorl. The increase in leaf length, defined as the distance from the leaf insertion point to the tip, was delayed compared to the increase in leaf width (Fig. 1). The beginning of rapid elongation (5% of final leaf length) occurred 35°Cd later than the beginning of rapid leaf widening (5% of final leaf width). Cessation of elongation (95% of final length) occurred 39°Cd after cessation of widening. This temporal pattern, presented in Fig. 1 for leaf 8, was also observed in leaves 6, 7, 9, 10 and 11 (SI Fig.S1). In analyses presented below, the effects of environmental conditions were therefore tested during the respective periods corresponding to 5-95% of either elongation or widening.
Leaf width increased with intercepted light with no effect of evaporative demand
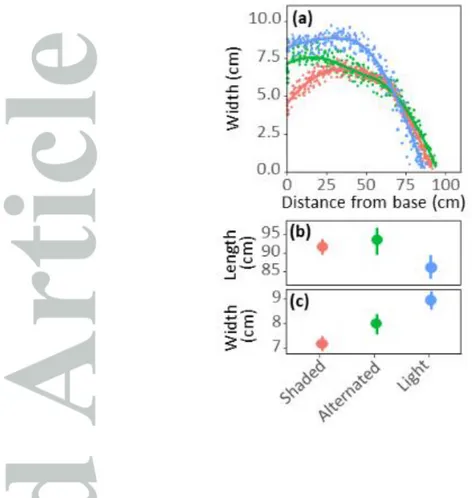
Shading largely affected leaf width in a field experiment where plants were grown either under natural light conditions (“Light”), shaded (80% light attenuation from the appearance of leaf-6 tip onwards, “Shaded”) or undergoing alternating periods of normal light and shade (“Alternated”), with shading from leaf-6 appearance to leaf-10 appearance and from leaf-14 appearance onwards (Fig.2, 3). Plants with maximum incident light had wider leaves than those permanently shaded (Fig.2c; SI.Fig.2). Shading during part of the period of leaf widening (Fig.3a) resulted in intermediate values (Fig.2c) and suggested a dynamic effect because differences between treatments changed with time (Fig. 2a). This effect was analysed via a position-time model that allowed associating each longitudinal position on the leaf to a time after beginning of linear elongation. New cells are continuously produced in the 3-cm-long meristem close to the leaf insertion point and flow through the 8-cm-long growing zone to mature zones (Tardieu et al., 2000). One can therefore assign, to each longitudinal position on the leaf (Fig.2a), a time after the considered cells have left the elongation zone (Eq. 1 and 2, SI.Fig.3). A width ratio (Eq.3) was defined for comparing leaf widths in the three treatments at any longitudinal position of the leaf. It equalled 100% if width were equal in 'Alternated' and 'Light' treatments and 0% if width were equal in 'Alternated' and 'Shaded' treatments (Fig. 3a). This was performed for leaves 7 to 9 whose development phases were shifted by 35 °Cd per leaf rank.
The width ratio of leaf 7 rapidly decreased when plants were shaded and increased after full light was restored (Fig. 3a). Because the beginning of leaf expansion differed for each leaf rank, leaves of
Version postprint
different ranks underwent different timing of full-light and shading in the 'Alternated' treatment. The width of leaf 8 decreased when plants were shaded and increased under full light after a lag time. Leaf 9 started growth just before full-light, with rapid increase of the width ratio, followed by a stabilization of this ratio at the beginning of the second period of shading. Overall, the final leaf width corrected for the effect of leaf rank was closely related to the cumulated light intercepted per plant for the period with maximum widening rate (Fig 3b; calculated with the crop model APSIM-maize). It is noteworthy that a common calculation was adopted for intercepted light per plant in the three treatments without considering the effect of light on leaf width, to avoid circular reasoning (i.e. effect on light interception on leaf width and effect of leaf width on light interception).
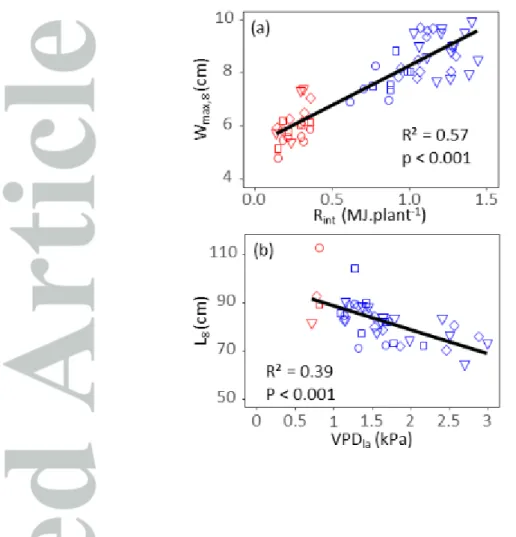
The validity of the relationship between intercepted light per plant and leaf width (Fig. 3b; Eq.4) was tested in an external dataset of 15 experiments in the field and six experiments in the phenotyping platform. A large range of environmental conditions was observed (SI. Table 3), with lower values of intercepted light per plant and evaporative demand in the greenhouse than in the field. Leaf width was significantly higher in the field than in the greenhouse for leaves 8 to 11 (50% of mean values for each leaf rank, SI. Fig.4). For a given leaf rank, it was closely related to the amount of light intercepted by plants for the period elapsing from 5% to 95% final width. A common relationship between leaf width and intercepted light per plant accounted for variations in width between field experiments and for the difference between field and greenhouse (Fig. 4a). Leaf width was also negatively related to minimum and mean temperatures (Table 1), probably via the effect of temperature on the amount of light intercepted over the considered period of development. Indeed, because the latter has a constant duration in thermal time, its duration in calendar time decreased with temperature. Leaf width showed no relationship with vapour pressure deficit (Table 1).
Leaf length decreased with evaporative demand and light
Leaf elongation was analysed in the shading experiment presented above and in one experiment in controlled environment. In the latter, the elongation rate of leaf 6 was maximum during the night, with no light and low VPDla, and minimum during periods with high light and VPDla. Plants reacted
within minutes after changes in environmental conditions with a strong negative effect of VPDla on
leaf elongation rate (Fig. 5a,b). Leaf elongation rate measured every 15 min was closely related with VPDla over the same periods (Fig. 5c), probably via a negative hydraulic effect decreasing leaf water
potential in the leaf growing zone (Tardieu, Simonneau & Parent, 2015).
Shading had opposite effects on leaf length and width in the shading experiment (Fig.2b,c, Fig.S2). Final leaf length of plants growing under shading was longer by 6 to 14 cm compared to those grown
Version postprint
under full light, with intermediate values for alternated shading (Fig. 2b). In the platform experiment, light had a negative effect on leaf elongation rate, probably via its contribution to VPDla
due to leaf heating and, eventually, its effect on leaf water potential (Ben Haj Salah & Tardieu, 1996). We have tested if the relationship between leaf elongation rate (LER) and VPDla in the greenhouse
(Eq. 1) may account for variations of final leaf length in 15 experiments in the field and one experiment in the platform. Final leaf length was closely related to the mean value of afternoon VPDla over the period of maximum leaf elongation. The latter was calculated in each field based on
the thermal times at which leaf length reached 5 and 95% of their final values according to Fig. 1. A clear relationship was observed between fields, which also accounted for the difference between field and greenhouse (Table 1 and Fig. 4b). Final leaf length had no relationship with intercepted light per plant or with mean temperature over the same period.
Taking into account environmental effects on leaf length and width largely improved the prediction of individual leaf area.
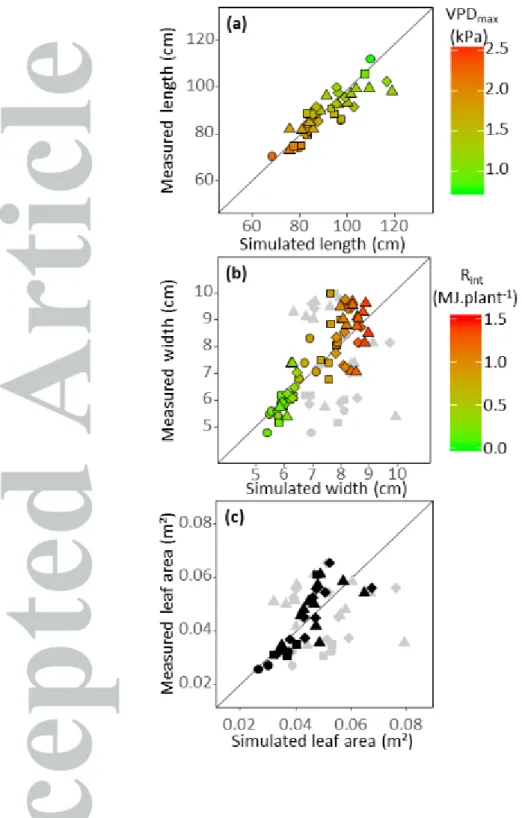
The results presented above resulted in Eq. 1 to 4, with parameters established in short term experiments. These equations adequately predicted leaf length and width observed in the independent dataset of field and platform experiments carried out over the whole vegetative period (Fig. 4) with CV of 7% and 11% for leaf length and width, respectively. The model of leaf width based on intercepted light captured a large part of the observed variance, with predictions highly improved (R2 =0.71, CV of error = 11%) compared to the algorithm in which leaf width would be considered as proportional to leaf length (R2 = 0.01, CV of errors = 26%). This resulted in an adequate prediction of individual leaf area in the whole field dataset (Fig. 6c, R2=0.62, CV = 16%), compared to the model in which leaf width was calculated as a proportion of leaf length (R2=0.04, CV = 34% ).
The genetic controls of leaf length and width were largely independent, with consistent allelic effects in field and platform experiments.
Genetic analyses were performed on the mean length and width of leaves 7 and 8 in the platform and of leaves 8 to 10 in the field, in a panel of 251 maize hybrids. Heritabilities were medium to high, except for width measured in the field (Table 2b). The width of leaf 8 largely varied from 5.1 to 9.9 cm in the field and from 5.6 to 8.3 cm in the platform. Correlations between leaf width and leaf length were low in both platform and field experiments (R2 = 0.001 and 0.26, Table 2). Measured leaves were longer and narrower in the platform than in the field (respectively +30% and -26% for leaf 8; mean value for all genotypes), consistent with the difference in intercepted light per plant
Version postprint
and evaporative demand (Fig. 7). Hence, the effects studied in detail in one hybrid applied to the whole panel.
GWAS analysis led to the identification of twenty nine and fourteen significant QTLs in our dataset for leaf width and leaf length, respectively, either in the field or in the platform (Table 3).
We have first tested if QTLs that affected leaf length or leaf width in the field also affected the same trait in the platform and vice versa. For that, we have considered allelic effects of all QTLs in field and platform, regardless of their significance in the considered condition (by allelic effect, we mean the effect of the allele of the reference hybrid B73 vs the other allele at each QTL, expressed as a percentage of the general mean). This can be visualized in Table 3 (upper part) in which the allelic effects of the 15 QTLs of leaf width identified in the field are also presented for leaf width in the platform and the 15 QTLs identified for leaf width in the platform are also presented for the field. A visual inspection shows that QTLs that positively affected leaf width in one environment also positively affected it in the other one (consistent colours in Table 3). Allelic effects had contrasting amplitudes in the field and in the platform, so most significant QTLs in the field did not reach the threshold of significance (only one colocation of significant QTLs). However, allelic effects were clearly correlated between experiments, for instance allelic effects of QTLs of width identified in the platform were highly correlated with allelic effects of the same QTLs in the field (R2=0.88, and R2=0.68 for the reciprocal analysis). The same conclusion applied to QTLs of leaf length, in which the nine QTLs of leaf length identified in the field also affected leaf length in the platform, with consistent signs of allelic effects and a high correlation (R2=0.91, and R2=0.91 for the reciprocal analysis). Hence, we can conclude in a largely common genetic control in the field and in the platform for both leaf width and leaf length, in spite of a high QTL x experiment interaction.
We have then tested if QTLs of leaf width also affected leaf length and vice versa. Overall, this was not the case because QTLs which had high allelic effects on leaf width had small effects on leaf length and vice versa (R2=0.18). This can be visualized in Table 3 via the difference in colour and colour intensity between the left and right parts of the table. Hence, we can conclude that the genetic controls of leaf width and leaf length were largely independent.
Version postprint
Discussion
This study reconciles the results on the effects of light interception on leaf growth in dicotyledonous and monocotyledonous species. Whereas a clear effect was shown in dicotyledonous species (Granier & Tardieu, 1999a,b, Pantin, Simonneau & Muller, 2012, Pantin et al., 2011), most physiological studies on monocotyledons concluded in a strong effect of hydraulics and an absence of effect of intercepted light (Ben Haj Salah & Tardieu, 1997, Mahdid et al., 2011, Parent et al., 2010). This was because leaf width was not taken into account in these studies. Here, both short-term dynamic experiments and statistical analyses of a large dataset in the field and in phenotyping platform conclude in a clear effect of light interception on the growth of individual leaf area.
Leaf width and length are under different genetic and physiological controls. The lack of genetic correlation between length and width is consistent with studies on biparental populations (Wei et
al., 2016, Yang C. et al., 2016), but this study extends them to the dent maize populations originating
from breeding programmes in the USA and Europe and, potentially, to the whole maize species. We also confirm the large variability of leaf width from both genetic and environmental points of view. Within the few studies considering leaf width, most of them have shown that a larger part of variance of individual leaf area in biparental population was explained by leaf width compared to that by leaf length (Wei et al., 2016, Yang C. et al., 2016). This contrasts to a study in wheat (Yang DL.
et al., 2016), working with biparental population found that leaf width was less variable compared to
leaf length. In our diversity panel, we found an even larger importance of leaf width on individual leaf area compared to that of leaf length (85% vs 15 % of explained variance). Several underlying mechanisms could explain the differences in responses of leaf elongation and widening. It has been shown that lower water status results in shorter cells in maize (Ben Haj Salah et al., 1997) but at the present time and in our knowledge, there is no evidence in favour of the hypothesis of larger cells of more cell rows due to higher intercepted radiation.
The impact of variation of leaf width in multi-environment field trials was also larger than expected. It contrasted with the results of Chenu et al. (2008) that did not take into account the variations of leaf width for predicting plant leaf area in Australian maize experiments, but still obtained an adequate prediction of leaf area. We can hypothesise that fields in Australia received high and relatively similar light, resulting in similar leaf widths. Conversely, the experiments presented here, which covered a large part of the European maize growing area presented large differences in light, resulting in large impacts on leaf width and area. Overall, this study to some extent reconciles the results of short-term experiments, which have focused on leaf length with essentially hydraulic effects, with those of a family of crop models that involve carbon supply in the control of leaf area.
Version postprint
Indeed, short-term experiments found an effect of intercepted light per plant on leaf area, provided that leaf width is taken into account.
Extrapolating relationships observed at different levels of integration (temporal, spatial) was successful here although they are largely debated (Passioura, 1996, 2007, Poorter et al., 2016). Indeed, many processes show trades-off between rates and duration. For instance, temperature has a large effect on leaf elongation rate of several species, but a very low effect on final length because of a total compensation of rate by duration (Parent & Tardieu, 2012). The success in the upscaling performed here probably involves that such compensations had a minor role in the effects of environmental conditions on leaf width and length. This opens the way to a dialogue between platform and field experiments for the prediction of the genetic variability of the control of leaf growth, in spite of the fact that traits largely differ between field and controlled environment (Poorter et al., 2016).
A crucial question in crop modelling is whether adding complexity to the system could significantly improve simulations (Parent et al., 2016). It is therefore a relevant modelling question if both leaf widening and elongation have to be considered compared to simpler formalisms. At present, in most crop models, two categories of algorithms have been proposed, giving contrasting roles for water vs carbon availabilities in the control of leaf growth. The first category considers that the sensitivity of leaf expansion to environmental conditions is indirect and acts through photosynthesis and carbon allocation (e.g. GECROS; Yin & van Laar, 2005). The second category considers direct empirical responses to environmental conditions, regardless of carbon availability, either at the whole-plant level (big leaf models, e.g. APSIM-maize, Hammer et al., 2010) or at individual leaf level. (e.g. Chenu
et al., 2008, Lawless, Semenov & Jamieson, 2005, Lizaso et al., 2003, 2011). All these models
consider the expansion of individual leaf area as a whole, thereby implicitly considering that, in monocotyledons, differential responses of leaf widening and elongation to environmental variables do not need to be distinguished. The same implicit assumption can be found in (Chenu et al., 2008, 2009) that simulated the impact of QTLs of maize leaf elongation on yield, without considering that leaf width may respond differentially to environment. By contrast, this study shows that it can be a relevant choice to consider separately leaf widening and elongation in the range of studied situations and genotypes, which caused large variations of leaf width. Because the quality of simulations of crop models are linked to the goodness of leaf area predictions (Martre et al., 2015), we propose that identifying leaf widening and elongation in a plant model and therefore improving leaf area predictions could significantly improve predictions This conclusion is consistent with physiological considerations, namely that the controls of carbon-driven and hydraulic- driven
Version postprint
mechanisms at the cellular scale, are under the control of very different genes, and translating into contrasted sensitivities of final leaf length and width to environmental conditions in different genotypes.
Acknowledgements
This work was supported by the EU FP 7 project FP7-KBBE-244374 and the the Agence Nationale de la Recherche project ANR-10-BTBR-01 (Amaizing). Authors are grateful to Llorenç Cabrera and Antonin Grau for help in platform experiments, and to Aude Coupel-Ledru for genetic analyses. The matrices of genotypic data were built by Sandra Negro, Stephane Nicolas and Alain Charcosset, INRA Le Moulon. The field experiment in Grignon was supervised by Bruno Andrieu, and supported by Agence de l'Environnement et de la Maîtrise de l'Energie (ADEME), with experimental help of Pierre Bonchrétien and Michel Lauransot.
Author Contributions
S.L. analyzed most data
C.F. performed dynamic experiments on width
C.P supervised the field experiments for genetic analyses E.M. analyzed data on mapping population
B.P. and F.T. planned and designed the research B.P., S.L. and F.T. wrote the manuscript.
Version postprint
References
Ben Haj Salah H. & Tardieu F. (1995) Temperature affects expansion rate of maize leaves without change in spatial-distribution of cell length - analysis of the coordination between cell-division and cell expansion. Plant Physiology, 109, 861-870.
Ben Haj Salah H. & Tardieu F. (1996) Quantitative analysis of the combined effects of temperature, evaporative demand and light on leaf elongation rate in well-watered field and laboratory-grown maize plants. Journal of Experimental Botany, 47, 1689-1698.
Ben Haj Salah H. & Tardieu F. (1997) Control of leaf expansion rate of droughted maize plants under fluctuating evaporative demand - A superposition of hydraulic and chemical messages? Plant
Physiology, 114, 893-900.
Bos H.J., Tijani-Eniola H. & Struik P.C. (2000) Morphological analysis of leaf growth of maize: responses to temperature and light intensity. Netherlands Journal of Agricultural Science, 48, 181-198.
Butler D.G., Cullis B.R., Gilmour A.R. & Gogel B.J. (2009) Mixed models for S language environments.
ASReml-R reference manual. Queensland Department of Primary Industries and Fisheries.
Cabrera-Bosquet L., Fournier C., Brichet N., Welcker C., Suard B. & Tardieu F. (2016) High-throughput estimation of incident light, light interception and radiation-use efficiency of thousands of plants in a phenotyping platform. New Phytologist, 212, 269-281.
Chenu K., Chapman S.C., Hammer G.L., McLean G., Salah H.B.H. & Tardieu F. (2008) Short-term responses of leaf growth rate to water deficit scale up to whole-plant and crop levels: an integrated modelling approach in maize. Plant Cell and Environment, 31, 378-391.
Chenu K., Chapman S.C., Tardieu F., McLean G., Welcker C. & Hammer G.L. (2009) Simulating the Yield Impacts of Organ-Level Quantitative Trait Loci Associated with Drought Response in Maize - A ‘Gene-to-Phenotype’ Modeling Approach. Genetics, 183, 1507–1523.
Fournier C., Andrieu B. & Sohbi Y. (2001) Virtual plant models for studying interactions between
crops and environment.
Ganal M.W., Durstewitz G., Polley A., Berard A., Buckler E.S., Charcosset A., Clarke J.D., Graner E.M., Hansen M., Joets J., Le Paslier M.C., McMullen M.D., Montalent P., Rose M., Schon C.C., Sun Q., Walter H., Martin O.C. & Falque M. (2011) A Large Maize (Zea mays L.) SNP Genotyping Array: Development and Germplasm Genotyping, and Genetic Mapping to Compare with the B73 Reference Genome. Plos One, 6.
Giraud H., Lehermeier C., Bauer E., Falque M., Segura V., Bauland C., Camisan C., Campo L., Meyer N., Ranc N., Schipprack W., Flament P., Melchinger A.E., Menz M., Moreno-Gonzalez J., Ouzunova M., Charcosset A., Schon C.C. & Moreau L. (2014) Linkage Disequilibrium with Linkage Analysis of Multiline Crosses Reveals Different Multiallelic QTL for Hybrid Performance in the Flint and Dent Heterotic Groups of Maize. Genetics, 198, 1717-+.
Granier C. & Tardieu F. (1999a) Leaf expansion and cell division are affected by reducing absorbed light before but not after the decline in cell division rate in the sunflower leaf. Plant Cell and
Environment, 22, 1365-1376.
Granier C. & Tardieu F. (1999b) Water deficit and spatial pattern of leaf development. Variability in responses can be simulated using a simple model of leaf development. Plant Physiology,
119, 609-619.
Guilioni L., Jones H.G., Leinonen I. & Lhomme J.P. (2008) On the relationships between stomatal resistance and leaf temperatures in thermography. Agricultural and Forest Meteorology,
148, 1908-1912.
Hammer G.L., van Oosterom E., McLean G., Chapman S.C., Broad I., Harland P. & Muchow R.C. (2010) Adapting APSIM to model the physiology and genetics of complex adaptive traits in field crops. Journal of Experimental Botany, 61, 2185-2202.
Version postprint
Harrison M.T., Tardieu F., Dong Z., Messina C.D. & Hammer G.L. (2014) Characterizing drought stress and trait influence on maize yield under current and future conditions. Global Change
Biology, n/a-n/a.
Kruijer W., Boer M.P., Malosetti M., Flood P.J., Engel B., Kooke R., Keurentjes J.J.B. & van Eeuwijk F.A. (2015) Marker-Based Estimation of Heritability in Immortal Populations. Genetics, 199, 379-393.
Lawless C., Semenov M.A. & Jamieson P.D. (2005) A wheat canopy model linking leaf area and phenology. European Journal of Agronomy, 22, 19-32.
Lippert C., Listgarten J., Liu Y., Kadie C.M., Davidson R.I. & Heckerman D. (2011) FaST linear mixed models for genome-wide association studies. Nature Methods, 8, 833-U894.
Lizaso J.I., Batchelor W.D., Westgate M.E. & Echarte L. (2003) Enhancing the ability of CERES-Maize to compute light capture. Agricultural Systems, 76, 293-311.
Lizaso J.I., Boote K.J., Jones J.W., Porter C.H., Echarte L., Westgate M.E. & Sonohat G. (2011) CSM-IXIM: A New Maize Simulation Model for DSSAT Version 4.5. Agronomy Journal, 103, 766-779.
Mahdid M., Kameli A., Ehlert C. & Simonneau T. (2011) Rapid changes in leaf elongation, ABA and water status during the recovery phase following application of water stress in two durum wheat varieties differing in drought tolerance. Plant Physiology and Biochemistry, 49, 1077-1083.
Martre P., Wallach D., Asseng S., Ewert F., Jones J.W., Rotter R.P., Boote K.J., Ruane A.C., Thorburn P.J., Cammarano D., Hatfield J.L., Rosenzweig C., Aggarwal P.K., Angulo C., Basso B., Bertuzzi P., Biernath C., Brisson N., Challinor A.J., Doltra J., Gayler S., Goldberg R., Grant R.F., Heng L., Hooker J., Hunt L.A., Ingwersen J., Izaurralde R.C., Kersebaum K.C., Muller C., Kumar S.N., Nendel C., O'Leary G., Olesen J.E., Osborne T.M., Palosuo T., Priesack E., Ripoche D., Semenov M.A., Shcherbak I., Steduto P., Stockle C.O., Stratonovitch P., Streck T., Supit I., Tao F.L., Travasso M., Waha K., White J.W. & Wolf J. (2015) Multimodel ensembles of wheat growth: many models are better than one. Global Change Biology, 21, 911-925.
Maurice I., Gastal F. & Durand J.L. (1997) Generation of form and associated mass deposition during leaf development in grasses: a kinematic approach for non-steady growth. Annals of Botany,
80, 673-683.
Millet E.J., Welcker C., Kruijer W., Negro S., Coupel-Ledru A., Nicolas S.D., Laborde J., Bauland C., Praud S., Ranc N., Presterl T., Tuberosa R., Bedo Z., Draye X., Usadel B., Charcosset A., Van Eeuwijk F. & Tardieu F. (2016) Genome-Wide Analysis of Yield in Europe: Allelic Effects Vary with Drought and Heat Scenarios. Plant Physiology, 172, 749-764.
Muller B., Bourdais G., Reidy B., Bencivenni C., Massonneau A., Condamine P., Rolland G., Conejero G., Rogowsky P. & Tardieu F. (2007) Association of specific expansins with growth in Maize leaves is maintained under environmental, genetic, and developmental sources of variation.
Plant Physiology, 143, 278-290.
Pantin F., Simonneau T. & Muller B. (2012) Coming of leaf age: control of growth by hydraulics and metabolics during leaf ontogeny. New Phytologist, 196, 349-366.
Pantin F., Simonneau T., Rolland G., Dauzat M. & Muller B. (2011) Control of Leaf Expansion: A Developmental Switch from Metabolics to Hydraulics. Plant Physiology, 156, 803-815. Parent B., Suard B., Serraj R. & Tardieu F. (2010) Rice leaf growth and water potential are resilient to
evaporative demand and soil water deficit once the effects of root system are neutralized.
Plant Cell and Environment, 33, 1256-1267.
Parent B. & Tardieu F. (2012) Temperature responses of developmental processes have not been affected by breeding in different ecological areas for 17 crop species. New Phytologist, 194, 760-774.
Parent B., Vile D., Violle C. & Tardieu F. (2016) Towards parsimonious ecophysiological models that bridge ecology and agronomy. New Phytologist, 210, 380-382.
Version postprint
Passioura J. (2007) The drought environment: physical, biological and agricultural perspectives.
Journal of Experimental Botany, 58, 113-117.
Passioura J.B. (1996) Simulation models: Science; snake oil, education, or engineering? Agronomy
Journal, 88, 690-694.
Poorter H., Fiorani F., Pieruschka R., Wojciechowski T., van der Putten W.H., Kleyer M., Schurr U. & Postma J. (2016) Pampered inside, pestered outside? Differences and similarities between plants growing in controlled conditions and in the field. New Phytologist, 212, 838-855. Rincent R., Moreau L., Monod H., Kuhn E., Melchinger A.E., Malvar R.A., Moreno-Gonzalez J., Nicolas
S., Madur D., Combes V., Dumas F., Altmann T., Brunel D., Ouzunova M., Flament P., Dubreuil P., Charcosset A. & Mary-Huard T. (2014) Recovering Power in Association Mapping Panels with Variable Levels of Linkage Disequilibrium. Genetics, 197, 375-387.
Silk W.K. (1992) Steady form from changing cells. International Journal of Plant Sciences, 153, S49-S58.
Sinoquet H., Le Roux X., Adam B., Ameglio T. & Daudet F.A. (2001) RATP: a model for simulating the spatial distribution of radiation absorption, transpiration and photosynthesis within canopies: application to an isolated tree crown. Plant Cell and Environment, 24, 395-406. Sinoquet H., Moulia B. & Bonhomme R. (1991) Estimating the 3-dimensional geometry of a maize
crop as an input of radiation models - comparison between 3-dimensional digitizing and plant profiles. Agricultural and Forest Meteorology, 55, 233-249.
Song Y.H., Rui Y.K., Bedane G. & Li J.C. (2016) Morphological Characteristics of Maize Canopy Development as Affected by Increased Plant Density. Plos One, 11.
Sonohat G. & Bonhomme R. (1998) Variations de structure aérienne de peuplements de maïs en fonction de la densité de semis. Implications pour la modélisation. In: Fonctionnement des
peuplements végétaux sous contraintes environnementales, pp. 403-421. INRA Editions,
Paris.
Tardieu F., Reymond M., Hamard P., Granier C. & Muller B. (2000) Spatial distributions of expansion rate, cell division rate and cell size in maize leaves: a synthesis of the effects of soil water status, evaporative demand and temperature. Journal of Experimental Botany, 51, 1505-1514.
Tardieu F., Simonneau T. & Parent B. (2015) Modelling the coordination of the controls of stomatal aperture, transpiration, leaf growth, and abscisic acid: update and extension of the Tardieu-Davies model. Journal of Experimental Botany, 66, 2227-2237.
Tian F., Bradbury P.J., Brown P.J., Hung H., Sun Q., Flint-Garcia S., Rocheford T.R., McMullen M.D., Holland J.B. & Buckler E.S. (2011) Genome-wide association study of leaf architecture in the maize nested association mapping population. Nature Genetics, 43, 159-U113.
Unterseer S., Bauer E., Haberer G., Seidel M., Knaak C., Ouzunova M., Meitinger T., Strom T.M., Fries R., Pausch H., Bertani C., Davassi A., Mayer K.F.X. & Schon C.C. (2014) A powerful tool for genome analysis in maize: development and evaluation of the high density 600 k SNP genotyping array. Bmc Genomics, 15.
Wei X.M., Wang X.B., Guo S.L., Zhou J.L., Shi Y., Wang H.T., Dou D.D., Song X.H., Li G.H., Ku L.X. & Chen Y.H. (2016) Epistatic and QTLxenvironment interaction effects on leaf area-associated traits in maize. Plant Breeding, 135, 671-676.
Yang C., Tang D., Qu J., Zhang L., Chen Z. & Liu J. (2016) Genetic mapping of QTL for the sizes of eight consecutive leaves below the tassel in maize (Zea mays L.). Theoretical and Applied Genetics,
129, 2191-2209.
Yang D.L., Liu Y., Cheng H.B., Chang L., Chen J.J., Chai S.X. & Li M.F. (2016) Genetic dissection of flag leaf morphology in wheat (Triticum aestivum L.) under diverse water regimes. Bmc Genetics,
17.
Yin X.Y. & van Laar H.H. (2005) Crop Systems Dynamics. An ecophysiological simulation model of
genotype-by-environment interactions. Wageningen Academic Publishers, Wageningen, The
Version postprint
Table 1: Correlations of environmental variables with leaf width and length.
The coefficient of correlation (r) was calculated with the R function “corr”, and corresponding p-values were calculated with the “cor.test” function. Data is summarized from leaf beginning to end of expansion: mean of daily minimum temperature, mean of maximum temperature and mean temperature (Tmin, Tmax and Tmean); mean of daily minimum, mean of maximum and mean leaf-to-air
vapour pressure deficit (VPDmax, VPDmin and VPDmean); mean of daily incident light (Rn). Significant
threshold was fixed at a p-value of 0.01 (p-value > 0.01 : non-significant ; p-value ≤ 0.01 : significant ; p-value ≤ 0.001 : highly significant ).
r pvalue r pvalue r pvalue r pvalue r pvalue r pvalue r pvalue
Width 0.29 0.01 -0.71 < 0.001 -0.66 < 0.001 0.04 0.73 -0.09 0.4 -0.02 0.83 0.82 < 0.001
Length -0.04 0.19 -0.15 0.09 0.19 0.72 -0.4 < 0.001 -0.04 0.23 -0.29 < 0.01 -0.09 0.67
Version postprint
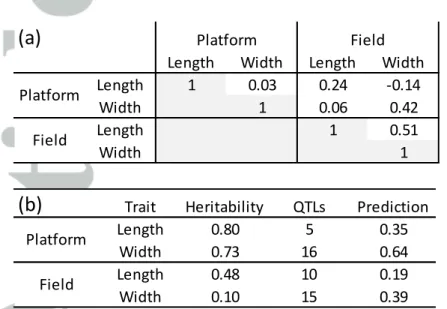
Table 2: Coefficient of correlation between leaf length and width (a), narrow sense heritability,
number of QTLs identified by the GWAS analysis and prediction capacity of each set of QTLs on the measured variable (b).
Data come from 251 genotypes for one platform experiment and one field experiment. (b) For each set of QTLs on the measured variable in the field or in the platform.
Length Width Length Width
Length 1 0.03 0.24 -0.14 Width 1 0.06 0.42 Length 1 0.51 Width 1 Platform Field Platform Field
(a)
(b)
Trait Heritability QTLs PredictionLength 0.80 5 0.35 Width 0.73 16 0.64 Length 0.48 10 0.19 Width 0.10 15 0.39 Platform Field
Version postprint
Table 3: Comparison of allelic effects of QTLs identified for leaf width or length in the platform and
in the field.
Data come from leaf width and length measurements on 251 genotypes for one platform experiment and one field experiment. The first column (“Variable”) indicates the trait and
Field Platform Field Platform
Rint = 1.4 Rint = 0.4 VPD = 2.4 VPD = 0.8 MJ/m² MJ/m² kPa kPa S1_14810807 1.02 35.2 2.2* 0.1 0.7 -0.5 AX-90656316 1.02 53.4 2.4* 0.4 0.3 -0.3 S1_204867908 1.07 155.9 -2.3* -1.6 -1.3 0.0 S1_205242298 1.07 156.2 2.5* 1.9 0.9 0.2 AX-91404589 2.06 128.3 2.2* 1.3 0.6 0.1 AX-91846273 2.06 129.5 2.4* 1.5 0.8 0.3 AX-90618756 2.07 159.5 2.4* 1.0 0.0 0.1 AX-90782812 2.07 160.1 2.3* 1.2 0.0 -0.2 AX-90841086 3.06 111.4 2.3* 1.0 1.2 0.5 AX-90841149 3.06 111.6 2.3* 1.0 1.2 0.5 AX-91623171 4.05 55.7 2.4* 1.5 0.0 -0.4 AX-90977036 5.08 187.1 -2.3* -0.5 0.0 1.1 SYN19549 10.1 87.9 2.3* 1.0 0.6 0.0 S10_141613269 10.1 109.6 -2.3* -1.0 -1.2 -0.4 AX-91194831 10.1 116.8 2.3* -0.2 0.0 -0.5 AX-90700654 1.06 147.8 -1.4 -2.8* 0.0 -0.9 AX-90700772 1.06 148.3 -1.0 -2.5* 0.3 -1.2 AX-91402250 1.07 156.5 -2.1* -2.7* 0.1 0.1 AX-90610562 1.08 189.7 -1.5 -3.1* -0.9 -0.5 AX-90733206 2.02 39.1 -1.1 -2.7* 0.2 0.3 S2_11564804 2.02 39.7 1.4 2.6* -0.3 -0.6 AX-91388874 2.02 42.8 -1.4 -2.6* 0.0 0.3 AX-90598044 2.03 59.1 0.7 2.7* 0.3 -0.1 AX-90775864 2.06 110.6 0.6 2.9* -0.2 -0.1 AX-91541880 2.06 111.0 -0.7 -2.7* -0.3 -0.2 PZE-102124387 2.06 111.2 -0.8 -2.7* -0.4 -0.1 AX-90776150 2.06 111.9 -1.1 -2.7* 0.1 -0.1 AX-91542155 2.06 112.8 -0.7 -2.7* -0.3 -0.2 AX-91412182 6.01 12.5 0.8 2.8* 0.4 0.1 S8_172254661 8.08 170.6 0.9 2.7* -0.2 0.0 AX-91418229 1.08 200.5 1.9 0.8 1.8* 0.7 AX-90716443 1.09 207.6 -1.2 -0.3 -1.8* -1.0 AX-90602493 4.03 41.2 -1.1 -0.6 -1.9* -0.9 AX-90896424 4.06 63.2 -0.4 0.5 -2.0* -0.8 AX-90547782 5.07 149.7 0.9 0.9 2.1* 1.0 S6_103026220 6.03 42.2 1.1 0.4 1.9* 0.5 S6_113779929 6.04 56.1 -0.6 -1.2 -2.0* -1.3 PZE-108093081 8.06 129.4 0.5 -0.5 1.8* 1.0 AX-90624676 8.06 145.4 -0.7 -1.2 -1.9* -0.4 AX-91488109 1.06 141.9 -0.7 0.7 -0.1 2.0* AX-91525911 2.05 95.0 1.5 2.9 -0.2* 0.5* AX-90575329 5.05 108.3 -0.1 -0.5 -0.9 -2.0* S9_90366933 9.03 59.2 -0.1 1.1 0.2 2.0* AX-91445646 9.05 81.6 0.3 -0.6 -0.9 -1.8* Fi e ld W id th Pl at fo rm W id th Fi e ld L e n gt h Pl at fo rm Le n gt h
Variable SNP name Bin Position (cM)
Version postprint
experiment for which the QTL has been detected significantly, together with its associated LOD score. The allelic effects of the same QTLs are presented for length and width in field and platform, regardless of the significance of the QTL in the considered trait and environment. Red and blue, positive and negative allelic effects (respectively) of the allele carried by genotype B73. * indicates significant effect (LOD >5). Rint is the cumulated intercepted radiation during leaf widening and VPD
Version postprint
Figure 1 : Time courses of widening and elongation of leaf 8. Circle and square dots: mean of leaf
width and length for 10 plants per date (data are normalized by maximum value). Dashed and solid
lines are local regressions (“loess” function) for width and length, respectively. Grey vertical dotted
Version postprint
Figure 2 : Leaf-8 shape in three light treatments. Leaf width plotted against the distance from leaf
ligule (a), mean values for maximum leaf length (b) and width (c) for 10 plants. Blue : control treatment without shade; Red: plants continuously shaded since leaf-6 appearance; Green: alternated treatment between shade and light. In (a) Points: experimental data. Lines: local regression (fonction “loess”, span = 0.3). (b, c) Mean values and standard deviation of maximum leaf length and width.
Version postprint
Figure 3 : Response of leaf widening to intercepted light. (a) Leaf widening in the alternatedtreatment, relative to the full-light and shaded treatments in leaves 7 to 9. On the y-axis, width values in the alternated treatment are normalized by the difference between control and shade treatments, and showed as a percentage. 0% stands for leaf width in the shaded treatment (80% light reduction) and 100% for the full-light treatment. See text for position-time correspondence (b) Maximum leaf width plotted against plant intercepted light (Rint) in the three treatments and three
leaf ranks. ). Leaf width are corrected for leaf rank; (Wmax,8 ; see M&M). Colours displays the different
Version postprint
Figure 4 : Response of (a) leaf width to light intercepted by plants during leaf widening (Rint) and (b)
leaf length to leaf to air vapor pressure deficit during leaf elongation (VPDla , mean of maximum daily
values). Blue dots : Field data. Red dots: Platform data. Symbols represent leaf ranks from 8 to 11, circles, squares, diamonds and triangles, respectively. Leaf width and length values of the four leaf ranks are corrected for leaf rank so equivalent values for leaf 8 are presented (see M&M). Black lines, linear regressions.
Version postprint
Figure 5: Time courses of vapour pressure deficit (VPDla) (a, solid black line), light intensity (Rn) (a -dashed grey line) and leaf elongation rate (b) during a 4-d experiment in the platform PhenoDyn in well-watered conditions. Data are smoothed with local regression (function loess, span = 0.02). Grey rectangles periods from 14 and 17h, during which VPDla. has been taken into account (c) Response of
Version postprint
Figure 6 : Observed vs simulated final leaf length, width and area. Circles : leaf 8 ; Squares : leaf 9 ;
Diamonds : leaf 10 ; Triangles : leaf 11.
a) Leaf length. RMSE = 6.21 cm, CV = 7%. Colours display VPDla during leaf elongation.
b) Leaf width. Grey dots represent leaf width if calculated as a fixed proportion of leaf length (RMSE
= 1.95 cm , CV = 26%). Other colors, leaf width calculated from intercepted light per plant during leaf widening. RMSE = 0.8 cm, CV = 11%.
Version postprint
c) Leaf area. Grey dots as in b, RMSE = 0.02 m², CV = 34%. Black dots, leaf width calculated from
Version postprint
Figure 7 : Boxplot of measured maximum leaf width and final leaf length for leaf 8 for one platform