1 INTRODUCTION
In addition to adhesion and cohesion, another pa-rameter often considered affecting the tensile bond between repair material and existing concrete is the substrate roughness. Nevertheless, this subject has been controversial for years. In fact, some reported bond test results have shown that surface roughness has only a minor influence on the tensile bond. For instance (Silfwerbrand, 1990), bond to rough water jetted surface was compared with bond to smooth sandblasted surface. It was concluded that there could be a roughness “threshold value” beyond which further improvement on the roughness would not enhance bond strength (Courard et al., 2010). According to these test results, the “threshold value” ought to be close to the surface roughness of the typ-ical sandblasted surfaces (Courard et al., 2009). However, it remains the opinion of many specialists in the industry that a rougher surface is beneficial to bond strength. Since roughness directly depends on the surface preparation method, the proposed re-search is intended to shed new light on the subject and ultimately resolve the controversy.
According to American National Standards Institute, the methods for measuring roughness and surface texture can be classified into three types: contacting methods, taper sectioning, and optical (non-contacting) methods.
Taper sectioning is used in metallurgy and involves cutting across a surface at a low angle α to physical-ly amplify the height of asperities by ctg α (Sher-rington et al., 1988).
Among the contacting methods there are stylus type profilometers, tactile tests, measurement of kinetic friction, measurement of static friction, use of rolling ball measurements, and measurement of the compli-ance of a metal sphere with a rough surface.
Optical (non-contacting) methods include optical re-flecting instruments, light microscopy, electron mi-croscopy, speckle metrology, interferometry and la-ser profilometry (Fukuzawa et al., 2001).
A variety of approaches have been set all over the years to characterize the surface roughness of con-crete: evaluation of the proportion of the surface oc-cupied by aggregates, measurement of the maximum roughness amplitude (Courard, 1998), adhesion tests (Pretorius et al., 2001 and Garbacz et al., 2005), cal-culation of surface parameters based on image anal-ysis or on microscopic observations, etc. However, these methods are unable to provide a sufficiently detailed representation of the actual surface profile for the calculation of morphological and statistical parameters, and are not user-friendly under field conditions. In order to achieve a reliable quantitative analysis of superficial concrete morphology after surface preparation (Bissonnette et al., 2006), differ-ent profilometry and surfometry techniques can be used (Perez et al., 2005). The data obtained with such techniques enable a real quantitative assess-ment of the surface profile by means of statistical parameters calculated from the total superficial pro-file and from the filtered waviness (low cy/macro roughness) and roughness (high frequen-cy/microroughness) profiles (Courard et al., 2003 and Courard et al., 2004). Some of these parameters
Topography evaluation methods for concrete substrates: parametric study
L. Courard
University of Liège, Belgium
A. Garbacz
Warsaw University of Technology, Poland
B. Bissonnette
Laval University, Québec, Canada
ABSTRACT: Research projects performed at the University of Liege, Laval University and the Warsaw Uni-versity of Technology have pointed out the importance of taking care about the surface roughness of concrete substrate with regards to the adhesion of repair materials. This paper wants to make a State-of-Art on this specific problem: surfometry methods, interface analysis, adhesion measurements, …etc are presented, inter-preted and compared. Surfology, which is a more wide concept, contributes to understand what will make the contact effective or not, and allow interactions of variable intensities between the materials. Different scales of observation – micro to macro - are needed to exactly represent what happens when materials are put into contact.
– for instance the profile arithmetic mean and the flatness coefficient - are particularly discriminating both for the shape of valleys and peaks, as well as for their amplitude and frequency.
The selected characterization techniques were com-pared for effectiveness, accuracy, consistency and field applicability. The following techniques were analyzed on a comparative basis:
• the evaluation of surfaces with sand patch test according to ASTM E965 (very close to EN 13036-1: 2002);
• mechanical profilometry technique, in which a high-precision extensometer is moved all over the surface to obtain a 3-D mapping (x, y, z coordinates), from which morphological parameters are computed;
• laser technique, where the superficial eleva-tion (distance from the laser beam source) of each point is calculated on the basis of the la-ser beam transit time;
• opto-morphometry technique, based on the observation and analysis of the shadow pro-duced by the superficial roughness of the sur-face (Moiré fringe pattern principle);
• microscopic methods;
• concrete surface profiles (CSP) plaques 03732).
The aim of this paper is the identification of the dif-ferent available techniques (laboratory and field use), as well as their comparison for evaluating rele-vant quantitative roughness characteristics.
2 METHODS FOR SURFACE ROUGHNESS
EVALUATION 2.1. Visual observation
The visual evaluation of surface roughness is the most simple but rather subjective way of evaluation. The systematic approach for visual surface qualifica-tion was proposed by ICRI (ACI).
Table 1. Concrete surface treatment methods and corresponding Concrete Surface Profile (CSP) Surface preparation methods CSP
Detergent scrubbing 1
Low-pressure water cleaning 1
Acid etching 1-3
Grinding 1-3
Abrasive (Sand) blasting 2-5
Steel shotblasting 3-8 Scarifying 4-9 Needle scaling 5-8 Hydrodemolition 6-9 Scabbling 7-9 Flame blasting 8-9 Milling/rotmilling 9
The reference plaques called Concrete Surface Pro-file - CSP (Tab.1) represented concrete surface after typical surface treatment commonly used in the field. The details are given in ICRI Guidelines no. 03732.
2.2. Sand patch test
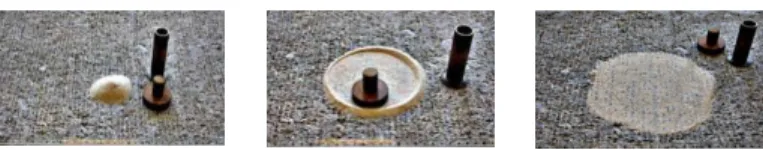
The sand patch tests described in ASTM E965 (very close to EN 13036-1:2002) is one of the most com-monly methods used for examination of macrotex-ture depth of concrete surfaces, mainly road and air-field pavements. This direct volumetric method consists in careful application of a given volume of granular materials (a glass spheres or sand) of given granulometry onto surface and subsequent meas-urement of the total area covered. Poured quantity of granular materials is spreading in a circular pattern with the rubber disc spreading tool, kept flat on the surface, into a circular patch with the surface depres-sions filled to the level of the peaks. As the sand is spread, it fills the low spots in the pavement surface. When the sand cannot be spread any further, the di-ameter of the resulting circle is measured (Fig.1). The surface roughness is characterized by so called the Mean Texture Depth (MTD) calculated from the following formula:
MTD = 4V/ πD2 [mm] (1) where:
V = volume of a granular material [mm3]
D = diameter of circle covered by a granular materi-al [mm]
Figure 1. Sand patch test for surface macrotexture depth evaluation
According to ASTM E965 and EN 13036-1 standard a glass spheres of 250/180µm are recommended as the granular materials. However, silica sand is also used.
Similar way of surface roughness evaluation is pro-posed in the European Standard EN 1766:2000 in the case concrete substrate preparation prior repair. Silica sand with granulometry 100/50µm is recom-mended for evaluation. Surface Roughness Index is calculated from the formula:
SRI = (V/d2).1272 (2) Where symbols like in eq.1 and V=25ml is recom-mended
The advantages of sand patch method are speed, non-destructive character, applicability in situ but
the surface has to be protected from wind and rain. The biggest limitations are board of validity (from 0.25 to 5mm) and possibility of application only at horizontal surfaces.
2.3. Profilometry methods 2.3.1. Mechanical profilometry
The deviations of surface geometry are detected by a sensor (stylus) that moves along the surface. The gauge turns the vertical deflection of the stylus as a function of position into the electrical signal which is registered by the computer and in the end a sur-face profile is obtained (Fig.2a). There is a possibil-ity of regulation of the distance between measure-ment points to get better precision. Geometry (round or conical) and size (radius) of the stylus extremity are of prime significance for real profile restitution because, some profile of small wavelengths will not be registered, if the diamond cone radius is too large (Fig.2b).
a)
b) c)
Figure 2. Mechanical profilometer: a) a scheme of device, b) stylus adopted for concrete surface rough-ness evaluation, c) effect of stylus type on registered profile (Courard et al., 2004).
2.3.2. Laser profilometry
Laser profilometry method is based on a laser dis-tance measurement by optical displacement meter. In this technique a principle referred to as optical tri-angulation. Optical triangulation uses a light source (commonly a diode laser), imaging optics, and a photodetector. As shown in Figure 1, a diode laser is used to generate a collimated beam of light, which is then projected onto a target surface. A lens focuses the spot of reflected laser light onto a photodetector, which generates a signal that is proportional to the spot's position on the detector. As the target surface height changes, the image spot shifts due to the par-allax. To generate a three dimensional image of the part's surface, the sensor scans in two dimensions,
generating a helical set of radius data that represent the inside surface topography of the tube. Software then generates a color image of the inside surface of the tube. The idea is taken from an old comb method and it is very simple but instead of the needles there is an emitter of a laser signal moving along the sur-face and measuring distance to the sursur-face (Fig.3).
a) laser profilometry equip-ment
b) result screen of laser profilometry
Figure 3. Laser profilometry with optical displace-ment meter (Fukuzawa et al., 2001)
2.3.3. Opto-morphology profilometry
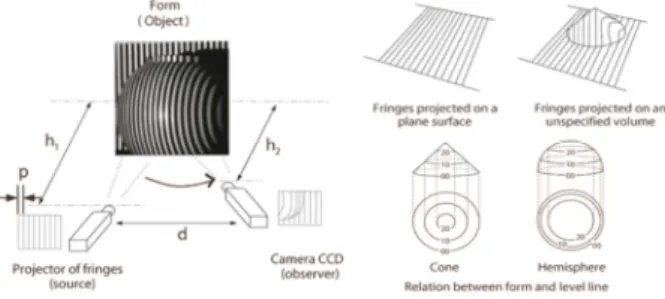
Above presented two profilometry methods are used only in laboratory conditions (Courard et al., 2007). Recently, works are focused on development optic based methods which can be used insite. The “moi-ré” projection technique which belongs to an inter-ferometrical measurement method can be considered as the technique useful for this purpose. The “moiré» phenomenon appears when two networks of light rays, made of equidistant lines - alternatively opaque and transparent -, are superimposed. The technique of identification of relief is based on the defor-mation’s measurement of a parallel fringes pattern projected on a surface (Fig. 4). The moiré’s fringes are similar to level lines representing the variations height of the object. By projecting a network of par-allel fringes on a plane surface, this network will not be deformed. When projected on an unspecified form, this same network will be deformed according to the level of rise in this form. The main principle of the test consists in the comparison of two images having two different moiré networks. The first im-age is the imim-age reference: it is an imim-age of the net-work of not deformed parallel fringes. The second image contains the projected network deformed ac-cording to the analyzed form. An algorithm analyzes the image and compares the grid of calibration and the deformed grid.
2.3.4. Characterization of surface roughness
The result of roughness measurement is usually the image of the profile. To analyze the influence of the treatment on the surface it is necessary to quantify mathematically and statistically the shape of the sur-face by means of several parameters.
stylus type
real profile
Figure 4. Moire projection principle (Perez et al., 2009)
Another approach is surfometry - a surface metrolo-gy of profile extended to 3D. The profilometer is used to get many parallel profiles at close spacing between them. The result is analyzed not in one di-rection but two perpendiculars (x,y) and get a 3D visualization of the surface. This method gives the quantification of surface geometry independent of the anisotropy.
Signal filtration
The total profile presents a combination of two composites: waviness and roughness. In surface characterization methods they have to be separate. In mechanical profilometry a filtration by differentiat-ing the diameters of the stylus is often used. It is also possible to filtrate the result in mathematic way (Pe-rez et al., 2005).
3 COMPARISON OF TECHNIQUES 3.1. Mechanical vs. optical profilometry
Concrete substrates (300x300x50mm) of C20/25 class were made from the concrete mix: CEM I 32.5, 2/8 limestone, 0/2 quartz sand. The following types of mechanical treatments were used to prepare the concrete substrates:
• grinding (GR),
• sandblasting (SB),
• shotblasting (SHB35 and SHB45, with treatment time of 35, and 45 s, respectively),
• hand (HMIL) and mechanical (MMIL) mill-ing.
The surface roughness after various treatments was characterized with the following methods:
• mechanical profilometry: the commercial profilometer developed for metal surface testing has been adopted for evaluation of a concrete substrate by changing the stylus (Courard et al., 2003). In the first step, the roughness of the profile was analyzed. In this case a stylus with a diamond sphere radius of 6 µm was used. The length of measurement was 8 mm and the filter used to separate roughness from the total profile was fixed to 0.8 mm. The measurement of waviness was made with another stylus 79 mm long and a
diamond of 1.5 mm radius. The length of the measurement was enlarged to 30 mm or more. The filter to separate waviness from the total profile was classically chosen at 0.8 mm.
• laser profilometry: the concrete surface was tested with a commercial laser profilometer working in the laser beam triangulation mode with a vertical accuracy of 1 µm and maxi-mum angle of surface measurement of 90°. A correction of the surface image (local lack of height data) was necessary. The missing data were approximated using a smooth shape calculated from the neighbours.
• Sand patch method (acc. EN 1766) - the sur-face roughness described using the so called Surface Roughness Index – SRI. This con-sists in spreading silica sand (50-100 µm) onto the surface, making a circle and measur-ing its average diameter, which defines the SRI value;
• microscopic method - the stereological pa-rameters are: surface roughness ratio, RS, profile roughness ratio, RL and fractal di-mension, Db. They were determined with vertical sectioning methods for the profile images registered with a light microscope at magnification 10x. Samples for microscopic observation of 20x50mm were cut from con-crete plate of 300x300 mm (Fig.1a). The to-tal length of examined profile was 350 mm for each substrate type.
In the case of laser profilometry (Fig. 3), the area of 10x 30mm was scanned along parallel lines with a distance of 50 µm between subsequent lines (Gar-bacz et al., 2006). In the case of mechanical pro-filomtery the surface was scanned along three lines of 30 – 40 mm long. The registered profile was first transformed to remove the effect of the profile orien-tation (“shape” filtration). The total profile obtained was next filtered and divided into low and high fre-quencies to separate parameters of waviness and roughness, respectively. The filter used to separate waviness from the total profile was classically cho-sen at 0.8 mm for both methods. The total height of the profile, Xt, arithmetic mean of the deviations of the profile from the mean line, Xa, and maximum depth of valleys, Xv, were selected for the surface geometry characterization in the case of all levels of filtration (Perez et al., 2009), i.e. for the total (X=P), waviness (X=W) and roughness (X=R) profiles. Ad-ditionally, the Abbott’s curve parameters were de-termined. The shape of Abbott’s curve is character-ized by three parameters (Courard et al., 2003):
• Cr - relative height of the peaks;
• Cf - depth of the profile, excluding high peaks and holes;
In the further text indexes “p” and “s” denote pa-rameters measured by mechanical and laser pro-filometer respectively.
Figures 5 and 6 present a comparison between Sur-face Rough Index and parameters measured on the base of profilometry techniques: an equivalent corre-latio exists between the mean waviness obtained by means of the two profilometry techniques and SRI, respectively.
Figure 5. Surface Rough Index vs arithmetic mean of waviness; (p,∆) and (s,•) for mechanical and laser profilometers (Garbacz et al., 2006)
Similar conclusions may be given for Abbott’s pa-rameters (Fig. 6).
Figure 6. Surface Rough Index vs Abbott’s parameters; (p,∆) and (s,•) for mechanical and laser profilometers (Garbacz et al., 2006)
The mean roughness values are close to each other for the treatment types and the both profilometry methods.
The total height and the mean value of the waviness profile (Fig. 8) measured with the laser profilometry are 1.3 – 4.3 times higher than the ones deduced from the mechanical method. In the case of the pa-rameters of Abbott’s curve (Fig.9) this ratio was even 7 times higher.
Figure 7. Comparison of mean waviness; “p” and “s” for mechanical and laser profilometers (Garbacz
et al., 2006)
Figure 8. Comparison of maximum peak height and maximum height waviness; “p” and “s” for mechan-ical and laser profilometers (Garbacz et al., 2006)
Figure 9. Abbott’s parameters; “p” and “s” for me-chanical and laser profilometers (Garbacz et al., 2006)
4 CONCLUSIONS
The results of surface geometry characterization (Tab.1) with the four methods can be summarized as follow:
• the geometrical parameters determined for both macroscopic level (SRI value) and mi-croscopic level (RS, RL ratios and waviness
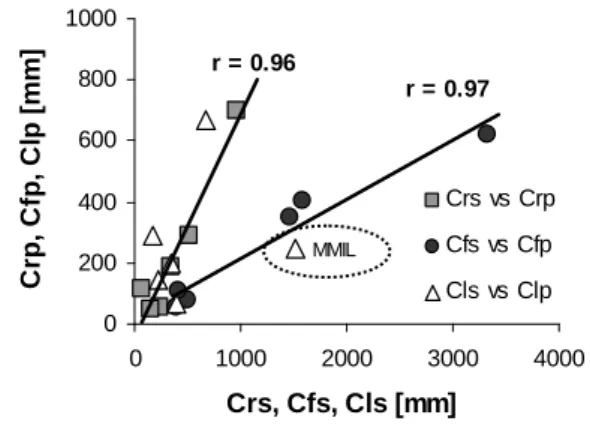
r=0.97 r= 0.95 0 150 300 450 600 100 120 140 160 180 200 SRI [mm] W a s , W a p [ µ m ] r = 0.96 r = 0.91 0 800 1600 2400 3200 4000 100 120 140 160 180 200 SRI [mm] C F S, C F P [ µ m ] r=0.94 0 100 200 300 400 500 100 200 300 400 500 600 Was [µm] W a p [ µ m ] r = 0.76 r = 0.54 0 500 1000 1500 2000 2500 0 1000 2000 3000 4000 Wts, Wvs [µm] W tp , W v p [ µ m ] Wts vs Wtp Wvs vs Wvp MMIL r = 0.96 r = 0.97 0 200 400 600 800 1000 0 1000 2000 3000 4000 Crs, Cfs, Cls [mm] C rp , C fp , C lp [ m m ] Crs vs Crp Cfs vs Cfp Cls vs Clp MMIL
parameters) generally indicate that a higher roughness was obtained after shot blasting for 45s and a lower roughness by grinding;
• in the case of the profilometry methods, the waviness parameters are about 5% (mechani-cal profilometry) and 9% (laser profilometry) smaller than the one corresponding to the to-tal profile. This confirms that the global shape of the profile has been preserved through the waviness filtration;
• the mean roughness values are close to each other for the treatment types and the both profilometry methods (Rap=17±2 and Ras=19±7, respectively). However, the total height of the roughness profile determined with laser profilometry was 2.8 – 5.5 times exceeding the one obtained with mechanical profilometry with the same filtration method.
• both the total height and the mean value of the waviness profile measured with the laser profilometry are 1.3 – 4.3 times higher than the ones deduced from the mechanical meth-od. In the case of the parameters of Abbott’s curve this ratio was even 7 times higher. However, values of these ratios do not corre-spond to the waviness level;
• the values of fractal dimension, Db deter-mined with the microscopic method are close to those obtained for various types of con-crete (D = 1.03 – 1.25). Range of Db values is higher in comparison with the surface frac-tal dimension, DS, obtained with laser pro-filometry. The low scattering of DS value is caused by measurements for surface area with relatively low irregularity. However, the values obtained of DS are higher than the values that have been determined for fracture surfaces (DS = 2.02 – 2.3) of various types of concretes and close to those determined for, e.g. steel after surface treatment by grinding.
5 REFERENCES
Bissonnette, B., Courard, L., Vaysburd, A. and Bélair, N. 2006. Concrete removal techniques: influence on residual crack-ing and bond strength. Concrete International, 28(12): 49-55.
Courard, L. 1998. Parametric Definition of sandblasted and polished Concrete Surfaces, in: IXth International Congress on Polymers in Concrete, Bologna, Italy (ICPIC, Ed. P. Sandrolini,): 771-778.
Courard, L. and Nélis, M. 2003. Surface analysis of mineral substrates for repair works: roughness evaluation by pro-filometry and surfometry analysis. Magazine of Concrete
Research 55(4): 355-366.
Courard, L., Garbacz, A. and Gorka, M. 2004. Concrete sur-face treatments quantification by means of mechanical pro-filometry. in: ICPIC, XIth International Congress on Poly-mers in Concrete (Ed. M. Maultzsch, Federal Institute for
Materials Research and Testing), Berlin, Germany (2-4 June 2004): 125-132.
Courard, L., Schwall, D. and Piotrowski, T. 2007. Concrete surface roughness characterization by means of opto-morphology technique. Monography: Adhesion in Interfac-es of Building Materials: a Multi-Scale Approach (AMSR Advances in Material Science and Restoration, Eds. L.
Czarnecki and A. Garbacz, Aedificio Publishers): 107-116.
Courard, L., Michel, F., Schwall, D., Van der Wielen, A., Gar-bacz, A., Piotrowski, T., Perez, F. and Bissonnette, B. Sur-fology: concrete substrate evaluation prior to repair. Mate-rials Characterization: computational methods and experiments IV (eds. A. Mammoli and C.A. Brebbia, Wes-sex Institute of Technology Press). The New Forest (U.K.), 17-19 June, 2009: 407-16.
Courard, L., Vaysburd, A. and Bissonnette, B. Repair of con-crete industrial floors with bonded cement-based material overlays: some recommendations. Seventh International Colloquium Industrial Floors ’10, (Ed. K. Littmann,
Tech-nische Akademie Esslingen), Ostfildern/Stuttgart, Germany
(2010): 617-622.
Fukuzawa, K., Mitsui, M. and Numao, T. 2001. Surface rough-ness indexes for evaluation of bond strengths between CRFP sheet and concrete. In: Xth International Congress on Polymers in Concrete (ICPIC 01, Ed. D. Fowler), Honolulu, Hawaï: p12.
Garbacz A., Courard L., Kostana K. 2006. Characterization of concrete surface roughness and its relation to adhesion in repair systems, Materials Characterization, 56: 281-289 Garbacz, A., Courard, L., and Gorka, M. 2005. Effect of
con-crete surface treatment on adhesion in repair systems.
Mag-azine of Concrete Research 57(1):49-60.
Perez, F., Courard, L., Bissonnette, B., Garbacz, A. and Gorka, M. Two different techniques for the evaluation of concrete surface roughness. In: ICCRRR 2005 International Confer-ence on Concrete Repair, Rehabilitation and Retrofitting (Eds. H. Beushausen, F. Dehn and M.G. Alexander, 2006
Taylor & Francis Group, London), Cape Town, South
Af-rica (2005): 1015-1020.
Perez, F., Bissonnette, B.and Courard, L. 2009. Combination of mechanical and optical profilometry techniques for con-crete surface roughness characterization. Magazine of
Con-crete Research 61(6): 389-400.
Pretorius, J. and Kruger, D. 2001. The influence of surface roughness on the bond strength of concrete repairs. In: Xth International Congress on Polymers in Concrete (ICPIC 01, Ed. D. Fowler), Honolulu, Hawaï: p13.
Sherrington, I. and Smith, E.H. 1988. Modern measurement techniques in surface metrology - Part I: Stylus instruments, electron microscopy and non-optical comparators. Wear 125: 271-288.
Sherrington, I. and Smith, E.H. 1988. Modern measurement techniques in surface metrology - Part II: Optical instru-ments Wear, 125: 289-308.
Silfwerbrand J. 1990. Improving Concrete Bond in repaired Bridge Decks. Concrete International 12 (9): 61-66.
6 AKNOWLEDGMENTS
This research project was supported by the scientific cooperation program between foreign agencies of Wallonia-Brussels International (Belgium), Québec (Canada) and Poland.