A SYSTEMATIC PROCEDURE
TO PREDICT FLOWS INDUCED BY MAJOR DYSFUNCTIONS
ON COMPLEXES OR CASCADES OF DAMS
Benjamin J. Dewals
①,②, Pierre Archambeau
①, Sébastien Erpicum
①, Michel Pirotton
① ① Research Unit of Hydrology, Applied Hydrodynamics and Hydraulic Constructions (HACH),Department ArGEnCo, University of Liege, Belgium, e-mail: [email protected]
② Postdoctoral researcher, Belgian Fund for Scientific Research F.R.S.-FNRS
Abstract Hazard analysis of dams arranged in complex or in cascade may involve the
assessment of a large number of different scenarios of combined failures. However, a tremendous computation time would be needed to perform a detailed modeling of the flows generated by all possible scenarios. Therefore, the present paper describes a rational methodology for analyzing the flows induced by the most relevant incidents occurring on a complex or in a cascade of dams and reservoirs. The methodology combines several hydrodynamic models, including the two-dimensional flow solver WOLF 2D and a simplified lumped hydrodynamic model, to simulate
(i) the flows induced on the dams complex, (ii) the potential breaching in cascade of other dams, as
well as (iii) the propagation of the flood wave in the whole downstream valley. The application of the methodology to a practical case study involving a complex of five dams is also described.
Key words dam break, risk analysis, flow simulation, dam breaching, dams cascade
1
INTRODUCTION
A complete risk analysis related to dams arranged in complex or in cascade may involve the assessment of a large number of different scenarios of combined failures and dysfunctions, especially if embankment dams are concerned (Marche et al. 1997). Indeed, when any incident occurs on a complex of dams, possible failures in cascade must be considered. Consequently, risk analysis in such cases requires a holistic vision at the scale of the complex. However, a prohibitive computation time would be needed to simulate the flows generated by all possible scenarios. Therefore, the present paper describes a procedure for efficiently analyzing the most relevant flows induced by incidents occurring on a complex or in a cascade of dams and reservoirs.
The proposed methodology includes four steps, from the identification of the relevant individual failure scenarios to the computation of the hydraulic impacts on the reservoirs, on dams located downstream (with possible overtopping and/or failure in cascade) as well as in the downstream valley. At each stage, guidelines are provided to select the most appropriate modeling tool to compute accurately the induced flow at a reasonable CPU cost. The procedure typically combines two complementary flow models: first, the two-dimensional flow solver WOLF 2D and, second, a simplified lumped model, requiring very low computation time (Dewals et al. 2007b).
Finally, the paper describes the application of the model to a practical case study involving a complex of five dams.
COMPLEXES OR CASCADES
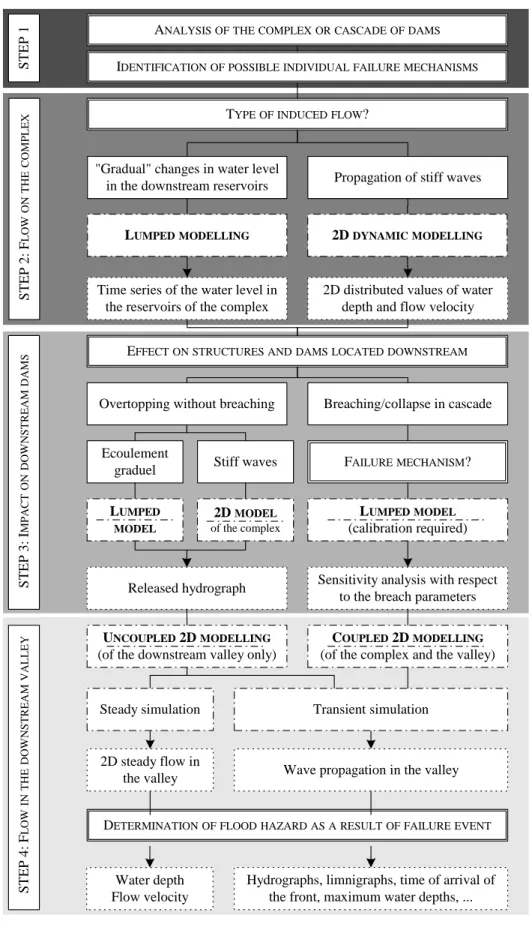
The proposed four-step methodology for analyzing a complex or a cascade of dams is summarized by the flow chart displayed in Figure 1. The method basically relies on a twofold approach to evaluate the impact in the downstream valley of failures on a complex (Marche 2004):
• first the hydrographs potentially released immediately downstream of the complex are determined for all possible individual failure scenarios (step 1 and step 2) and considering possible failures in cascade (step 3);
• second, the inundation in the downstream valley (step 4) is only simulated for some selected hydrographs released downstream.
Step 1 Identification of individual failures
Step 1 consists in identifying all the possible individual failure scenarios. Therefore, each dam or structure is reviewed and, by means of expert judgment and consultation with the dam owner, the possible malfunction or failure mechanisms are defined in accordance with ICOLD’s guidelines.
Step 2 Hydraulic impact on the complex
Step 2 involves the computation of induced flows on the complex or cascade of dams, while the hydraulic impact in the downstream valley is only considered at step 4. Step 2 must be executed with the most appropriate hydrodynamic modeling approach, depending on the type of flow induced on the complex of dams. As detailed by Dewals et al. (2007b), a 2D dynamic modeling approach is required for rapidly varying flows involving the propagation of stiff fronts, while a simpler lumped model may be applied if flow characteristics vary gradually. In some specific geometrical configurations (long and narrow reservoir), 1D modeling may also provide a suitable compromise.
On the basis of these first hydrodynamic results, the hydrodynamic load on the dams and structures located downstream is characterized and subsequently the behavior of those structures can be deduced. If the structure downstream is expected to sustain the overtopping flow and provided that the flow variations remain sufficiently gradual, the lumped hydrodynamic model is used to compute directly the hydrograph released downstream. For more complex hydrodynamic conditions, the lumped model is replaced by its 1D or 2D counterpart. If the structure downstream fails or is breached as a result of extreme overtopping flow, the prediction of the flow released downstream may only be undertaken by a single computation simulating the flows upstream in the reservoir, through the breach and in the downstream valley. In this case, steps 2, 3 and 4 of the methodology merge into one unified simulation. Therefore, the breach parameters, such as final width and formation time, must be characterized. Due to the significant uncertainty affecting those parameters, performing a sensitivity analysis is extremely useful at this stage (Dewals et al. 2007a). After proper calibration, the lumped model represents an efficient flow solver to carry out such sensitivity analysis (Dewals 2006a).
Step 4 Hydraulic impact in the valley
Finally, the flow in the downstream valley is simulated by means of the 2D model. As mentioned above, this final simulation covers either the downstream valley only, if the crest of the most downstream structure of the complex remains a control section; or the upstream reservoirs and the downstream valley, if no control section remains as a result of failure of the most downstream dam.
Besides, approximating the downstream flow by a steady state approach may be valid for particularly long duration released flow.
S TEP 2: F LOW ON TH E COMP L E X S TEP 3: I MPACT ON D O W N S T REA M DA M S STEP 4: F LO W IN TH E D O W N S TREA M VA LL EY
ANALYSISOFTHECOMPLEXORCASCADEOFDAMS IDENTIFICATIONOFPOSSIBLEINDIVIDUALFAILUREMECHANISMS
TYPEOFINDUCEDFLOW?
"Gradual" changes in water level
in the downstream reservoirs Propagation of stiff waves
LUMPEDMODELLING
Time series of the water level in the reservoirs of the complex
2D distributed values of water depth and flow velocity
EFFECTONSTRUCTURESANDDAMSLOCATEDDOWNSTREAM
Overtopping without breaching
LUMPEDMODEL (calibration required)
Released hydrograph Sensitivity analysis with respect
to the breach parameters FAILUREMECHANISM?
UNCOUPLED 2D MODELLING (of the downstream valley only)
COUPLED 2D MODELLING (of the complex and the valley)
Wave propagation in the valley 2D steady flow in
the valley
Water depth Flow velocity
Hydrographs, limnigraphs, time of arrival of the front, maximum water depths, ... DETERMINATIONOFFLOODHAZARDASARESULTOFFAILUREEVENT
Breaching/collapse in cascade Transient simulation Steady simulation 2D MODEL of the complex Ecoulement
graduel Stiff waves
STEP 1
2D DYNAMICMODELLING
LUMPED MODEL
3 APPLICATION:
HAZARD
ANALYSIS OF A COMPLEX
OF FIVE DAMS
As a case study, the methodology described above has been applied in the framework of a complete risk analysis process of an important complex of five dams. The main one (dam n°1), a 50 m-high concrete dam, is located upstream of a complex of four other dams, including a 20-meter high rockfill embankment (dam n°2, located most downstream). Figure 2 illustrates the global configuration of the complex.
As a consequence of this layout, the hypothetical failure of any of the upstream dams (particularly dam n°1) is very likely to induce other dam breaks in cascade (Dewals 2006b). Therefore the risk analysis of the complex must definitely be performed globally and not simply for each dam individually.
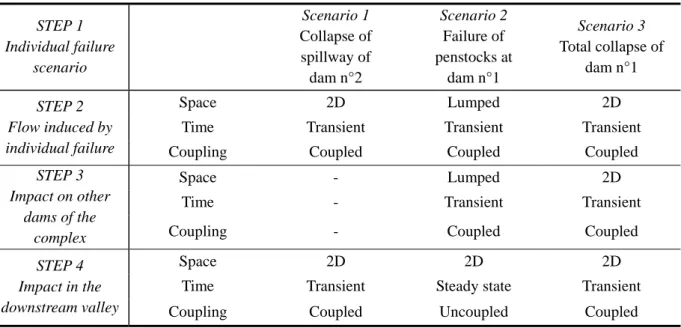
In the following paragraphs, the analysis of the three following individual failure scenarios is briefly described in accordance with the overall
• scenario 1: collapse of the spillway of dam n°2; • scenario 2: failure of penstocks at dam n°1; • scenario 3: total collapse of dam n°1.
For each scenario, Table 1 summarizes the main steps of the analysis, details the space and time discretization and states the type of coupling considered between the flows in the reservoirs and in the downstream valley.
Fig. 2 Global layout of the complex of five dams.
Table 1 Summary of the application of the analysis procedure for the case study.
STEP 1 Individual failure scenario Scenario 1 Collapse of spillway of dam n°2 Scenario 2 Failure of penstocks at dam n°1 Scenario 3 Total collapse of dam n°1 STEP 2 Flow induced by individual failure Space 2D Lumped 2D
Time Transient Transient Transient
Coupling Coupled Coupled Coupled
STEP 3 Impact on other
dams of the complex
Space - Lumped 2D
Time - Transient Transient
Coupling - Coupled Coupled
STEP 4 Impact in the downstream valley
Space 2D 2D 2D
Time Transient Steady state Transient
Coupling Coupled Uncoupled Coupled
Upper reservoir Dam n°1: Concrete dam Lower reservoir Dam n°5 Dam n°2: Rockfill dam Dam n°4 Dam n°3
4.1 SCENARIO 1: COLLAPSE OF THE
SPILLWAY OF DAM N°2
In scenario 1, the concrete spillway of the most downstream rockfill dam is assumed to collapse instantaneously. There is obviously no impact on other structures or dams of the complex and step 3 of the methodology may be skipped, while steps 2 and 4 merge into one 2D dynamic modeling, coupling the simulation of the flow in the lower reservoir and in the downstream valley.
4.2 SCENARIO 2: FAILURE OF
PENSTOCKS AT DAM N°1
According to scenario 2, penstocks are assumed to break down between dam n°1 and the hydroelectric power plant located at its toe. Such a failure may result from material or weld defect, or from sabotage.
Since the discharge released from the upper reservoir into the lower reservoir leads to relatively gradual flow motions in the reservoirs, the lumped hydrodynamic model is exploited for step 2 of the methodology. Hence, the simulations are based on two coupled equations governing the evolution of the free surface of the two main reservoirs (Dewals 2006a; Dewals et al. 2007b). As a result, the hydrographs of the flows overtopping each of the downstream dams (n°2 to 5) are obtained. They enable to deduce that those downstream dams are very unlikely to fail in cascade (step 3). Finally, the hydraulic impact in the downstream valley is computed by means of a 2D simulation covering only the downstream valley, since the crest of the most downstream dam (dam n°2) remains a control section resulting in a decoupling of the flows upstream and downstream of dam n°2. Besides, as a result of the relatively smooth hydrograph released, the approximation of a steady flow in the valley has been shown to be valid.
4.3 SCENARIO 3: TOTAL COLLAPSE
OF DAM N°1
In accordance with ICOLD’s recommendations, the failure dynamics of the total collapse of dam n°1 is expected to be instantaneous (ICOLD 1998).
By means of a 2D hydrodynamic modeling, involving over 400,000 computation cells, the detailed propagation of the waves induced on the lower reservoir has been simulated. This computation provides the characteristics of the overtopping waves reaching the downstream dams and reveals dramatic hydrodynamic loads acting on them (Dewals 2006b).
For the concrete dams (n°3 and n°4), the evaluation of the resultant forces and moments they undergo confirms that they are most likely to fail. Therefore, by means of a time-dependant topography implemented in the final simulation (step 4), dams n°3 and n°4 have been progressively removed from the topography once the computation detects that they are overtopped, hence representing their collapse in cascade triggered by the hydrodynamic waves reaching them (Dewals et al. 2004; Dewals 2006b). On the contrary, embankment dam n°5 is supposed not to be breached considering that the hydrodynamic loads are significantly weaker than for dams n°3 and n°4. As regards the downstream rockfill dam (dam n°2), it is expected to be breached by the overtopping flow and the proper breach parameters have been estimated on the basis of several empirical formulae (Dewals et
al. 2004) and physical modeling (Dupont et al.).
The breaching mechanism is also introduced in the 2D flow simulation by means of a time-dependant topography: once the computation code detects the overtopping, it triggers a time evolution of the local bed elevation in the topography matrix, according to the breach parameters previously defined, representing a very realistic breaching mechanism.
regarding the breach parameters, an extensive sensitivity analysis has been carried out (based on the lumped hydrodynamic model) and demonstrates in particular that the sensitivity of the released hydrograph with respect to the breach formation time remains extremely weak, as a result of the large amount of water stored in the reservoirs (Dewals 2006a; Dewals et al. 2007a).
Finally, a global transient 2D simulation has been carried out, coupling the flows in the reservoirs and in the whole downstream valley. The simulation mesh is based on a grid of about 900,000 potential computation cells. The obtained results enable to plot essential hazard maps as well as hydrographs and limnigraphs at a number of strategic points downstream of the dams (urbanized areas, bridges, …), which constitute the key input for the subsequent stages of the risk analysis process.
5 CONCLUSION
In conclusion, based on both theoretical developments and numerical studies, the present paper provides an overview of new advances of practical relevance for dam break risk analysis. Indeed, the global methodology developed addresses the main issues related to the analysis of failures and malfunctions on a complex or cascade of dams, such as dealing with possible (gradual) failures induced in cascade, combining efficiently several hydrodynamic modeling tools (incl. 2D dynamic model and lumped model), or conducting relevant sensitivity analysis.
REFERENCES
Dewals, B. (2006a). Une approche unifiée pour la modélisation d'écoulements à surface libre, de leur effet érosif sur une structure et de leur interaction avec divers constituants, PhD thesis, University of Liege: 636 p.
Dewals, B. J., P. Archambeau, S. Erpicum, S. Detrembleur and M. Pirotton (2004). Comparative analysis of the predictive capacity of breaching models for an overtopped rockfill dam. Proc. Int. Workshop "Stability and Breaching of Embankment Dams", Oslo, Norway.
Dewals, B. J., P. Archambeau, S. Erpicum, S. Detrembleur and M. Pirotton (2007a). Sensitivity analysis of the peak outflow induced by the breaching of embankment dams. 14. Deutsches Talsperrensymposium & 7th ICOLD European Club Dam Symposium. Ed. P. Rutschmann. Technische Universität München. 115: p. 86-92.
Dewals, B. J., S. Erpicum, P. Archambeau, S. Detrembleur and M. Pirotton (2007b). Analysis and application of two complementary numerical models for predicting flood waves generated by failures or dysfunctions occuring on a complex of dams. Proc. 32nd IAHR Biennial Congress - Harmonizing the demands from art and nature, Venice, Italy.
Dewals, B. J., S. Erpicum, P. Archambeau, S. Detrembleur, M. Pirotton (2006b). Numerical tools for dam break risk assessment: validation and application to a large complex of dams. Improvements in Reservoir construction, operation and maintenance. Ed. H. Hewlett. London, Thomas Telford: p. 272-282.
Dupont, E., B. J. Dewals, P. Archambeau, S. Erpicum and M. Pirotton (2007). Experimental and numerical study of the breaching of an embankment dam. Proc. 32nd
IAHR Biennial Congress - Harmonizing the demands from art and nature, Venise, Italie.
ICOLD (1998). Etude d'onde de rupture de barrage, Synthèse et recommandations. Paris, Commission Internationale des Grands Barrages, Bulletin 111. Marche, C. (2004). Barrages : crues de rupture et protection
civile, Presses Internationales Polytechniques.
Marche, C., J. Gagnon, T.-T. Quach, R. Kahawita and P. Beauchemin (1997). Simulation of dam failures in multidike reservoirs arranged in cascade. J. Hydraul. Eng.-ASCE 123(11): p. 950-961.