Application of the CALUX bioassay for epidemiological
study: analyses of Belgian human plasma
Nathalie Van Wouwe1, Noemi Debacker1, Andre Sasse1, Isabelle Windal 1, Huig Vanderperren2, Gauthier Eppe3, Celine Xhrouet 3, Sophie and Ilse Carbonnelle and
Van Overmeire1, Edwin De Pauw3, Herman Van Oyen1, Francis Sartor1, Leo Goeyens1 1
Scientific Institute of Public Health, 14 J Wytsman Street, B-1050 Brussels, Belgium 2
Federal Agency for the Safety of the Food Chain, Leuven Road 17, B-3080 Tervuren, Belgium
3
Center of Analysis of Residues in Traces (CART), University of Liège, B6C Sart-Tilman, B-4000 Liège, Belgium
Introduction
The CALUX bioassay is a promising screening method for the detection of dioxin-like compounds. The observed good sensitivity, low number of false negative results as well as the good correlations with the GC-HRMS TEQ-values in case of feed and food analyses allow this method to climb in the first assessment methods’ scale1,2,3. The low amount of sample needed in addition to those lattest advantages suggest that the CALUX bioassay could be a good screening method for epidemiological studies. The Belgian epidemiological study concerning the possible effect of the dioxin incident on the body burden of the Belgian population was an opportunity to test this method in comparison to the gold reference one : the GC-HRMS.
The first part of this abstract presents epidemiological parameters (sensibility, specificity,...) of the CALUX bioassay using CALUX TEQ-values as estimators of the TEQ-values of the 17 PCDD/Fs. The second part examines epidemiological determinants observed for CALUX and GC-HRMS TEQ-values.
Methods and Materials
Sample collection
In 1998 and 2000, a total of 478 plasma samples from 239 donors were collected by the Belgian Red Cross to evaluate the impact of the dioxin crisis on the dioxin body burdens. Those samples, collected in polyethylene bags (PE), were directly frozen at -80°C after donation. In the beginning of 2002, plasma samples were thawed and divided in accordance with the 3 analyses to perform: 60-250 mL for the determination of 17 PCDD/Fs and 4 cPCBs by GC-HRMS, 60 mL for the TEQ-value obtained by CALUX bioassay and 60 mL for the determination of the 7 PCB markers. All aliquots were stored in PE tubes and kept at -20°C until analyses.
In addition to the second donation, donors were asked to fill in a questionnaire on their personal characteristics (weight, height, age, intake of medicine, smoking habits,…), their potential
environmental exposure (working place, living place, proximity of an incinerator,…) and their dietary habits (frequency of consumption of meat, eggs, fish,…). More details on the studied population are presented by Debacker et al4.
Chemical and bio-analyses
The Center of Analysis of Residues in Traces (CART, Liège, Belgium) was in charge of the analyses of 17 PCDD/Fs and 4 non-ortho PCBs. After addition of a mixture of 13C-labelled standards, 40 mL of sample were mixed with formic acid and loaded on a Isolute C18 cartridge for extraction. The clean-up was performed on a Power-prep system using disposable silica, alumina and carbon columns. The purified extracts were then injected in a Helwett Packard 6890 series Gas Chromatography- Autospec Ultima High Resolution Mass Spectrometer5. Results were expressed in pg TEQ/g lipids using human WHO-TEF6.
CALUX analyses were performed by the Belgian Scientific Institute of Public Health (Brussels, Belgium) using mouse hepatoma H1L6.1 cells from XDS Inc. (Durham, USA). After a liquid-liquid extraction on 10 mL of plasma sample, the extract was purified on an acid silica column in series with an activated carbon column. After elution from the silica column, the extract was fractionated on the carbon column to yield fractions containing PCDD/Fs on one hand (DX fraction) and PCBs on the other hand (PCB fraction). Only the DX fraction was used for the determination of AhR activity. Measurements were performed using a Lucy 1 luminometer from Anthos Labtec (Salzburg, Austria). Results were expressed in pg TEQ/g lipids7.
Results and Discussion
Epidemiological parameters of CALUX bioassay as a screening for the 17 PCDD/Fs’ TEQ-value Results obtained for the validation of plasma analyses by CALUX bioassay were already reported7,8. In these previous papers, preliminary TEQ-values obtained for plasma by CALUX and GC-HRMS were plotted in order to compare and explain differences between the two methods. Now that all plasma samples of the study have been analysed, it is possible to present final results and calculate the characteristics of the CALUX bioassay as a screening for biological samples. To avoid underestimation of the GC-HRMS TEQ-values due to congeners under the limits of quantification, the concentrations of those congeners were estimated using an extrapolation based on the concentration of one other congener. This last was chosen on account of its concentration in the sample (above its LOQ) and the correlation observed with the non-quantifiable congener.By this way, the TEQ-value for GC-HRMS is closer to the real concentration than by applying correction with lower bound or upper bound values.
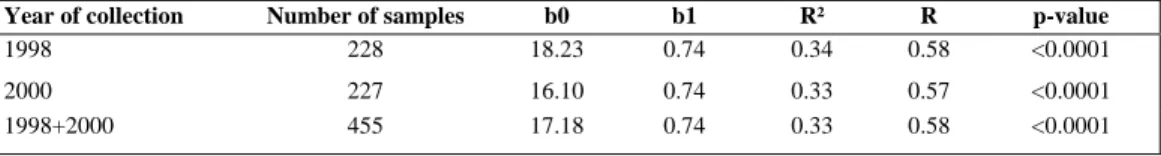
Choice of the data set: Among the 478 samples analyzed, 18 were not reported because of troubles during the lipid determination, the bio- or the chemical analyses. Moreover, 5 samples were considered as outliers in the comparison graph, and thus discarded for further calculations. Because each donor has given two samples of plasma, three separate correlation graphs were made to detect any discrepancy between samples of 1998 and 2000. A summary of the results obtained for the regression of CALUX TEQ-values in function of GC-HRMS TEQ-value for the 17 PCDD/F congeners is presented in Table 1. For those 3 data sets, the slope values are the same. Only small variations in the intercept values are observed and are mainly due to the extreme points of the graphs which differ in 1998 and 2000.
Mean and median concentrations are quite similar for samples of 1998 compared to those of 2000 regardless of the analytical method used (Table 2). However, as previously observed7,8, CALUX
TEQ-values are higher than GC-HRMS TEQ values. The presence of other AhR ligands in the DX fraction obtained for the bioassay is probably the major explanation of this difference.
Table 1: Regression equations obtained for CALUX values as a function of GC-HRMS
TEQ-values considering samples of 1998, 2000 or 1998 and 2000 (CALUX TEQ= b0 + b1 GC-HRMS TEQ)
Year of collection Number of samples b0 b1 R² R p-value
1998 228 18.23 0.74 0.34 0.58 <0.0001
2000 227 16.10 0.74 0.33 0.57 <0.0001
1998+2000 455 17.18 0.74 0.33 0.58 <0.0001
Table 2: Mean and median concentrations (pg TEQ/g lipids) observed by CALUX and GC-HRMS
for samples collected in 1998 and in 2000
CALUX analysis (pg TEQ/g lip) GC-HRMS analysis (pg TEQ/g lip) Year of
collection
Mean Median SD Range Mean Median SD Range
1998 38.1 35.6 17.8 2.8 – 103.0 26.7 25.2 14.0 0.3 – 93.2
2000 36.4 32.6 18.9 5.1 – 101.0 26.9 23.6 14.3 2.0 – 74.0
Sensibility and specificity of CALUX bioassay for plasma analyses: As observed in Tables 1 and 2, the difference between samples of 1998 and 2000 is minimal. For this reason, the 2 sets of samples were used for calculation of the sensibility and the specificity. To obtain curves of these two characteristics, the specificity and the sensibility were determined at different GC-HRMS TEQ-values as threshold limits (L). For each fixed limit, the number of samples showing CALUX and GC-HRMS TEQ-values above L (a), CALUX and GC-HRMS TEQ-values below L (d), CALUX TEQ-value higher than L with a GC-HRMS TEQ-concentration lower than L (b) as well as the number of samples in the opposite situation (c) were counted (Table 3). By definition, the sensibility at a threshold limit is the proportion of samples with CALUX and GC-HRMS TEQ-values above L on the number of samples with GC-HRMS TEQ-concentration higher than L, or a / (a + c). In opposition, the specificity at a fixed threshold limit is the proportion of samples with CALUX and GC-HRMS values below L on the number of samples with GC-HRMS TEQ-concentration under the limit, or d / (d + b).
Table 3: Calculation of the sensibility and the specificity for the fixed limit L:
sensibility = a / (a + c), specificity = d / (d + b)
GC-HRMS
TEQ value > L TEQ value < L
TEQ value > L a b
CALUX
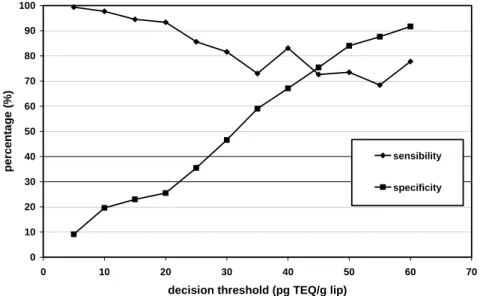
Figure 1 presents the curves of sensibility and specificity of CALUX bioassay in function of the GC-HRMS TEQ-concentration. In the case of plasma samples, the sensibility ranges from 68.4% to 99.4% and is the highest at low TEQ-concentrations. The specificity varies from 9.1% to 91.7% and raises as the GC-HRMS TEQ-value increases. These observations are in accordance with the regression equation presented before. The intercept value of 17.18 pg TEQ/g lipids shows clearly that the CALUX bioassay overestimates the GC-HRMS results at low contamination levels. In addition to this positive intercept, the slope value of 0.74 indicates that the differences between CALUX and GC-HRMS TEQ-values tend to decrease as PCDD/Fs concentration increases. Until now, no clear explanation for this higher discrepancy between the two methods at low levels of contamination was found.
For PCDD/Fs concentrations between 40 and 45 pg TEQ/g lip, the CALUX bioassay presents similarities in the percentage of sensibility and specificity, namely 75%. Below those concentrations, the sensibility improves while the specificity drops rapidly. At higher concentrations, the sensibility stays more or less constant and the specificity continues to rise. It seems that the CALUX bioassay gives a better estimation of the 17 PCDD/Fs’ toxicity for samples with concentrations higher than 40 pg TEQ/g lipids. However, calculations of specificity and sensibility at those high concentrations are based on a small number of data, since 77% of samples have TEQ-values under 40 pg TEQ/g lipids. Analyses by CALUX bioassay of a highly contaminated population could be interesting in order to improve the reliability of the present results.
Despite the loss of specificity at lower PCDD/Fs contamination levels, the observed good correlation between GC-HRMS and CALUX on the whole range of concentrations suggests that this bioassay could be used as a screening tool to distinguish a more contaminated population from a control population. This use was already demonstrated by Kayama and coworkers9. In this previous study, CALUX analyses have detected a Japanese district where female farmers presented higher TEQ-values. In this perspective, the GC-HRMS analyses would then be useful to identify the origin of the contamination.
0 10 20 30 40 50 60 70 80 90 100 0 10 20 30 40 50 60 70
decision threshold (pg TEQ/g lip)
per c enta g e (%) sensibility specificity
Figure 1: Curves of specificity and sensibility for CALUX bioassay in function of the GC-HRMS
TEQ concentrations of the 17 PCDD/F (pg TEQ/g lip) as decision threshold.
Percentage of false positives and false negatives: As previously described, the CALUX TEQ-value reflects the toxicity of all the AhR ligands present in the DX fraction, including their synergistic, additive and antagonistic effects on the Ah receptor. For this reason, it seems normal to obtain different TEQ-value than the GC-HRMS, which is based on the additive principle of toxicity. For the present study, only 20% of the samples had a CALUX TEQ-value below the GC-HRMS result. For most plasma samples, the CALUX bioassay gave a TEQ-value equal or higher than the toxicity of the 17 PCDD/Fs detected by GC-HRMS. In the case of blood, there is no norm on the PCDD/F content of samples. Therefore, it seems difficult and inappropriate to calculate false positive and false negative rates.
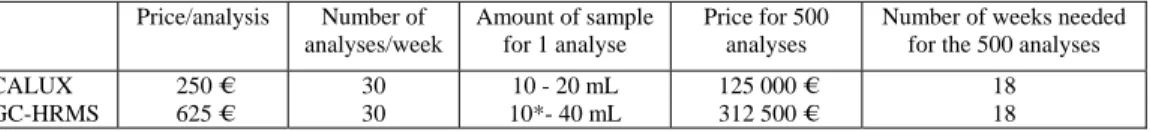
Cost comparison: The major advantages of CALUX bioassay is its price and the low amount of samples needed for one analysis. It is therefore less constraining for the sampling and the storage of samples. Moreover, for the same price, 2.5 times more analyses can be performed by CALUX. The time needed for analysis is the same for both methods in perfect conditions. However, technical problems with highly sensitive instruments like GC-HRMS cannot be neglected and will probably increase the 18 weeks foreseen for 500 analyses.
Table 4: Comparisons of price, time and amount of sample needed for the CALUX and the
GC-HRMS analyses Price/analysis Number of analyses/week Amount of sample for 1 analyse Price for 500 analyses
Number of weeks needed for the 500 analyses
CALUX 250 € 30 10 - 20 mL 125 000 € 18
GC-HRMS 625 € 30 10*- 40 mL 312 500 € 18
* Validation in progress
Available information: The GC-HRMS analysis is without any doubt more selective than the CALUX bioassay. It allows the determination of the contamination source on the basis of the observed profile of PCDDs and PCDFs. The CALUX bioassay gives a global TEQ-value of all the dioxin-like compounds present in the final extract, including the 17 PCDD/Fs and other AhR ligands. This permits contamination events caused by other dioxin-like compounds than PCDD/Fs, such as brominated dioxins or furans, to be detected by CALUX bioassay. For these reason, the two methods can be considered as complementary.
Epidemiological determinants of the CALUX and GC-HRMS TEQ-values
Knowing that CALUX presents a TEQ-value that is different but dependent on the TEQ-value obtained by GC-HRMS, some questions can be raised concerning the use for epidemiological study: What are the epidemiological factors that explain the TEQ-values of the two methods? Are they similar? Do the other AhR ligands have enough importance on the CALUX TEQ results to cover up determinants of the 17 PCDD/F congeners or are they going to introduce new determinants in the model for CALUX compared to GC-HRMS results?
To answer these questions, TEQ-values obtained by CALUX and GC-HRMS for samples collected in 2000 were regressed independently with the different host, dietary and environmental factors
collected through the questionnaire. All statistical treatments were performed on the logarithm of TEQ-values, using SAS® system for windows (8th edition).
After single regression performed on GC-HRMS TEQ-values, 6 factors were found to be significant determinants for the chemical TEQ results obtained for plasma samples: the age of donors (p<0.0001, R²=0.23), the number of years that donors have lived in their actual city (p=0.001, R²=0.05), the intake of medicine (p=0.004, R²=0.04), the consumption of soft drink (p=0.005, R²=0.04), the body mass index (p=0.03, R²=0.02) and the smoking habit (p=0.03, R²=0.02). However, the introduction of those factors in the multiple regression analysis showed that most of these were dependent on the age of donors. Indeed multiple regression revealed that only the age of donors (p<0.0001) and the consumption of dairy products (p=0.03) correlated significantly with the TEQ-values of the 17 PCDD/Fs.
For CALUX TEQ-values single regression also revealed a significant effect for 4 of the 6 factors that were significant for the GC-HRMS values: the age of donors (p<0.0001, R²=0.10), the consumption of soft drink (p=0.009, R²=0.03), the intake of medicine (p=0.01, R²=0.03) and the smoking habits (p=0.03, R²=0.02). The two other factors found to be significant for GC-HRMS TEQ-values presented p-values between 0.05 and 0.06. Analogously, the introduction of all the possible determinants in multiple regression analysis reduced the model to only two factors: the age of donors (p<0.0001) and the consumption of full-cream milk (p=0.03). In this case, the smoking habit was nearly significant, with higher CALUX TEQ-values for non smokers.
Comparison of the determinants of the two methods seems to indicate that the donor’s age is the most important determining factor for both TEQ-results. The coefficient of determination of 0.10 observed for this factor on the CALUX TEQ-value is similar to the one previously reported by Kayama and coworkers with the same CALUX bioassay9. More surprising is the significant correlation of one specific dairy product for CALUX bioassay compared to GC-HRMS. This difference may be due to analytical deviations for some samples. When considering the total dairy consumption (milk, cheese, butter,…) instead of the full-cream milk consumption solely for the multiple regression analysis of CALUX, the dairy products are nearly a significant determinant (p=0.057). In any way, whatever the analytical method used, these results seem to indicate that dairy products are the major sources of PCDD/Fs in the Belgian population. No correlation with the consumption of fish, meat or animal fat other than dairy products was found with TEQ-values of plasma.
References
1 Vanderperren H., Van Wouwe N., Behets S., Windal I., Van Overmeire I., Fontaine A. (2004) Talanta, in press.
2 Tsutsumi T., Amakura Y., Nakamura M., Brown D.J., Clark G., Sasaki K., Toyoda M., Maitani T. (2003) Analyst, 128, 486.
3 Brown D.J., Goeyens L., Van Overmeire I., Chu M., Murata H., Clark G. (2001) Organohalogen Compounds, 54, 32.
4 Debacker N., Sasse A., Van Wouwe N., Eppe G., Xhrouet C., Windal I., Carbonnelle S., Van Overmeire I., De Pauw E., Sartor F., Van Oyen H., Goeyens L. (2004) Organohalogen Compounds, this conference.
5 Focant J-F, De Pauw E. (2002) Journal of Chromatography B, Vol 776, 199.
6 Van den Berg M., Birnbaum L., Bosveld A., Brunström B., Cook P., Feeley M., et al (1998) Environmental Health Perspectives, 106, 775.
7 Van Wouwe N., Windal I., Vanderperren H., Eppe G., Xhrouet C., Massart A-C., Debacker N., Sasse A., Baeyens W., De Pauw E., Sartor F., Van Oyen H., Goeyens L. (2004) Talanta, in press.
8 Van Wouwe N., Eppe G., Xhrouet C., Windal I., Vanderperren H., Carbonnelle S., Van Overmeire I., Debacker N., Sasse A., De PauwE., Sartor F., Van Oyen H., Goeyens L.(2003) Organohalogen Compounds, 60, 211.
9 Kayama F., Horiguchi H., Oguma E., Fujino J., Yabushita H., Brown D.J., Clark G. (2002) Organohalogen Compounds, 55, 275.