COMMUNAUTÉ FRANÇAISE DE BELGIQUE UNIVERSITÉ DE LIÈGE – GEMBLOUX AGRO-BIO TECH
Assessing microbial diversity changes
associated with different tillage and
crop residue managements: study case
in a loamy soil
Florine DEGRUNEEssai présenté en vue de l’obtention du grade de docteur en sciences agronomiques et ingénierie biologique
Promoteur: Micheline VANDENBOL 2017
Copyright. Aux termes de la loi belge du 30 juin 1994, sur le droit d’auteur et les droits voisins, seul l’auteur à la droit de reproduire partiellement ou complètement cet ouvrage de quelque façon et forme que ce soit ou d’en autoriser la reproduction partielle ou complète de quelque manière et sous quelque forme que ce soit. Toute photocopie ou reproduction sous autre forme est donc faite en violation de la dite loi et des modifications ultérieures.
« Everybody is a genius. But if you judge a fish
by its ability to climb a tree it will live its whole life believing that it is stupid»
CHAPTER I. GENERAL INTRODUCTION 1
1. GENERAL CONTEXT 2
MODERN AGRICULTURE: BENEFITS, TRADE-OFFS AND FUTURE CHALLENGES 2
SOIL MICROBIOME: A KEY FACTOR FOR SOIL FUNCTIONING 4
SOIL TILLAGE: BENEFITS AND DETRIMENTAL EFFECTS 5
2. CONTEXT, OBJECTIVES AND OUTLINE OF THE THESIS 7
CONTEXT 7
OBJECTIVES 9
OUTLINE 10
3. SITE DESCRIPTION, EXPERIMENTAL DESIGN AND SAMPLING PROTOCOL 11
SITE DESCRIPTION 11
EXPERIMENTAL DESIGN 18
SAMPLING PROTOCOL 20
4. METHODS USED TO EXPLORE THE SOIL MICROBIOME 22
5. REFERENCES 24
6. SUPPLEMENTARY MATERIAL 27
CHAPTER II. CROP RESIDUE MANAGEMENT IN TEMPERATE CLIMATE: A REVIEW 29
1. ABSTRACT 30
2. INTRODUCTION 31
3. LITERATURE 32
4. CONCLUSION 41
5. REFERENCES 42
CHAPTER III. A NOVEL SUB-PHYLUM METHOD 47
1. ABSTRACT 48
2. INTRODUCTION 49
3. MATERIALS AND METHODS 51
4. RESULTS AND DISCUSSION 57
5. CONCLUSION 67
CHAPTER IV. NO FAVOURABLE EFFECT OF REDUCED TILLAGE 71
1. ABSTRACT 72
2. INTRODUCTION 73
3. MATERIALS AND METHODS 75
4. RESULTS 79
5. DISCUSSION 91
7. CONCLUSION 96
8. SUPPLEMENTARY MATERIAL 97
9. REFERENCES 102
CHAPTER V. TILLAGE EFFECT OVER THE GROWING SEASON 105
1. ABSTRACT 106
2. INTRODUCTION 107
3. MATERIALS AND METHODS 109
5. RESULTS 113
6. DISCUSSION 121
7. CONCLUSION 130
8. REFERENCES 131
CHAPTER VI. GENERAL DISCUSSION, CONCLUSIONS, AND PROSPECTS 137
1. GENERAL DISCUSSION 138
BACK TO THE WALLOON CONTEXT 138
THE TILLAGE REGIME AFFECTS CHEMICAL AND PHYSICAL SOIL CONDITIONS… 141
…THEREBY ALTERING THE STRUCTURE OF MICROBIAL COMMUNITIES 142
MICROBIAL RESPONSES DEPEND ON DEPTH AND GROWING SEASON 144
WHAT ARE THE ECOLOGICAL MEANINGS OF OUR FINDINGS? 146
METHODOLOGICAL LIMITATIONS 150
2. AGRONOMIC CONCLUSION 153
3. PROSPECTS AND IMPROVEMENTS 154
INCREASING THE NUMBER OF OBSERVATIONS 154
INCREASING THE OBSERVATION PERIOD 154
ENLARGED TO DIFFERENT SOIL TEXTURE CONDITIONS 155
GAINING KNOWLEDGE WITH COMPLEMENTARY APPROACHES 158
AGRONOMIC PERSPECTIVES 160
4. CLOSING WORDS 161
The major challenge of modern agriculture is to produce enough food for the growing population, and at the same time, minimize environmental harm. To meet this challenge, Agroecology aims to replace non-renewable external inputs with ecological processes to diversify the ecosystem services and attenuate the dis-services of agriculture. In this light, the ability to manage the soil microbiota, that has great effects on soil quality, is receiving attention. Plowing, the most widely used tillage practice in intensive agriculture has proven its efficiency in maximizing crop productivity, but its long term detrimental effects on soil quality, such as soil erosion and organic matter loss, have called for alternative tillage practices. However, the success of the implementation of these practices in Europe is still debated. In the upper part of Wallonia (Belgium), the soil is highly fertile and 80% of land is occupied mostly by intensive cropping systems. To date in Walloon cropping systems, few studies have explored the soil microbiota in association with different soil managements.
Here, we used a meta-barcoding approach to explore differences in soil microbial community structure under two contrasting tillage regimes, conventional (CT) and reduced tillage (RT), either with or without crop residue retention. The effects of these soil treatments were explored at different depths and during the growing season of two crops.
Our work demonstrated clear differences in microbial diversity between tillage regimes, but no clear differences between residue management practices. The observed differences appeared to be associated with differences in physical (e.g. structure and moisture) and chemical (nutrients) soil properties. Notably, the nutrient concentrations and moisture were higher under CT than under RT. Overall, soil under CT had higher or similar microbial diversity than under RT. Analysis of β-diversity revealed differences in the taxonomic structure of microbial communities. Certain microbial groups were more abundant under CT than under RT and vice versa. For example, mycorrhizal fungi, economically and ecologically important in agroecosystems, were more abundant under RT. Finally, the magnitude of tillage effects on the microbial diversity varied strongly with the sampling depth, whereas it varied moderately with the growing season.
This work highlighted CT was not necessarily unfavourable in maintaining microbial diversity when compared to RT. However, the study raises new questions regarding the impacts of microbial diversity changes on soil functioning. We encourage researchers to undertake further investigations into the functional role of microbiota in order to improve our understanding of agroecosystem functioning and its sustainability.
Un défi majeur de l’agriculture moderne est de produire suffisamment de nourriture pour une population grandissante tout en garantissant l’intégrité de l’environnement. Afin de répondre à ce défi, l’Agroécologie a pour objectif de remplacer l’utilisation d’intrants non-renouvelables par des processus écologiques, afin de diversifier et de maximiser la production de services écosystémiques, et d’atténuer ainsi les dis-services liés à l’agriculture. Dans ce contexte, la capacité de manipuler le microbiote du sol, ayant des effets conséquents sur la qualité du sol, reçoit une attention toute particulière. La technique du labour, le type de travail du sol le plus largement utilisé en agriculture intensive, a d’ores et déjà prouvé son efficacité dans la maximisation de la production agricole. Mais, ces effets délétères sur la qualité du sol, observables sur le long terme, incluant notamment l’érosion des sols et des pertes en matières organiques, a suscité le développement de techniques alternatives. Cependant, force est de constater que le succès de l’implémentation de telles pratiques en Europe est encore fortement débattu. Dans la partie nord de la Wallonie (Belgique), le sol est très fertile et 80% des terres sont occupées par des grandes cultures gérées, pour la grande majorité, de manière intensive. Aujourd’hui, dans les systèmes wallons de grandes cultures, très peu d’études ont été lancées dans l’exploration du microbiote du sol en association avec différents types de gestions du sol.
Dans la présente étude, nous avons utilisé une approche de « meta-barcoding » pour explorer les différences de structure des communautés microbiennes du sol sous différents types de travaux du sol, conventionnel (CT) et réduits (RT), soit avec (R+) ou sans (R-) restitution des résidus de cultures. Ces effets ont également été explorés à différentes profondeurs du sol et au cours de la croissance végétale de deux cultures.
Notre étude démontre des différences significatives de diversité microbienne entre les types de travaux du sol, mais aucune différence claire n’est établie en fonction de la gestion des résidus de culture. Les effets observés ont été mis en relation avec des variations dans les propriétés physiques (ex : structure et humidité) et chimiques (nutriments) du sol. Notamment, la concentration en nutriments et l’humidité est plus élevées sous CT par rapport à RT. De manière générale, la diversité microbienne est plus élevée ou similaire sous CT par rapport à RT. L’analyse de la diversité β a révélé des différences majeures dans la structure taxonomique des communautés microbiennes du sol. Certains groupes microbiens sont plus abondants sous CT par rapport à RT et vice versa. Par exemple, les champignons mycorrhizien, économiquement et écologiquement importants dans les systèmes agricoles, sont plus abondants sous RT. Enfin, l’effet
du travail du sol sur les communautés varie fortement fonction de la profondeur d’échantillonnage, alors qu’il varie plus modérément en fonction de la saison culturale.
Notre travail a permis de mettre en évidence que le labour conventionnel ne représentait pas nécessairement un frein dans le maintien de la diversité microbienne du sol par rapport au travail du sol simplifié. Cependant, notre étude soulève de nouvelles questions concernant l’effet de la diversité microbienne sur le fonctionnement global du sol. Nous encourageons de futures recherches à explorer le rôle fonctionnel du microbiote du sol afin d’améliorer notre compréhension du fonctionnement des agroécosystèmes ainsi que leur durabilité.
I wish to express my sincere gratitude to my thesis committee: Prof. Micheline Vandenbol, Prof. Bernard Bodson, Prof. Gilles Colinet, Prof. Aurore Degré, Prof. Marc Dufrêne, Dr. Christian Roisin (CRAw), and Dr. Pierre-Alain Maron (UMR Agroécologie, INRA Dijon, France), for insightful comments and encouragement, and also for the hard questions which prompted me to broaden my research to encompass various perspectives. I also wish to thank my supervisor Prof. Micheline Vandenbol for continuously supporting my PhD study and related research, for her motivation, and for her trust in my ability to conduct my research properly in a new field of microbial ecology.
A large part of my work would not have been possible without efficient collaboration with Dr. Martin Hartmann during my seven-month stay at WSL - the Swiss Federal Institute for Forest, Snow and Landscape Research in Zürich. His valuable professional qualities helped me to develop new expertise in bioinformatics and statistics, and his encouragement and patience substantially increased my confidence in my work. I would also like to express my gratitude to Beat Frey and Ivano Brunner for their warm-hearted welcome to their research unit at WSL. Besides my work at WSL, I also joined an enthusiastic research team and I wish to thank sincerely the different people with whom I spent some very nice moments: Aline, Thomas, and Virgine, the “French connection”, with whom I shared a memorable Swiss fondue and skiing time, Claude, the Swiss German introduced me to Swiss culture, and the other very nice people I met during my stay.
It is well known the best way to express feelings accurately is to use one’s mother tongue. Therefore I will continue in French to express my gratitude to my colleagues, friends, and family. Mon doctorat aura été une merveilleuse aventure dans laquelle je me suis épanouie et découverte notamment grâce aux nombreuses rencontres réalisées à Gembloux. Je voudrais commencer par remercier chaleureusement les collègues du laboratoire : Marjolaine, Nicolas, Sébastien, Michèle et Renée. Leur présence dans les moments plus difficiles de ma thèse ont été d’un soutien plus que réconfortant et un vrai moteur pour rester à flot. Au-delà de ces moments, nous avons vécu ensemble des vrais moments de partage et de dialogue.
Je voudrais ensuite remercier plus que chaleureusement le prof. Marc Dufrêne. Dès le début, il m’a transmis sa passion pour les grands jeux de données et les analyses multivariées. Au-delà de l’aspect purement technique, son soutien et sa confiance en mes capacités m’ont souvent donné des ailes pour aller de l’avant et persévérer.
Je voudrais remercier la plateforme AgricultureIsLife qui m’a permis de mener ma recherche à bien, ainsi que Sarah Garré et tous les doctorants qui en font partie, et plus particulièrement l’axe 2 : Marie, Marie-Pierre, Sophie et Nargish. Je remercie également toutes les personnes que j’ai croisées au cours de ma thèse que ça soit au détour d’un champ de blé pour des prélèvements de sol (Jean-Charles), ou au cours d’une réunion avec des échanges très stimulants et constructifs (Jean-Thomas et Fanny), ou encore autour d’un café.
Les amis ont également été un pilier important dans ma réussite : ma poulette préférée, Sandrine pour boire un petit porto et se raconter les derniers potins, ainsi que les potes de l’escalade qui n’ont jamais trop rien compris à mon travail, mais qui m’ont permis de « décrocher » pendant quelques heures salutaires par semaine : Bruno, Greg, Arnaud, Laurence, Thibaut, Mathieu, Kevin, Max, Vincent et tous les autres gros muscles (et moins gros muscles) de la salle à Bebloc.
Enfin, je remercie plus que chaleureusement mes amis très proches : Léo et Mimi, ainsi que ma famille : Phil et Liva, mes beaux-parents Michel et Francine, et enfin Gil, l’homme qui partage ma vie et qui a été d’un soutien plus que nécessaire dans cette aventure. Ils ont toujours été là pour moi et m’ont toujours soutenue autant dans ma vie personnelle que professionnelle.
Figure 1 Conceptual framework for comparing trade-offs of ecosystem services in intensive (left) and
ecological-based (right) farming (according to Foley, 2005). _____________________________________ 3
Figure 2 Schematic representation of soil disturbance continuum associated with different tillage
practices ranging from conventional tillage (highest soil disturbance) to no tillage (lowest soil disturbance). HL=high disturbance and LD=low disturbance. Source: modified after Reicosky (2015). 6
Figure 3 Map showing land use in Wallonia (South part of Belgium). The upper part of Wallonia (north
of the river) is mostly occupied by cropping systems. Source: SPF Economie - DGSIE (INS-Occupation du sol - 2004). __________________________________________________________________________________ 8
Figure 4 Map of soil pH in the 0-30 cm soil horizon in SOLRESIDUS experiment. The map was obtained
using the Kriging method for interpolation with the software ArcGIS.______________________________ 12
Figure 5 Map of soil total organic carbon (TOC) in the 0-30 cm soil horizon in SOLRESIDUS experiment.
The map was obtained using Kriging method for interpolation with the software ArcGIS. __________ 13
Figure 6 Map of phosphorus (P) availability in the 0-30 cm soil horizon in SOLRESIDUS experiment. The
map was obtained using the Kriging method for interpolation with the software ArcGIS. ___________ 14
Figure 7 Map of the potassium (K) availability in the 0-30 cm soil horizon in SOLRESIDUS experiment.
The map was obtained using the Kriging method for interpolation with the software ArcGIS. _______ 15
Figure 8 Map of potassium (K) availability in the 0-30 cm soil horizon in SOLRESIDUS experiment. The
map was obtained using the Kriging method for interpolation with the software ArcGIS. ___________ 16
Figure 9 Map of magnesium (Mg) availability in the 0-30 cm soil horizon in SOLRESIDUS experiment.
The map was obtained using the Kriging method for interpolation with the software ArcGIS. _______ 17
Figure 10 Experimental design of the SOLRESIDUS experiment. Each treatment, i.e. CT/R+, CT/R-,
RT/R+ and RT/R- is replicated four times in a Latin square arrangement. RT=reduced tillage, CT=conventional tillage, R+=crop residues retention, and R-=crop residues removal ______________ 19
Figure 11 Moldboard plow employed on CT plots to mix and invert soil to a depth of 25 cm. Image
credit: Marie-Pierre Hiel. _______________________________________________________________________ 19
Figure 12 Schematic representation of the soil sampling protocol performed on all plots of the
SOLRESIDUS experiment. Each sampling is represented by a star and the soil depth of the sampling is in orange text. ________________________________________________________________________________ 20
Figure 13 Diagram of what variables are studied. On each soil sample, (1) bacterial and fungal
diversity was determined using molecular approach and (2) the soil physical and chemical properties were evaluated. The different steps to evaluate the taxonomic diversity of microbial communities is detailed and includes the DNA extraction, amplification of genetic marker, bioinformatics to cure and assign the sequences, and statistical analysis to explore the differences in taxonomic diversity among the different soil treatments. ________________________________________ 21
Figure 14 454-pyrosequencing workflow (adapted from Mardis et al., (2008)). The library construction
ligates adaptors to DNA fragments that are further attached on beads and amplified millions of times in emulsion PCR. The beads are loaded into plate wells with enzymes for sequencing. The pyrosequencing reaction is based on the emission of a light signal when a new base (ACGT) is incorporated. The output sequences are further processed in downstream bioinformatics analysis. 23
Figure 15 Different soil treatments applied to the experimental field: a reduced tillage, crop residues
by plowing. Both pictures show the appearance of the soil before and after passage of the machine which prepares the soil and sows simultaneously. _______________________________________________ 50
Figure 16 Barplot representation of the relative abundances for each treatment (based on the sums
of the 4 replicates) of a soil bacterial and b soil fungal phyla. ____________________________________ 59
Figure 17 Factorial map of the redundancy analysis carried out on soil bacterial community
composition at a phylum level and b the most precise taxonomic level attainable. Axes 1 and 2 represent the maximum percentage of variance that can be explained by soil practice: tillage practice (conventional tillage; CT or reduced tillage; RT) and crop residue management practice (residue retention; R+ or residue removal; R-). For both analyses, a statistical test (ANOVA, n=4) was performed to assess the effect of soil management practice on bacterial community composition. At phylum level, there appeared no difference in bacterial community between soil management practices, while differences due to tillage practice were observed at the more precise level, this factor accounting for 13% of the bacterial community between soil management practices, while differences due to tillage practice were observed at the more precise level, this factor accounting for 13% of the bacterial community variation (p<0.01). __________________________________________ 65
Figure 18 Factorial map of the redundancy ordination analysis of soil fungal community composition
at a phylum level and b the most precise taxonomic level attainable. Axes 1 and 2 represent the maximum percentages of variance that can be explained by soil practice, i.e. by tillage practice (conventional tillage, CT; reduced tillage, RT) and crop residue management practice (residue retention, R+; residue removal, R-). For both analyses, a statistical test (ANOVA, n=4) was performed to assess the effect of soil practice on fungal community composition. At both phylum level and the more precise level, there appear differences in fungal community composition between soil practices, with tillage practice accounting, respectively, for 16% and 18% of the variation (p<0.05 and p<0.01). __________________________________________________________________________________ 66
Figure 19 Bar plot representation of the relative abundances of (a) bacterial and (b) fungal phyla in
the soil according to the depth and treatment applied. Soil treatments are defined by RT for reduced tillage, CT for conventional tillage, R+ for crop residue retention and R- for residue removal. Depths are defined by A for 0–5 cm and B for 15–20 cm. ________________________________________ 80
Figure 20 Boxplots of operational taxonomic units (OTUs) richness and Shannon diversity index for
bacteria (a) and fungi (b). Soil treatments are defined by RT for reduced tillage, CT for conventional tillage, R+ for crop residue retention and R- for residue removal. Depths are defined by A for 0–5 cm and B for 15–20 cm. ___________________________________________________________________________ 82
Figure 21 Sample-based rarefaction curves drawn to compare the γ-diversity between conventional
(CT) and reduced tillage (RT) for (a) bacteria and (b) fungi, and to compare the γ-diversity between the top soil (0–5 cm) and deeper soil (15–20 cm) for (c) bacteria and (d) fungi. ___________________ 83
Figure 22 (a) Constrained ordination analysis of Bray-Curtis distances based on the relative
abundances of bacterial taxa for each sample. The axes CAP1 and CAP2 explain, respectively, 21% and 7% of the community variation. Each triangle corresponds to a sample, identified by color coding and symbol filling. Four groups of samples can be distinguished: green, empty: CT, 0–5 cm; blue, empty: CT, 15–20 cm; green, full: RT, 0–5 cm; blue, full: RT, 15–20 cm. CT = conventional tillage and RT = reduced tillage. (b) Correlation between physico-chemical variables and samples: N = nitrogen, K = potassium, TOC = total organic content, P = phosphorus, Mg = magnesium, HWC = hot water carbon, Ca = calcium, Na = sodium. Variables with stars are significantly correlated to the samples. Significance levels are as follows: ** significant at p < 0.01; *** significant at p < 0.001. ____ 86
Figure 23 (a) Constrained ordination analysis of Bray-Curtis distances based on the relative
abundances of fungal taxa for each sample. The axes CAP1 and CAP2 explain, respectively, 21% and 7% of the community variation. Each triangle corresponds to a sample, identified by color coding and symbol filling. Four groups of samples can be distinguished: green, empty: CT, 0–5 cm; blue, empty: CT, 15–20 cm; green, full: RT, 0–5 cm; blue, full: RT, 15–20 cm. CT = conventional tillage
and RT = reduced tillage. (b) Correlation between physico-chemical variables and samples: N = nitrogen, K = potassium, TOC = total organic content, P = phosphorus, Mg = magnesium, HWC = hot water carbon, Ca = calcium, Na = sodium. Variables with stars are significantly correlated to the samples. Significance levels are as follows: ** significant at p < 0.01; *** significant at p < 0.001. ____ 87
Figure 24 Numbers of bacterial and fungal indicator taxa found in the Indval analysis. CT =
conventional tillage, RT = reduced tillage. ______________________________________________________ 90
Figure 25 Example of indicator taxa liable to play an ecological role influencing crop productivity.
CT = conventional tillage, RT = reduced tillage. _________________________________________________ 95
Figure 26 Effects of tillage regime and growing stage on bacterial and fungal β- (A) and α-diversity
(B). The PCO ordination axes PCO1 and PCO2 explain 11% and 10% of the bacterial community variation, respectively, and 19% and 12% of the fungal community variation, respectively. Tillage regime is represented by color code with CT=red and RT=red and growing season is represented by numbers with 1=seedling, 2=leaf development, 3=flowering, 4=tillering, 5=grain filling). The faba bean season corresponds to stages 1, 2 and 3, and the wheat season corresponds to stages 4 and 5. Values represent the heterogeneity of variance for tillage effect as assessed by PERMDISP. ______115
Figure 27 Standardized relative changes in physical and chemical soil properties combined over all
growing stages (a) as well as for each individual stage (b) between CT (red) and RT (green). Data were z-transformed, representing values greater or smaller than the average across all samples. The significance of the PERMANOVA test is indicated in brackets: the first argument represents the significance of tillage effect and the second represents the significance of the interaction between tillage and growing stage. K=potassium, P=phosphorus, Nmin=mineral nitrogen, NO3=nitrate, Ca=calcium, HWC=hot water carbon, Mg=magnesium, NH4=ammonium, Na=sodium. CT, conventional tillage; RT, reduced tillage; *** q<0.001; ** q<0.01; * q<0.05; ns, not significant. ______118
Figure 28 Standardized relative changes in abundance of higher-order taxonomic groups between
CT (red) and RT (green) across all growing stages (a) and separately for each individual growing stage. Data were z-transformed, representing values greater or smaller than the average across all samples. The relative abundance as well as the significance of the PERMANOVA test is indicated in brackets: the first argument represents the relative abundance, the second is the significance of tillage effect and the third represents the significance of the interaction between tillage and growing stage. CT, conventional tillage; RT, reduced tillage; *** q<0.001; ** q<0.01; * q<0.05; ns, not significant. ___________________________________________________________________________________120
Figure 29 Taxonomic networks showing the distribution of bacterial and fungal OTU across the
taxonomic hierarchy. Nodes correspond to OTUs and nodes size corresponds to their relative abundance (square root) in the dataset. Edges (lines connecting the nodes) represent the taxonomic path from phylum to OTU level, whereas OTUs are placed at the level of the lowest possible assignment. The response of individual OTUs to tillage was mapped onto the taxonomic network with green nodes corresponding to OTUs responding positively to reduced tillage (RT) and red nodes corresponding to OTUs responding positively to conventional tillage (CT). The color intensity was related to the strength of the tillage effect and only significant nodes were color-coded (q<0.05). All OTUs are visualized, but only the robust OTUs occurring in at least 25% of all samples (= 20 samples) were statistically evaluated. ___________________________________________129
Figure 30 Summary of the most frequently reported changes in soil properties after several years of
no-till (according to Basch et al., (2015)). ______________________________________________________138
Figure 31 Percent difference (positive or negative) in sugar beet yield between reduced and
conventional tillage (according to Roisin et al. (1997)). _________________________________________140
Figure 32 Schematic representation of OTU distribution in the microbial community. Left: the
community is dominated by a few OTUs (low evenness), right: the OTUs are more equally distributed (high evenness), the number of OTUs being the same in both cases. ____________________________143
Figure 33 Schematic representation of α-diversity index values found in our study under CT
(conventional tillage) and RT (reduced tillage). OTU richness (S) reflects the number of different OTUs, while both Shannon (H) and Smith-Wilson (SW) reflect OTU eveness. H combined richness and eveness, while SW is richness independent and reflect eveness only. ____________________________144
Figure 34 Schematic representation of field-based and technique-based pitfalls and limitations of
the method to explore the soil microbial diversity. ______________________________________________150
Figure 35 Map of the Walloon soil types (in french). The soil in the upper part is highly fertile (orange
area) and widely used for cropping. Within this area, there is a wide range of different soil textures. Source: Bock et al. (2006). ____________________________________________________________________156
Figure 36 Boxplot representation (n=9) of organic carbon concentration in different size class of
aggregates, and in relation to different farming systems: green=organic and red=conventional, under contrasted textural soil (silty and sandy). The magnitude of the impact of the farming system on the C concentration might differ according to the soil texture. _______________________________157
Figure 37 Farms4Future preliminary results on the effects of the farming system and soil texture on
bacterial and fungal β-diversity. On the basis of distances among groups, the farming system effect appears larger for silt samples than for sand samples. The farming system is represented by a color code with conventional=red and organic=green and the soil texture is represented by the colour used to fill the symbol, with silt=grey and sand=coloured. _______________________________________157
Figure 38 Brief overview of available methods to explore the diversity of active microorganisms
(according to Blagodatskaya and Kuzyakov (2013)). ___________________________________________158
Figure 39 Schematic representation of the two approaches (taxonomy and traits) to linking microbial
community structure to functions and finally ecosystem services. _______________________________159
Figure 40 Schematic representation of two different and complementary approaches, holistic and
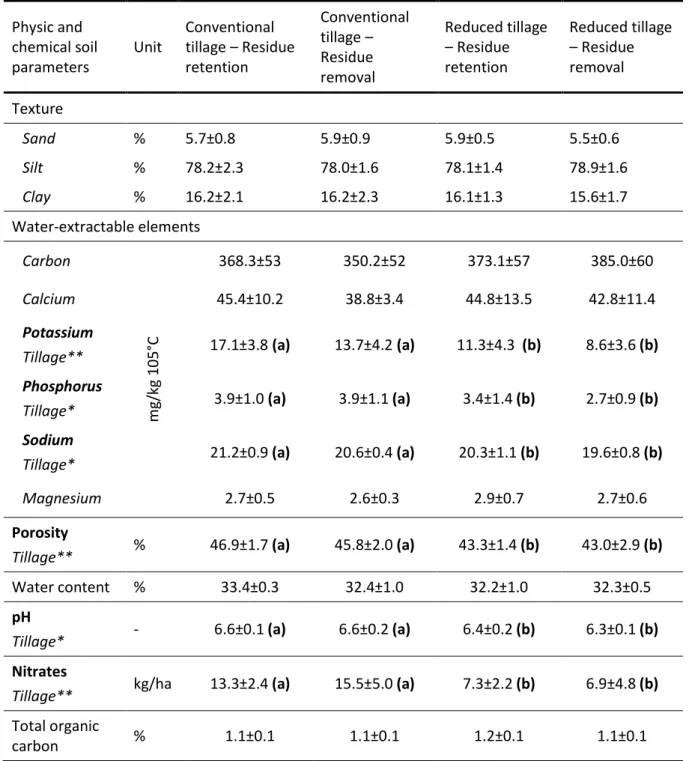
Table 1 Statement of our assumptions. __________________________________________________________ 9 Table 2 Descriptive statistics of SOLRESIDUS soil parameters. ______________________________________ 11 Table 3 Average physicochemical soil parameters according to the soil treatment (tillage practice:
conventional or reduced tillage) and type of crop residue management (residue retention or residue removal). _____________________________________________________________________________ 54
Table 4 Soil alpha diversity indexes for each treatment, on the basis of operational taxonomic units
(based on averages of 4 replicates). ___________________________________________________________ 60
Table 5 Results of the Likelihood Ratio Test, i.e. the comparison of two linear mixed models, the null
model without the factor of interest and the full model with the factor of interest in order to detect the effect of the factors on the a-diversity indexes. ______________________________________________ 81
Table 6 Means and standard deviations of the α-diversity indexes (richness and Shannon) of bacteria
and fungi according to the factors of variation. _________________________________________________ 81
Table 7 Results of the constrained ordination analysis (db-RDA using the Bray-Curtis distance) for
bacteria and fungi. ___________________________________________________________________________ 85
Table 8 Means and standard deviations of the soil physical and chemical parameters according to
the factors of variation.________________________________________________________________________ 89
Table 9 Field operations performed on the SOLRESIDUS experiment in 2012 and 2013. ____________110 Table 10 Effects of tillage regime, crop residue management, and growing season on bacterial and
fungal β-diversity. ____________________________________________________________________________114
Table 11 Effects of tillage regime, crop residue management, and growing season on bacterial and
fungal α-diversity. ____________________________________________________________________________114
Table 12 Effects of tillage regime, crop residue management, and growing stage on soil physical
S1 Dates of field operations on SOLRESIDUS in 2012, 2013 and 2014. In green text; the different
phytosanitary treatments, in blue; the nitrogen fertilization, and in brown; the soil sampling.________ 27
S2 Date of Fertilizer, fungicide, and weedkiller applications. Each treatment was applied equally on
each plot. ____________________________________________________________________________________ 97
S 3 Rarefaction curves of 16S rRNA genes sequences at (a) the top (0 to 5 cm) and (b) deeper (15 to
20 cm) soil indicating the observed number of operational taxonomic units (OTUs) at a genetic distance of 3% for the different tillage regime, i.e. conventional tillage (CT) vs. reduced tillage (RT), and crop residues management, i.e. residues retention (R+) vs. removal (R-). _____________________ 98
S 4 Rarefaction curves of 28S rRNA genes sequences at (a) the top (0 to 5 cm) and (b) deeper (15 to
20 cm) soil indicating the observed number of operational taxonomic units (OTUs) at a genetic distance of 3% for the different tillage regime, i.e. conventional tillage (CT) vs. reduced tillage (RT), and crop residues management, i.e. residues retention (R+) vs. removal (R-). _____________________ 99
S 5 Indicator bacterial taxa found for each set of soil conditions, their relative abundance (abund,
%) and their indicative value (Indval, %). CT=conventional tillage and RT=reduced tillage. _______100
S 6 Indicator fungal taxa found for each set of soil conditions, their relative abundance (abund, %)
AMF: arbuscular mycorrhizal fungi bp: base pair
C: carbon Ca: calcium
CT: conventional tillage DNA: deoxyribonucleic acid
FAO: food and agriculture organization HWC: hot water carbon
K: potassium Mg: magnesium N: nitrogen
Nmin: mineral nitrogen NH4+: ammonium NO3: nitrates Na: sodium
OM: organic matter
OTU: operational taxonomic unit P: phosphorus
R-: crop residue removal R+: crop residue retention rRNA: ribosomal ribonucleic acid RT: reduced tillage
PUBLICATIONS
FIRST AUTHOR
Florine Degrune, Marc Dufrêne, Gilles Colinet, Sébastien Massart, Bernard Taminiau, Bernard Bodson, Marie-Pierre Hiel, Carine Nezer, Georges Daube, Micheline Vandenbol, 2015. A novel sub-phylum method discriminates better the impact of management on soil microbial community. Agronomy for Sustainable Development, 35 (3): 1157-1166.
Florine Degrune*, Nicolas Theodorakopoulos*, Marc Dufrêne, Gilles Colinet, Bernard Bodson, Marie-Pierre Hiel, Bernard Taminiau, Carine Nezer, Georges Daube, Micheline Vandenbol, 2016. No favorable effect of reduced tillage on microbial community diversity in a silty loam soil (Belgium). Agriculture, Ecosystems and Environment, 224: 12-21.
Aboulkacem Lemtiri*, Florine Degrune*, Sophie Barbieux, Marie-Pierre Hiel, Marie Chélin, Nargish Parvin, Micheline Vandenbol, Frédéric Francis, Gilles Colinet, 2016. Crop residue management in arable cropping systems under temperate climate. Part 1: Soil biological and chemical (phosphorus and nitrogen) properties. A review. Biotechnologie, Agronomie, Société et Environnement, 20 (s1).IN PREPARATION
Florine Degrune, Nicolas Theodorakopoulos, Gilles Colinet, Bernard Bodson, Marie-Pierre Hiel, Bernard Taminiau, Carine Nezer, Georges Daube, Micheline Vandenbol, Martin Hartmann, 2017. Dynamics of microbial communities over the growing season in two contrasted tillage regimes. In preparation to be published in Frontiers in Microbiology.
CO-AUTHOR
Nicolas Theodorakopoulos, Margaux Lognoul, Florine Degrune, François Broux, Donat Regaert, Céline Muys, Bernard Heinesch, Bernard Bodson, Marc Aubinet, Micheline Vandenbol, 2016. Increased expression of bacterial amoA during an N2O emission peak in an agricultural field. Agronomy for Sustainable Development.
Marie-Pierre Hiel, Marie Chélin, Nargish Parvin, Sophie Barbieux, Florine Degrune, Aboulkacem Lemtiri, Gilles Colinet, Aurore Degré, Barnard Bodson, Sarah Garré, 2016. Crop residue management in arable cropping systems under temperate climate. Part 2: Soil physical properties and crop production. A review. Biotechnologie, Agronomie, Société et Environnement, 20 (s1).
ORAL COMMUNICATIONS
NATIONAL CONFERENCE
« Effets de pratiques agricoles de conservation sur la diversité microbienne et la dynamique des matières organiques dans des contextes pédologiques contrastés », Journée d’étude sur les sols (JES), Louvain-la-Neuve (BE), 6/07/2016.
MEETING PRESENTATIONS
« Agriculture et vie microbienne », Livre blanc, Gembloux ABT (BE), 26/2/2014.
« Farming effects on soil microbial diversity under contrasting soil types », Agroscope de Zürich, (CH), 20/4/2016.
POSTER COMMUNICATIONS
INTERNATIONAL CONFERENCES
« Impact of agricultural practices on soil microbial communities in Belgium », 2nd Thünen symposium on soil metagenomic, Braunschweig, Germany, 11-13/12/2013.
« Detecting microbial patterns in relation to soil agricultural practices and the plant development stage », The first Global Soil Biodiversity conference (GSB), Dijon, France, 2-5/12/2014.
« Soil microbial community composition changes according to the tillage practice and plant development stage », European Geosciences Union, Vienne, Austria, 12-17/4/2015.
« No favorable effect of reduced tillage on microbial communities in a silty loam soil (Belgium) », Ecology of soil microorganisms, Prague, Czech Republic, 29/11-3/12/2015. « Mise en place de pratiques agricoles de conservation : quel impact sur la vie du sol? »,
Traits Ecologiques et Biologiques des organismes du sol (TEBIS), Toulouse, France, 3-5/10/2016.
1
2
1. General context
Modern agriculture: benefits, trade-offs and future challenges
Since the Second World War, major advances in scientific and technological innovations have profoundly changed the face of modern agriculture. During this period, called the Green Revolution, the development of new high-yield crop varieties, the discovery of synthetic fertilizers, pesticides and herbicides, and technical improvements in mechanization have led to a considerable increase in global food production. The global production of cereal crops more than doubled between 1960 and 2000 (Tilman, 1999). With the main objective of the maximization of crop production, modern agriculture has become intensive.
Although the success of intensive agriculture in meeting the global food demand was immense, major environmental concerns have emerged (Tilman, 1998, 1999). For example, the systematic and excessive use of fertilizers causes the eutrophication of lakes and rivers (Smith et al., 1999), air pollution from increases in NOx emissions in the atmosphere (Smith et al., 1997) and the alteration of biodiversity (Allison et al., 2007; Vitousek et al., 1997). As a consequence, and alongside the ever increasing global population, which a United Nations report (2015) estimates will increase one-third by 2050, there is an urgent need to develop strategies to design new agricultural systems that are more productive, stable, and resilient while minimizing their environmental impact (Foley, 2005; Tilman, 1998).
Ecological intensification is a promising approach by which to meet the future challenges of agriculture (Bommarco et al., 2013; Doré et al., 2011). This concept is a part of agroecology, a larger concept that also includes socioeconomic aspects (Hatt et al., 2016), and it applies ecological principles to agricultural practices. The main objective of agroecology is to replace non-renewable external inputs with ecological processes (e.g. pollination, nutrient cycling, carbon decomposition) in order to diversify the ecosystem services (Box 1) and reduce the harm of agriculture (e.g. habitat loss, nutrient runoff) (Zhang et al., 2007).
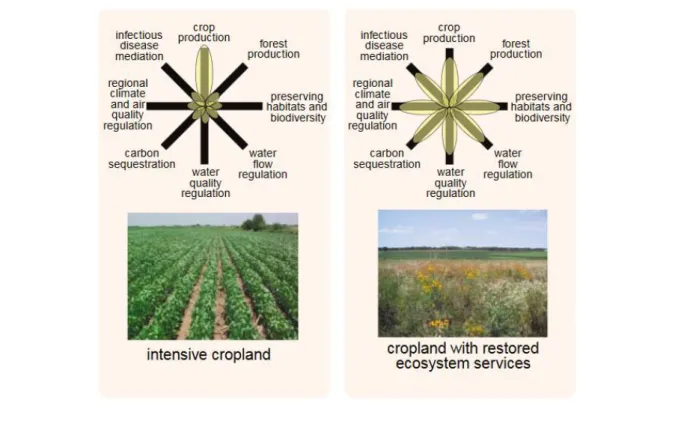
Unlike intensive agriculture, agroecological approach does more than just promote the production service (e.g. crop production), it promotes the diversity of ecosystem services, agricultural-based as well as non-agricultural-based (Figure 1) (Foley, 2005). Agroecosystems that provide multiple
3
ecosystem services are expected to be more resistant and resilient to external perturbations such as global climate change (Soliveres et al., 2016).
To date, however, even if the concept of agroecology is well known in South America for more than a decade (Altieri, 1999), how to successfully implement it in the wide range of climatic and pedological conditions found in Europe is still questioning.
Figure 1 Conceptual framework for comparing trade-offs of ecosystem services in intensive (left) and ecological-based (right) farming (according to Foley, 2005).
Box 1. Definitions of ecosystem services
As defined by the Millennium Ecosystem Assessment (2005), ecosystem services are the benefits humans obtain from ecosystems. They are grouped into four categories:
1. Supporting services, such as nutrient cycling and soil formation.
2. Regulating services, such as pest control, crop pollination, climate regulation, and water purification.
3. Provisioning services, such as food, fiber, fuel, and water.
4
Soil microbiome: a key factor for soil functioning
Soil biota maintain the soil functioning, and thus influence strongly agricultural productivity (Altieri, 1999; Barrios, 2007). Even if this productivity is driven by complex interactions between soil biota and abiotic factors (Kibblewhite et al., 2008), most soil processes related to organic matter transformation and nutrient cycling are mediated by microorganisms. Microorganisms are the most abundant and diverse group of soil organisms with one single gram of soil estimated to contain tens of thousands of species (Fierer et al., 2007b; Roesch et al., 2007). These species influence substantially the functioning of the soil ecosystem (Aislabie et al., 2013; East, 2013; Nannipieri et al., 2003; van der Heijden et al., 2008) and thus contribute to important agricultural services (e.g. food and fibre) and non-agricultural services (e.g. water quality and supply, erosion control, atmospheric composition and climate regulation) (Kibblewhite et al., 2008).
Microorganisms also contribute to soil aggregate formation and aeration, as well as carbon sequestration in agroecosystems (Six et al., 2006) that are important aspects in agricultural productivity and environmental issues. Some specific “key” groups such as the N-fixing bacterial symbionts of the legumes (Cleveland et al., 1999; Van Der Heijden et al., 2006), arbuscular mycorrhizal fungi (AMF) (Van der Heijden et al., 1998) and plant growth promoting rhizobacteria (PGPR) (Rodrı ́guez and Fraga, 1999) can substantially enhance plant productivity by supplying growth-limiting nutrients. In addition, since soil microorganisms can respond rapidly to environmental changes, they can be used as indicators to evaluate soil quality (Schloter et al., 2003).
To date, there is evidence that a loss in microbial diversity can affect important soil processes such as the nitrogen cycling (Philippot et al., 2013b). As a result, understanding and managing the soil biodiversity so that key soil processes are optimized is a major challenge in the context of ecological intensification, i.e. developing strategies to develop ecological-based agriculture (Lemanceau et al., 2014).
However, given the large abundance and diversity of soil microbiota, exploring its structure is still a challenge. In the past, some methodological limitations have prevented the exploration of soil microbial communities. Until the 1990s, most investigators used laboratory culture-dependent methods to explore microorganisms. However, only 1%-10% of microorganisms can be cultured.
5
The culture-dependent methods suffer from low detection, resolution and throughput and therefore, these methods are quite limited in capturing the complexity of microbial structures. With the recent development of DNA-based methods in the 1990s, which bypass the need for culturing, and with the rapid improvements in high-throughput DNA sequencing over the last decade (Cardenas and Tiedje, 2008; Glenn, 2011), we are now able to get insights into the immense taxonomic and functional structures of microbial communities in complex environments such as soils (Fierer et al., 2007b; Jung et al., 2016; Urich et al., 2008).
Soil tillage: benefits and detrimental effects
Soil tillage, which refers to all mechanical actions performed on soil, is an important component of agroecosystem management, and it has a significant impact on the soil properties (e.g. soil structure1, nutrient availability, and soil biological activity). Among the wide range of contemporary soil tillage practices, plowing – conventional tillage – is the most ancient. This has been used for centuries to optimize seed germination and root development by modifying soil conditions (Titi, 2002). Plowing i.e. soil conversion combined with burying plant residues in a depth of between 15 and 40 cm (according to the type of the machinery employed) has many short-term benefits, including notably weed and pest control, temporary relief of soil compaction, and the incorporation of plant residues, fertilizers and pesticides. Plowing proved to be effective in intensive agriculture in maximising the crop production.
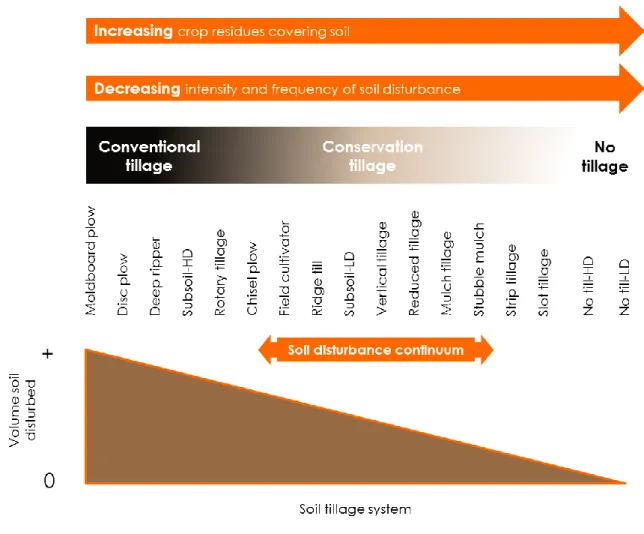
Besides these short-term benefits, however, there are long-term detrimental effects, such as soil erosion and loss of soil organic matter (Montgomery, 2007; Six et al., 1999). This has led to the development of alternative conservation tillage practices (e.g. reduced tillage). These soil practices aim to minimise soil disturbance, prevent soil degradation, and enhance both soil quality and crop productivity in agroecosystems (Hobbs et al., 2008; Pittelkow et al., 2014). To date, there is a wide range of conservation tillage practices available (Figure 2) that differ in terms of the volume of soil disturbed, the intensity and frequency of soil disturbance, and the amount of crop residues covering soil (Reicosky, 2015).
6
In Europe, however, the success of the implementation of such conservation practices is still unclear and debated. Success seems to depend on a variety of different factors, including crop rotation, soil type, and regional climate. In certain conditions, the implementation of conservation practices can lead to detrimental effects on soil quality, such as increased bulk density and acidity near surface (Basch et al., 2015).
Figure 2 Schematic representation of soil disturbance continuum associated with different tillage practices ranging from conventional tillage (highest soil disturbance) to no tillage (lowest soil disturbance). HL=high disturbance and LD=low disturbance. Source: modified after Reicosky (2015).
7
2. Context, objectives and outline of the thesis
Context
The present study was part of the AgricultureIsLife research platform, a larger project launched in 2013 at Gembloux Agro-Bio Tech. The research platform is based on collaborative work associated with a multidisciplinary approach involving several scientists for the exploration of innovations to improve the sustainability of agriculture in temperate Western Europe (Monty et al., 2016).
Of the five key innovation themes of the research platform, one was dedicated to the management of different quantities of crop residues under different tillage practices (conventional vs. conservation) and its impact on agronomical (e.g. crop yield, weed control) and soil (e.g. soil structure, microbial diversity) properties.
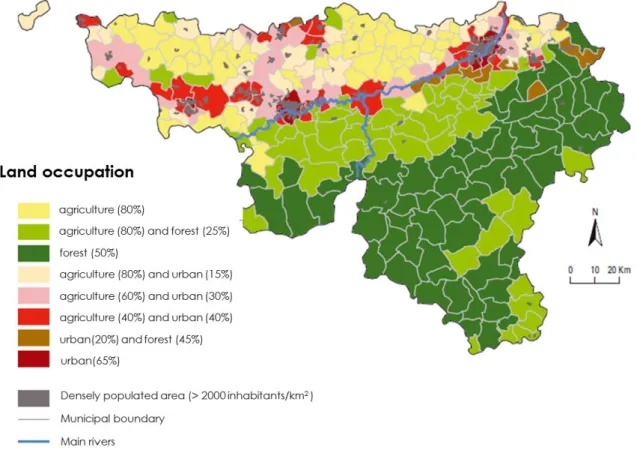
This theme is of particular importance in the upper part of Wallonia as the region is mostly occupied by cropping systems (Figure 3), with 80% of land used for agriculture. As a result, questions related to the implementation of conservation soil practices and its impact on the structure of soil microbiota are strongly oriented to developing more sustainable agriculture.
To date, however, the way the structure of the soil microbiota responds to soil tillage practice (conventional or conservation) associated with different quantities of crop residues in our agricultural region remains unexplored.
Even if a few studies have examined the structure of the soil microbial communities in relation to different soil tillage practices associated with different crop residue managements while using high-throughput sequencing technology (Carbonetto et al., 2014; Dorr de Quadros et al., 2012; Jiménez-Bueno et al., 2016; Navarro-Noya et al., 2013a; Sengupta and Dick, 2015), most of them are located in an area of the world characterized by specific local edaphic and climatic conditions, and strongly at variance with conditions in upper Wallonia, which in turn can lead to contrasting results.
Therefore, given the strong dependence of the soil properties caused by soil tillage on local edaphic and climatic conditions, the impact of different soil management practices on the structure of microbial communities in upper Wallonia is of primary interest in the context of developing more productive, stable, and resilient agriculture while minimizing its environmental impact in the region.
8
Figure 3 Map showing land use in Wallonia (South part of Belgium). The upper part of Wallonia (north of the river) is mostly occupied by cropping systems. Source: SPF Economie - DGSIE
9
Box 2: Diversity metrics used to infer the structure of microbial communities.
Alpha-diversity (α): it refers to the species diversity in a single sample unit, and was assessed using three metrics: the number of species (S), the Shannon index, and the Smith-Wilson evenness index (Smith and Wilson, 1996).
Beta-diversity (β): it refers to the difference in
species composition among sampling units, and was
assessed using the Bray-Curtis dissimilarity metric (Bray and Curtis, 1957), calculated from differences in abundance of each species.
Objectives
In our study, we aimed (1) to identify the effects of different soil treatments – tillage regime (CT: conventional and RT: reduced tillage) and crop residue management (R+: residue retention and R-: residue removal) – on the structure of soil microbial communities, i.e. on α- and β-diversity (Whittaker, 1972) (Box 2) and (2) to identify the soil-treatment-related soil physical and chemical parameters that might explain the observed effects. We further investigated soil treatment effects in relation to soil depth (top soil: 0 to 5 cm, deep soil: 15 to 20 cm) and over the growing season of two crops: Vicia faba (fababean) and Triticum aestivum (wheat). To achieve the goals, we aimed to answer the following questions:
1. Do soil treatments affect microbial α- and β-diversity and soil physical and chemical parameters? Is there a relationship between microbial patterns and soil parameters?
2. Do depth and season modify the magnitude of soil treatment effects on microbial α- and β-diversity?
3. Can we relate differences in α- and β-diversity to ecological meanings?
To answer these questions, we tested the following hypotheses (Table 1).
Table 1 Statement of our assumptions.
H1 In general, microbial α- and β- diversity change with the tillage regime, RT promoting higher species diversity than CT.
H2 Under CT, microbial α- and β- diversity are similar in the top soil and deep soil. Under RT, microbial α- and β- diversity change with depth so that species diversity is higher in the top soil than in the deep soil.
H3 The effect of tillage regime on microbial α- and β- diversity varies during the growing season of the plant considered (fababean or wheat), and the difference between RT and CT diminishes over time. RT = reduced tillage; CT = conventional tillage; top soil = 0 to 5 cm; deep soil = 15 to 20 cm.
10 Outline
This study is a compilation of scientific papers that have been published or are being reviewed. It is structured as follows:
Chapter II reviews the state of the art on the effects of crop residue management on biological, chemical, and physical properties in arable cropping systems under a temperate climate. This review is a collaborative work that has been integrated into the special issue ‘AgricultureIsLife project’. Part 1 is presented in this chapter. Reference: Lemtiri, Degrune et al. (2016), in Biotechnologie, Agronomie, Société et Environnement (BASE).
Chapter III (H1) describes an original method that improves the resolution of the analysis used to detect microbial patterns related to the tillage regime and crop residue management. To test the method, data collected in 2013 at the seedling stage of Vicia faba was used. Reference: Degrune et al. (2015), in Agronomy for Sustainable Development (ASD).
Chapter IV (H2) explores the microbial patterns associated with tillage regime and crop residue management at different soil depths (0 to 5 cm and 15 to 20 cm) at the grain filling stage for Triticum aestivum. Reference: Degrune et al. (2016), in Agriculture, Ecosystems & Environment.
Chapter V (H3) summarizes the data of the entire two-year experiment. It focuses on the effects of tillage regime and crop residue management both overall and in relation to the growing stage of Vicia faba or Triticum aestivum. Reference: Degrune et al. (2017, in prep), in Frontiers in Microbiology.
Finally, in Chapter VI we discuss the main results and we also include consideration of prospects and potential improvements.
11
3. Site description, experimental design and sampling
protocol
Site description
The SOLRESIDUS long-term experiment is located on the experimental farm of Gembloux Agro-Bio Tech. The climate of the region is oceanic temperate and the soil type is classified as Cutanic Luvisol according to the FAO. The soil texture is silt loam and largely dominated by silt (70-80%), clay (18-22%) and sand (5-10%), and the organic matter is characterized by a C:N ratio between 10 and 12.
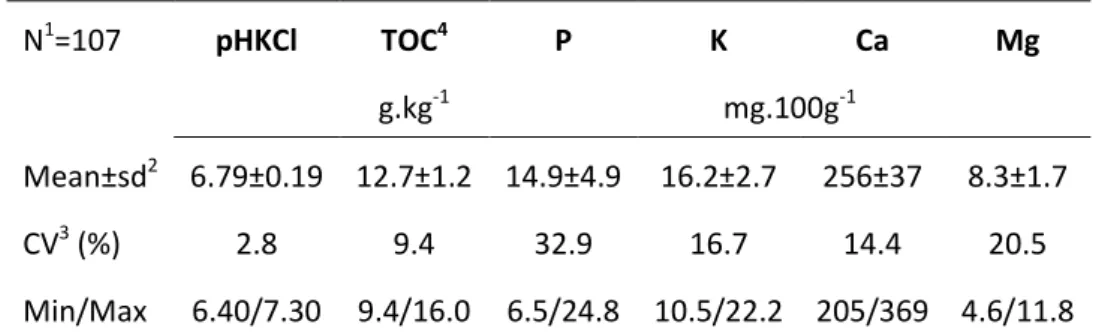
The chemical soil fertility of the experiment was evaluated at the beginning of the project, in 2011 (Colinet et al., 2013) for the following soil parameters: pH, total organic carbon and available elements (P, K, Ca, Mg). The summary of descriptive statistics is provided in Table 2 and the spatial variability is depicted in Figure 4 to Figure 9.
Table 2 Descriptive statistics of SOLRESIDUS soil parameters.
N1=107 pHKCl TOC4 P K Ca Mg g.kg-1 mg.100g-1 Mean±sd2 6.79±0.19 12.7±1.2 14.9±4.9 16.2±2.7 256±37 8.3±1.7 CV3 (%) 2.8 9.4 32.9 16.7 14.4 20.5 Min/Max 6.40/7.30 9.4/16.0 6.5/24.8 10.5/22.2 205/369 4.6/11.8 1
number of samples/2standard deviation
3
12
Figure 4 Map of soil pH in the 0-30 cm soil horizon in SOLRESIDUS experiment. The map was obtained using the Kriging method for interpolation with the software ArcGIS.
13
Figure 5 Map of soil total organic carbon (TOC) in the 0-30 cm soil horizon in SOLRESIDUS experiment. The map was obtained using Kriging method for interpolation with the software ArcGIS.
14
Figure 6 Map of phosphorus (P) availability in the 0-30 cm soil horizon in SOLRESIDUS experiment. The map was obtained using the Kriging method for interpolation with the software ArcGIS.
15
Figure 7 Map of the potassium (K) availability in the 0-30 cm soil horizon in SOLRESIDUS experiment. The map was obtained using the Kriging method for interpolation with the software ArcGIS.
16
Figure 8 Map of potassium (K) availability in the 0-30 cm soil horizon in SOLRESIDUS experiment. The map was obtained using the Kriging method for interpolation with the software ArcGIS.
17
Figure 9 Map of magnesium (Mg) availability in the 0-30 cm soil horizon in SOLRESIDUS experiment. The map was obtained using the Kriging method for interpolation with the software ArcGIS.
18 Experimental design
The experimental design of SOLRESIDUS and the different soil treatments have been applied since autumn 2008. Before 2008, the site was under conventional tillage. The design of the experimental field consisted of a Latin square arrangement with 16 plots (Figure 10): four soil treatments replicated four times. Each plot is 40 meters long and 15 meters wide. The different soil treatments were as follows: conventional tillage with residue removal (CT/R-), conventional tillage with residue retention (CT/R+), reduced tillage with residue retention (RT/R+), and reduced tillage with residue removal (RT/R-).
The residues removed consisted of harvestable straw, while stubbles and chaffs were left on the field in both R+ and R-. In all plots, stubble breaking at a depth of 10 cm was performed to bury the residues. After stubble breaking, plowing to a depth of 25 cm was applied only to the CT plots, with a moldboard plow (Figure 11). Seedbed preparation was identical on all plots and was performed at a depth of 7 cm.
Fertilizer, fungicide, and weedkiller treatments were applied equally to each plot. The dates of the different soil operations are provided in supplementary material (S1).
Crops are rotated on the studied field and crop history is as follows: Brassica napus (2009), Triticum aestivum (2010, 2011 and 2012), Vicia faba (2013), and Triticum aestivum (2014).
19
Figure 10 Experimental design of the SOLRESIDUS experiment. Each treatment, i.e. CT/R+, CT/R-, RT/R+ and RT/R- is replicated four times in a Latin square arrangement. RT=reduced tillage, CT=conventional
tillage, R+=crop residues retention, and R-=crop residues removal
Figure 11 Moldboard plow employed on CT plots to mix and invert soil to a depth of 25 cm. Image credit: Marie-Pierre Hiel.
20 Sampling protocol
The sampling protocol is presented in Figure 12. Soil samples were collected from the deep soil (15 to 20 cm) of each of the 16 plots in 2013 (faba bean) and 2014 (wheat), at different growing stages (seedling, leaf development, and flowering stages for faba bean, tillering and grain filling stages for wheat). The soil sampling dates are provided in S1. An additional sampling of the top soil horizon (0 to 5 cm) was performed at the grain filling stage for wheat.
Each soil sample was a composite of six randomly selected soil cores of 5 cm length and 2 cm diameter, collected with an auger as close as possible from the stem and in a delimited area of 6m2 sizes moving every year. One single composite soil sample was collected on each plot.The collected soil samples were stored at 4°C for downstream chemical and physical analysis, and at -20°C for downstream microbiological analysis.
In our study, the choice of the sampling depth was based on two main criteria: (1) low dependency of soil conditions on atmospheric fluctuation – we expected more fluctuations at the top soil horizon, and (2) a maximisation of differences in physical and chemical soil conditions between CT and RT – the deep soil horizon in RT was undisturbed for the last 6 years, while the top soil horizon was disturbed through stubble breaking. The soil below 20 cm was not considered as the plow-pan occurred around that depth.
Figure 12 Schematic representation of the soil sampling protocol performed on all plots of the SOLRESIDUS experiment. Each sampling is represented by a star and the soil depth of the sampling is in orange text.
21
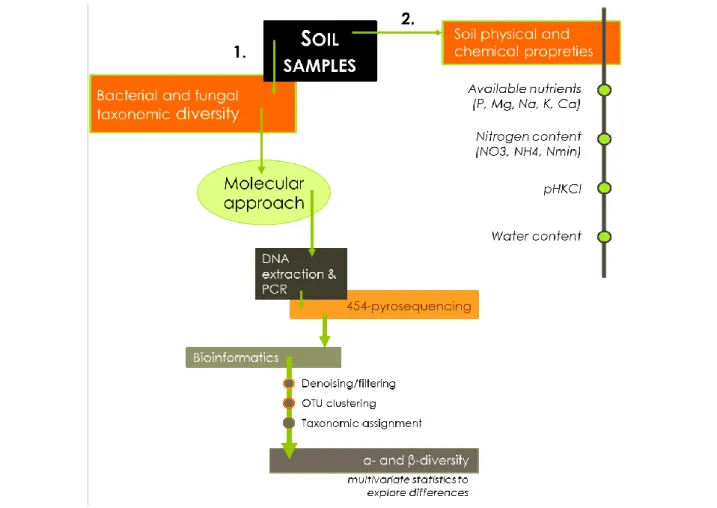
On each soil sample (Figure 13), we determined (1) bacterial and fungal α- and β- diversity using a molecular approach and (2) the soil physical and chemical properties including the water-extractable elements (P, Mg, Na, K, Ca, HWC), the content of nitrates (NO3), ammonium (NH4) and mineral nitrogen (Nmin), the pHKCl, and the water content. The methods used to determine the Soil physical and chemical properties are detailed in chapters III to V. The methodology used to characterize the microbial diversity is explained in a nutshell in the next section.
Figure 13 Diagram of what variables are studied. On each soil sample, (1) bacterial and fungal diversity was determined using molecular approach and (2) the soil physical and chemical properties were evaluated. The different steps to evaluate the taxonomic diversity of microbial communities is detailed and includes the DNA extraction, amplification of genetic marker, bioinformatics to cure and assign the sequences, and statistical analysis to explore the differences in taxonomic diversity among the different soil treatments.
22
5. Methods used to explore the soil microbiome
In our study, we used an amplicon-based sequencing approach to explore the taxonomic diversity of soil microbial communities. This molecular method is based on the analysis of DNA directly extracted from soil samples. In a nutshell, this method is based on the amplification of a genetic marker, which is a short gene fragment found in all organisms. In our study, we used the small subunit (SSU) 16S ribosomal gene (rDNA) for bacteria and the large subunit (LSU) 28S rDNA for fungi. The ribosomal gene features key characteristics that are required to be a good genetic marker: universally present in all organisms, featuring short variable regions of high information content (allow for species distinction), high conserved regions (to anchor primer), and very low rate of lateral gene transfer (stable in time).
DNA-amplicons, generated from the PCR amplification of the 16S bacterial and 28S fungal ribosomal gene, can be used in downstream analysis to characterize the taxonomic structure of microbial communities. In our study, we used the high-throughput 454-pyrosequencing technology, a next-generation sequencing technology that allow for the taxonomic identification of microorganisms at higher resolution, coverage and throughput that what was possible with older DNA sequencing technologies of first generation (e.g. Sanger) (Glenn, 2011). An overview of the different steps of the 454-pyrosequencing technology is presented in Figure 14, according to Mardis et al., (2008).
The raw sequences obtained are further processed in downstream bioinformatics analysis through three main steps that are: (1) curation of the sequences, (2) sequence clustering into operational taxonomic unit (OTU), and (3) taxonomic assignment (Figure 13).
Following the curation of the sequences, i.e. increasing the quality of data by removing notably the PCR- and sequencing-based errors, the sequences are clustered into OTUs, refers as individuals, based on their percentage of similarity. In our study, we used the standard 97% cutoff to cluster sequences into OTUs. This clustering approach allows one to deal with the “uncultured” and “unclassified” microbial sequences. In that way, these sequences that are usually highly abundant in soil ecosystems are considered in the total diversity. The assignment of each OTU to taxonomy, i.e. phylum, class, order, family, genus and “species” was performed by comparing sequences with sequences of reference from SILVA (Pruesse et al., 2007), one of available reference databases. The final table, containing information on the taxonomic assignment and the relative abundance of
23
each OTU in each sample, is used in downstream statistical analysis to explore the differences in microbial diversity among samples. In our study, we used multivariate statistical analysis to explore these differences including notably ordination methods and permutation tests (Anderson et al., 2006; Buttigieg and Ramette, 2014).
Figure 14 454-pyrosequencing workflow (adapted from Mardis et al., (2008)). The library construction ligates adaptors to DNA fragments that are further attached on beads and amplified millions of times in emulsion PCR. The beads are loaded into plate wells with enzymes for sequencing. The pyrosequencing reaction is based on the emission of a light signal when a new base (ACGT) is incorporated. The output sequences are further processed in downstream bioinformatics analysis.